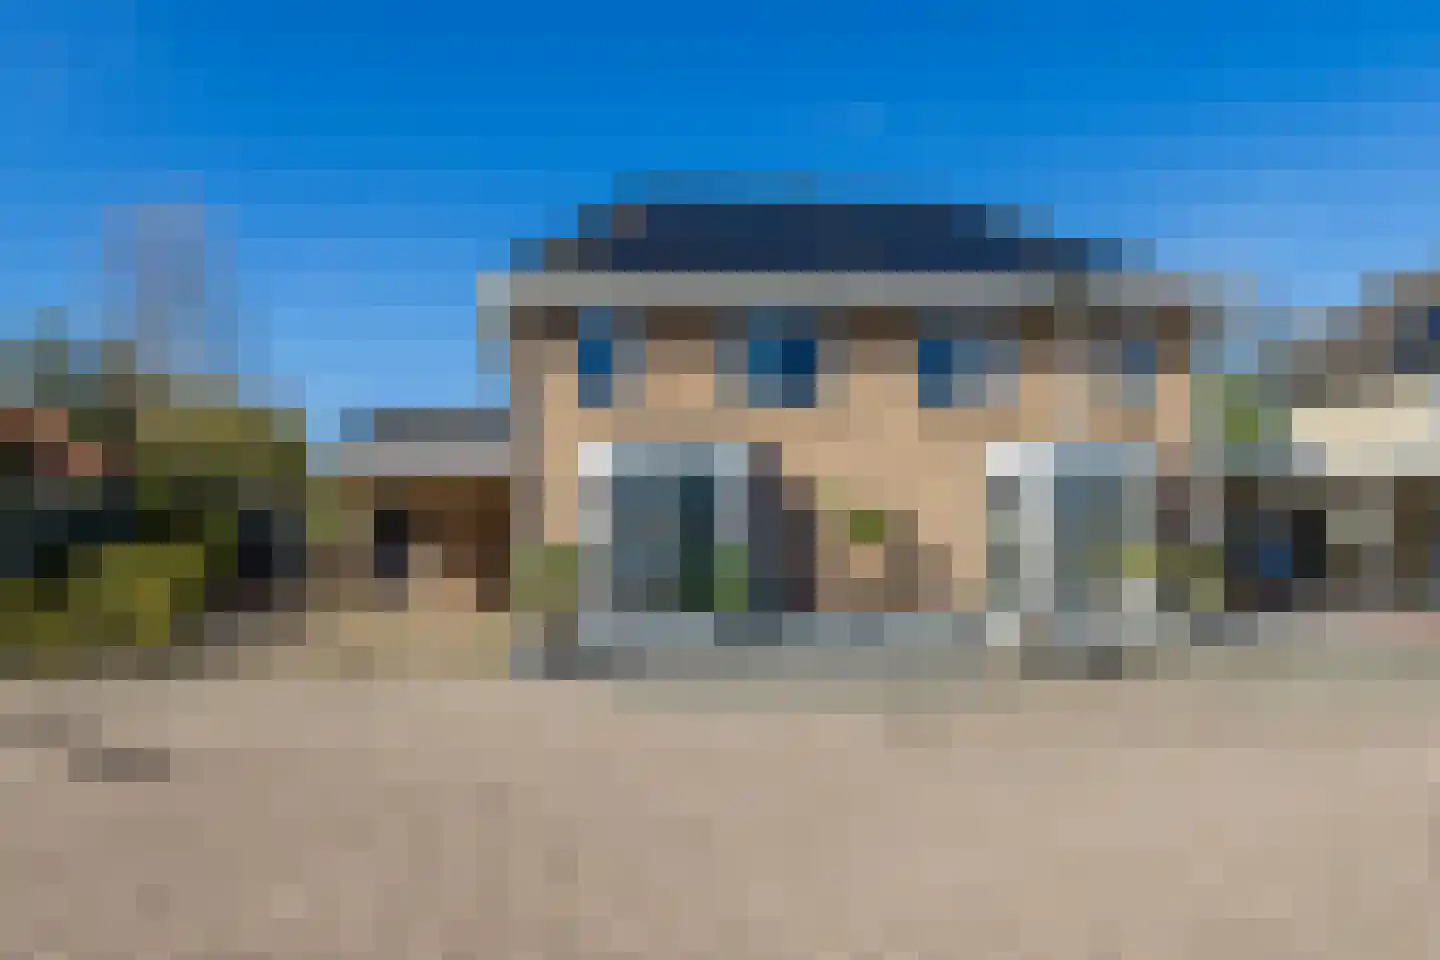
- Available
Kruittorenstraat 6
7126BH Bredevoort
€ 799.000 k.k.
€ 2.708/m²
- Living area
- 295 m²
- Land area
- 1025 m²
- Bedrooms
- 4
Searching in 17 houses in Bredevoort
Type to search. Use arrow down and arrow up to navigate through results and press Enter to open.
Hidden search suggestions.
View current properties in Bredevoort or search targeted on street, postal code and property characteristics.
View the current housing stock in Bredevoort and quickly filter by price, living area, rooms and more. There are currently 17 houses in this place within our selection. View also 12 sold houses in Bredevoort for extra insight into the local housing market.
7126BH Bredevoort
€ 799.000 k.k.
€ 2.708/m²
7126CA Bredevoort
€ 499.005 k.k.
€ 3.119/m²
7126AX Bredevoort
€ 445.000 k.k.
€ 2.119/m²
7126CN Bredevoort
€ 374.073 k.k.
€ 3.170/m²
7126CP Bredevoort
€ 569.000 k.k.
€ 3.491/m²
7126AE Bredevoort
€ 424.015 k.k.
€ 3.719/m²
7126BZ Bredevoort
€ 275.000 k.k.
€ 3.929/m²
7126AW Bredevoort
€ 235.000 k.k.
€ 3.405/m²
7126CM Bredevoort
€ 289.500 k.k.
€ 3.146/m²
7126BX Bredevoort
€ 298.024 k.k.
€ 3.465/m²
7126CA Bredevoort
€ 449.005 k.k.
€ 4.726/m²
7126BB Bredevoort
€ 309.000 k.k.
€ 2.809/m²
7126BS Bredevoort
€ 306.000 k.k.
€ 2.732/m²
7126BJ Bredevoort
€ 185.000 k.k.
€ 5.967/m²
7126AT Bredevoort
€ 348.500 k.k.
€ 2.722/m²
7126BM Bredevoort
€ 349.000 k.k.
€ 3.116/m²
7126BJ Bredevoort
€ 224.017 k.k.
€ 0/m²
Get free quotes from real estate agents with local market knowledge. Compare more than 16 real estate agents in Bredevoort.
Selling a home in Bredevoort? Compare all real estate agents in Bredevoort or view the top 10 real estate agents in Bredevoort for extra context for your choice.
Real estate agents make sharper offers when they know you're comparing — ask for quotes for sale or purchase.
Practical answers about housing supply, sales and comparing real estate agents in Bredevoort.
The costs of a real estate agent in Bredevoort depend on commission, setup costs, property presentation and the chosen service. Compare the 16 real estate agents in Bredevoort via the real estate agent page and request multiple quotes to compare rates and approach well.
Within our selection, we are currently showing 17 houses in Bredevoort. View also the sold houses in Bredevoort to compare the current offering with recent transactions.
Take into account not only price and living area but also maintenance, energy label, location, outdoor space and sales status. This way you compare houses in Bredevoort on more than just the asking price.
A local real estate agent knows the neighborhoods, recent transactions and demand in Bredevoort. By comparing 16 real estate agents in the region you get a better insight into prices, sales strategy and expected yield; the top 10 in Bredevoort provides a useful starting point.
Yes, when making a sales plan, a valuation in Bredevoort is wise. You gain insight into a realistic asking price and can then compare offers from real estate agents specifically.
View current location data on residents, WOZ development, housing stock, energy consumption, business activity and safety in Bredevoort. In 2026 were there 1.456 residents. The average WOZ value in 2025 is EUR 307.000.
These figures help to better assess and compare the housing stock in Bredevoort with recent sold homes. Orient yourself then on suitable top real estate agents in Bredevoort for sales advice in this region.
Residents
1.456
Last year: 2026
Average WOZ
EUR 307.000
Last year: 2025
Average income per person.
EUR 28.700
Source: AllNumbers
Crimes (current year)
21
Total registered
| Year | Residents |
|---|---|
| 2021 | 1.450 |
| 2022 | 1.460 |
| 2023 | 1.475 |
| 2024 | 1.470 |
| 2025 | 1.440 |
| 2026 | 1.456 |
| Year | Average WOZ |
|---|---|
| 2021 | EUR 208.000 |
| 2022 | EUR 233.000 |
| 2023 | EUR 275.000 |
| 2024 | EUR 293.000 |
| 2025 | EUR 307.000 |
Hoger
280
Praktisch
240
Middelbaar
570
Europa
70
Nederland
1.325
Buiten Europa
50
Label C
153
Label G
151
Label A
115
Label D
75
Label F
75
Label B
73
Label E
52
Label A++
6
Label A+++
6
Label A+
3
Label A++++
0
Label A+++++
0
| Year | Gas (m3) | Electricity (kWh) |
|---|---|---|
| 2020 | 1.260 | 2.740 |
| 2021 | 1.410 | 2.810 |
| 2022 | 1.110 | 2.620 |
| 2023 | 910 | 2.560 |
| 2024 | 890 | 2.650 |
Hoekwoning
Gas: 870 • Electricity: 2.380
Huurwoning
Gas: 720 • Electricity: 1.830
Koopwoning
Gas: 970 • Electricity: 2.800
Appartement
Gas: 550 • Electricity: 1.710
Tussenwoning
Gas: 820 • Electricity: 2.390
Vrijstaande woning
Gas: 1.190 • Electricity: 3.330
Twee-onder-één-kap woning
Gas: 980 • Electricity: 2.680
Total number of company establishments: 160
| Period | Crimes |
|---|---|
| jan 2026 | 3 |
| jul 2025 | 2 |
| jun 2025 | 1 |
| mei 2025 | 0 |
| mrt 2025 | 2 |
| mrt 2026 | 2 |
| nov 2024 | 0 |
| nov 2025 | 2 |
| okt 2024 | 2 |
| okt 2025 | 3 |
| sep 2024 | 1 |
| sep 2025 | 0 |
These figures give an indicative picture of safety trends in the living environment of Bredevoort.
Short answers based on current local statistics, handy for a quick comparison of the living environment.
Bredevoort telt in 2026 ongeveer 1.456 inwoners.
De gemiddelde WOZ-waarde in Bredevoort is in 2025 circa € 307.000.
Het gemiddelde inkomen per inwoner in Bredevoort ligt rond € 28.700 per jaar.
Voor het huidige jaar gaat het om ongeveer 21 geregistreerde misdrijven. Gebruik deze cijfers als indicatie en vergelijk trends per periode.
In Bredevoort komt vooral "Tussenwoningen" veel voor, met ongeveer 180 woningen.