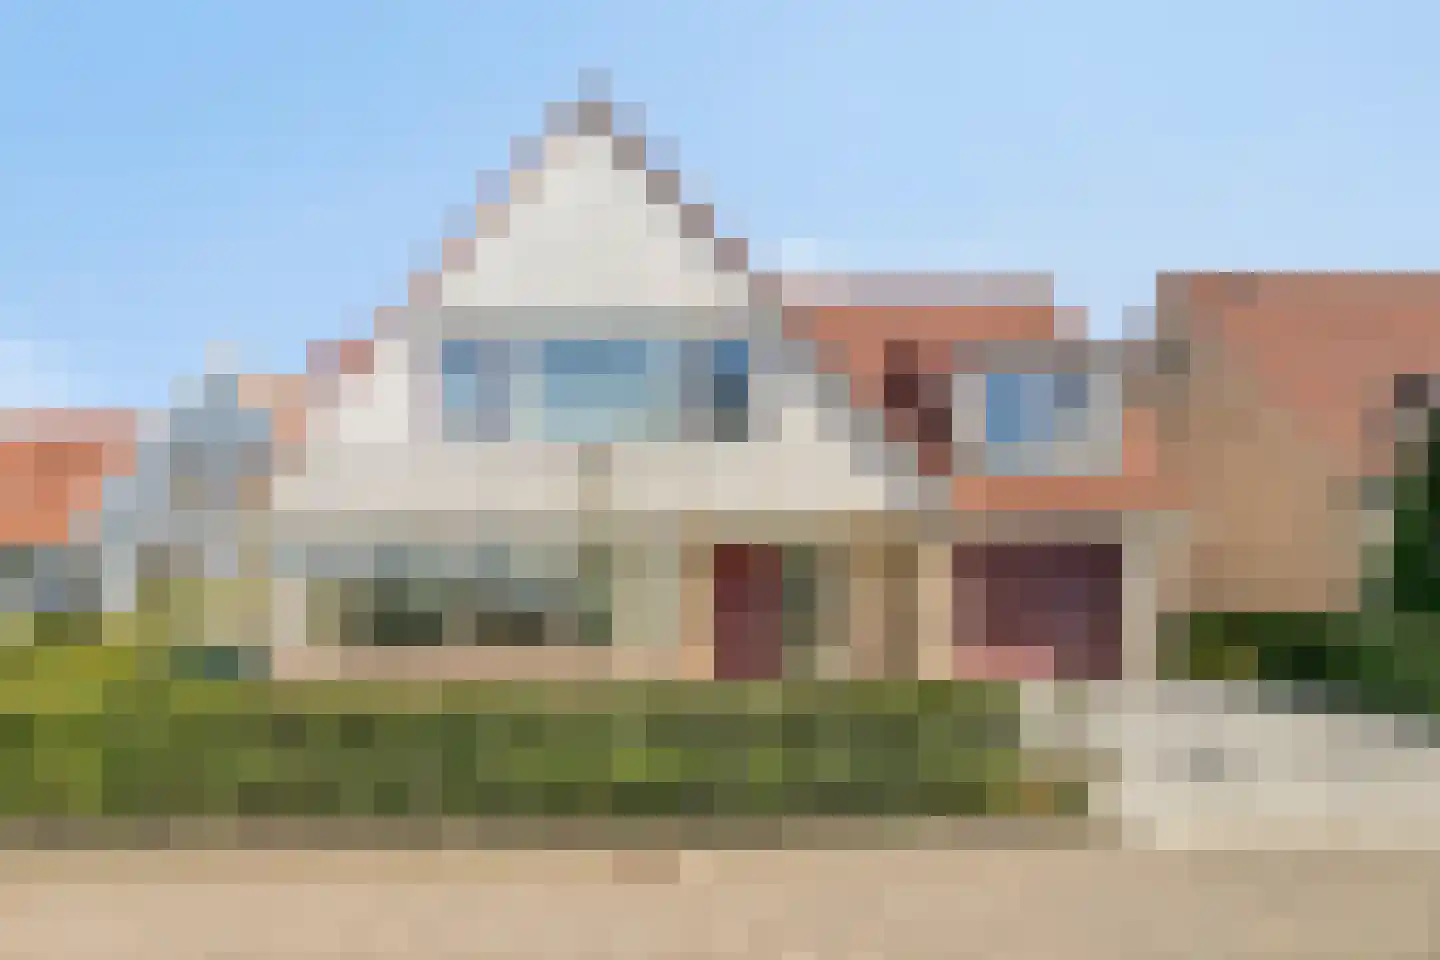
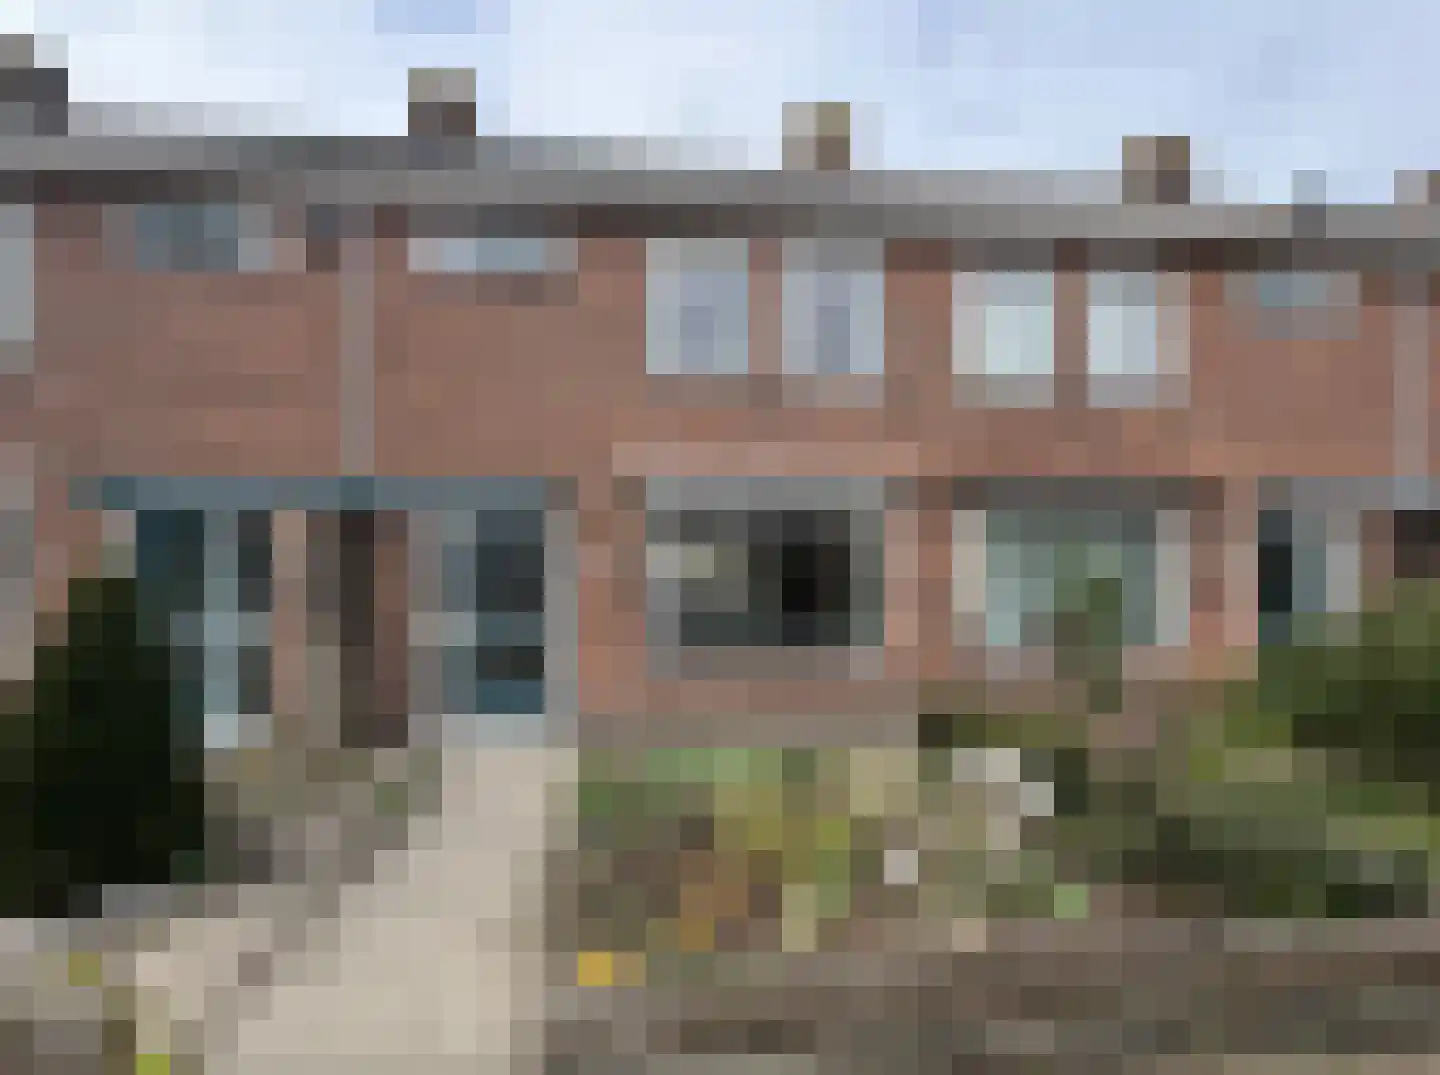
- Available
Keerngouw 14
1151BC Broek in Waterland
€ 750.000 k.k.
€ 9.036/m²
- Living area
- 83 m²
- Land area
- 396 m²
- Bedrooms
- 1
Searching in 19 houses in Broek in Waterland
Type to search. Use arrow down and arrow up to navigate through results and press Enter to open.
Hidden search suggestions.
View current properties in Broek in Waterland or search targeted on street, postal code and property characteristics.
View the current housing stock in Broek in Waterland and quickly filter by price, living area, rooms and more. There are currently 19 houses in this place within our selection. View also 11 sold houses in Broek in Waterland for extra insight into the local housing market.
1151BC Broek in Waterland
€ 750.000 k.k.
€ 9.036/m²
1151CJ Broek in Waterland
€ 1.250.000 k.k.
€ 12.376/m²
1151AP Broek in Waterland
€ 1.595.000 k.k.
€ 8.307/m²
1151GA Broek in Waterland
€ 1.250.000 k.k.
€ 9.058/m²
1151BH Broek in Waterland
€ 375.000 k.k.
1151AC Broek in Waterland
€ 1.950.000 k.k.
€ 6.964/m²
1151CZ Broek in Waterland
€ 1.650.000 k.k.
€ 7.205/m²
1151AR Broek in Waterland
€ 1.325.000 k.k.
€ 9.532/m²
1151AG Broek in Waterland
€ 1.295.000
€ 7.115/m²
1151AG Broek in Waterland
€ 1.250.000
€ 6.868/m²
1151AG Broek in Waterland
€ 975.000
€ 7.800/m²
1151ER Broek in Waterland
€ 1.250.000 k.k.
€ 7.225/m²
1151BL Broek in Waterland
€ 695.000 k.k.
€ 5.560/m²
1151AW Broek in Waterland
€ 675.000 k.k.
€ 0/m²
1151BN Broek in Waterland
€ 600.000 k.k.
€ 4.761/m²
1151EP Broek in Waterland
€ 750.000 k.k.
€ 6.097/m²
1151GC Broek in Waterland
€ 645.000 k.k.
€ 6.028/m²
1151AL Broek in Waterland
€ 1.000.000 k.k.
€ 7.142/m²
1151CN Broek in Waterland
€ 795.000 k.k.
€ 5.845/m²
Get free quotes from real estate agents with local market knowledge. Compare more than 156 real estate agents in Broek in Waterland.
Selling a home in Broek in Waterland? Compare all real estate agents in Broek in Waterland or view the top 10 real estate agents in Broek in Waterland for extra context for your choice.
Real estate agents make sharper offers when they know you're comparing — ask for quotes for sale or purchase.
Practical answers about housing supply, sales and comparing real estate agents in Broek in Waterland.
The costs of a real estate agent in Broek in Waterland depend on commission, setup costs, property presentation and the chosen service. Compare the 156 real estate agents in Broek in Waterland via the real estate agent page and request multiple quotes to compare rates and approach well.
Within our selection, we are currently showing 19 houses in Broek in Waterland. View also the sold houses in Broek in Waterland to compare the current offering with recent transactions.
Take into account not only price and living area but also maintenance, energy label, location, outdoor space and sales status. This way you compare houses in Broek in Waterland on more than just the asking price.
A local real estate agent knows the neighborhoods, recent transactions and demand in Broek in Waterland. By comparing 156 real estate agents in the region you get a better insight into prices, sales strategy and expected yield; the top 10 in Broek in Waterland provides a useful starting point.
Yes, when making a sales plan, a valuation in Broek in Waterland is wise. You gain insight into a realistic asking price and can then compare offers from real estate agents specifically.
View current location data on residents, WOZ development, housing stock, energy consumption, business activity and safety in Broek in Waterland. In 2025 were there 2.715 residents. The average WOZ value in 2025 is EUR 695.000.
These figures help to better assess and compare the housing stock in Broek in Waterland with recent sold homes. Orient yourself then on suitable top real estate agents in Broek in Waterland for sales advice in this region.
Residents
2.715
Last year: 2025
Average WOZ
EUR 695.000
Last year: 2025
Average income per person.
EUR 43.400
Source: AllNumbers
Crimes (current year)
61
Total registered
| Year | Residents |
|---|---|
| 2021 | 2.745 |
| 2022 | 2.775 |
| 2023 | 2.810 |
| 2024 | 2.760 |
| 2025 | 2.715 |
| Year | Average WOZ |
|---|---|
| 2021 | EUR 543.000 |
| 2022 | EUR 590.000 |
| 2023 | EUR 655.000 |
| 2024 | EUR 671.000 |
| 2025 | EUR 695.000 |
Hoger
1.070
Praktisch
300
Middelbaar
560
Europa
210
Nederland
2.240
Buiten Europa
270
Label A
292
Label C
273
Label B
158
Label G
156
Label D
109
Label F
63
Label E
38
Label A+++
13
Label A+
8
Label A++
4
Label A++++
1
Label A+++++
0
| Year | Gas (m3) | Electricity (kWh) |
|---|---|---|
| 2020 | 1.480 | 3.220 |
| 2021 | 1.660 | 3.300 |
| 2022 | 1.280 | 3.070 |
| 2023 | 1.080 | 2.870 |
| 2024 | 1.060 | 2.950 |
Hoekwoning
Gas: 1.080 • Electricity: 2.480
Huurwoning
Gas: 670 • Electricity: 1.970
Koopwoning
Gas: 1.250 • Electricity: 3.250
Appartement
Gas: 470 • Electricity: 1.950
Tussenwoning
Gas: 890 • Electricity: 2.190
Vrijstaande woning
Gas: 1.560 • Electricity: 4.210
Twee-onder-één-kap woning
Gas: 1.170 • Electricity: 3.030
Total number of company establishments: 605
| Period | Crimes |
|---|---|
| jan 2025 | 7 |
| jan 2026 | 2 |
| jul 2025 | 8 |
| jun 2025 | 3 |
| mei 2025 | 7 |
| mrt 2025 | 2 |
| nov 2024 | 3 |
| nov 2025 | 1 |
| okt 2024 | 9 |
| okt 2025 | 4 |
| sep 2024 | 5 |
| sep 2025 | 5 |
These figures give an indicative picture of safety trends in the living environment of Broek in Waterland.
Short answers based on current local statistics, handy for a quick comparison of the living environment.
Broek in Waterland telt in 2025 ongeveer 2.715 inwoners.
De gemiddelde WOZ-waarde in Broek in Waterland is in 2025 circa € 695.000.
Het gemiddelde inkomen per inwoner in Broek in Waterland ligt rond € 43.400 per jaar.
Voor het huidige jaar gaat het om ongeveer 61 geregistreerde misdrijven. Gebruik deze cijfers als indicatie en vergelijk trends per periode.
In Broek in Waterland komt vooral "Vrijstaande woningen" veel voor, met ongeveer 290 woningen.