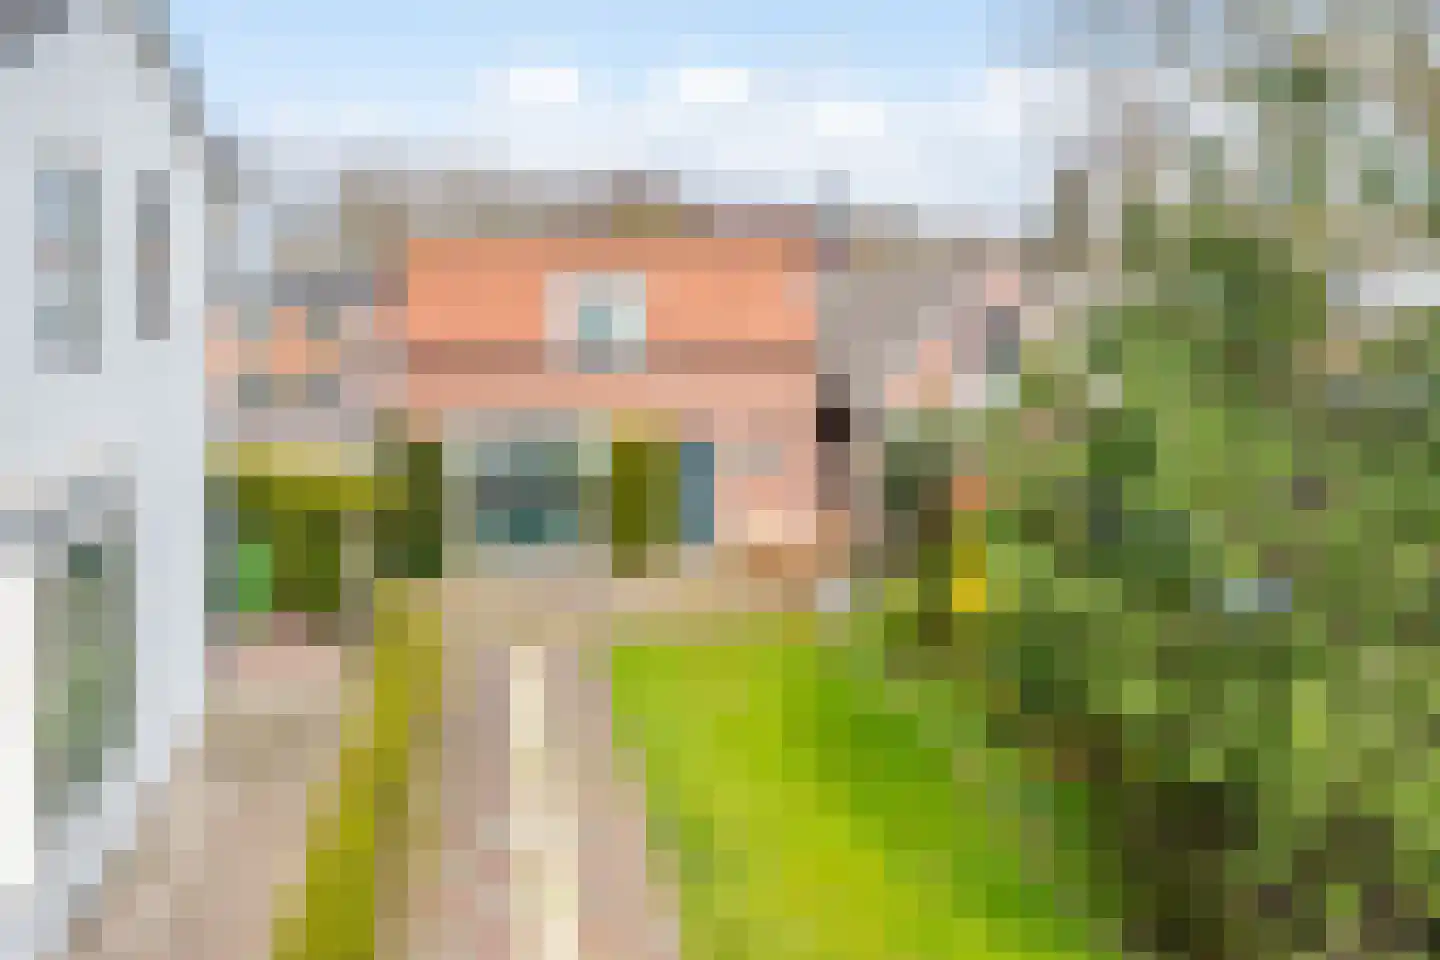
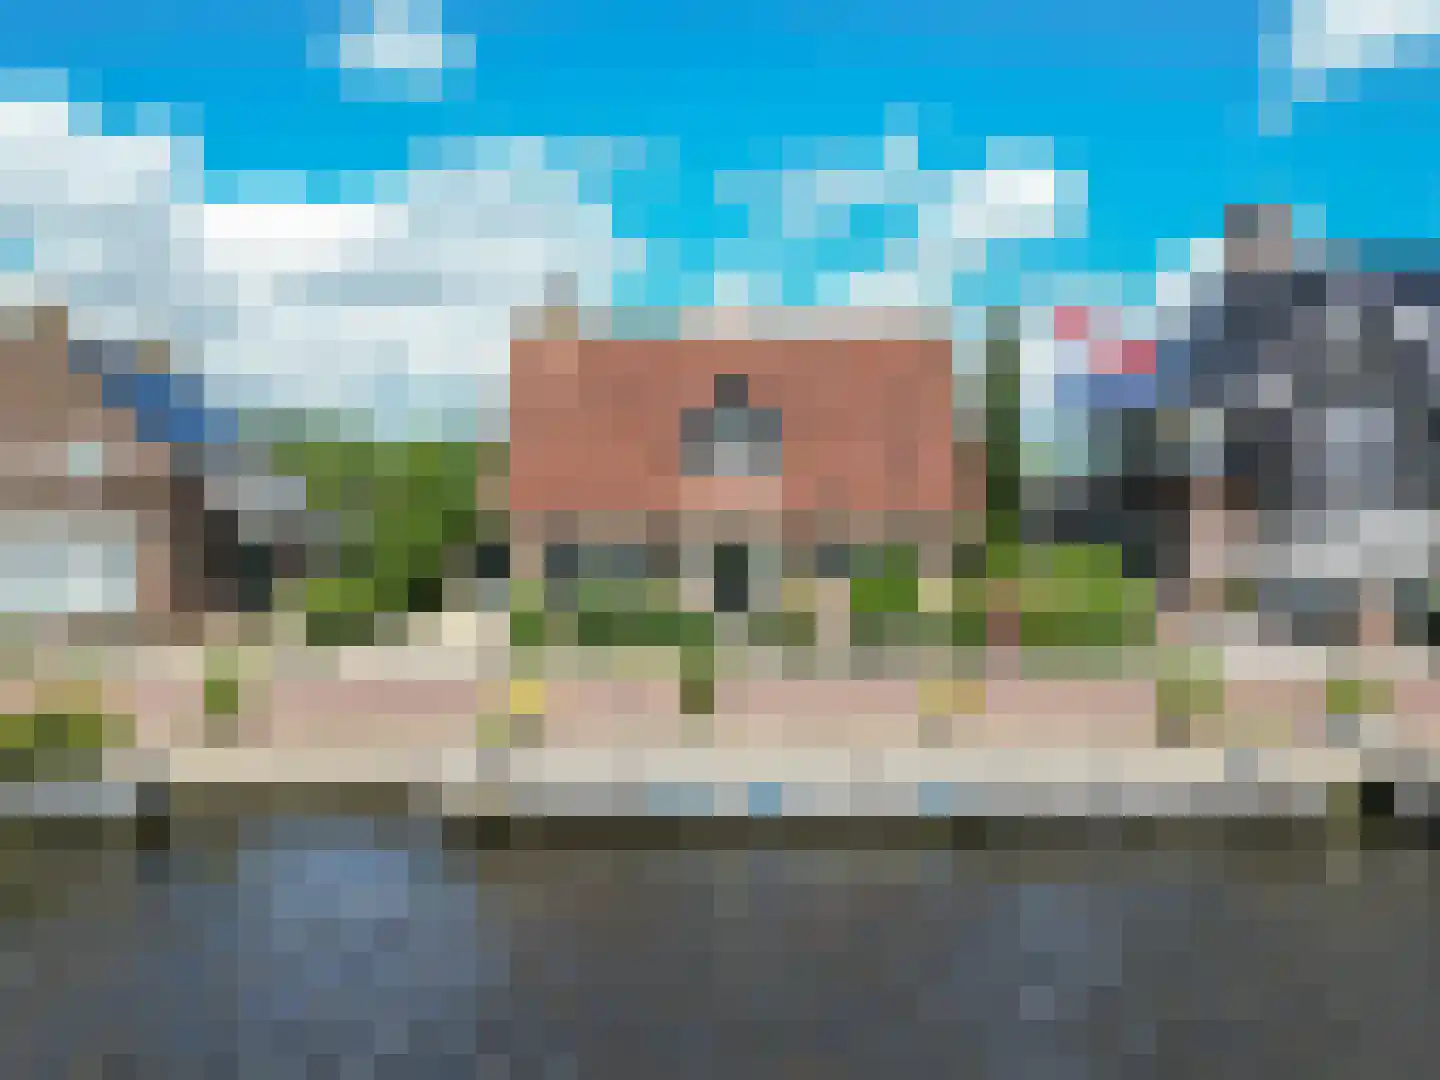
- Available
Huigsloterdijk 381
2158LR Buitenkaag
€ 1.095.000 k.k.
€ 6.887/m²
- Living area
- 159 m²
- Land area
- 755 m²
- Bedrooms
- 3
Searching in 10 houses in Buitenkaag
Type to search. Use arrow down and arrow up to navigate through results and press Enter to open.
Hidden search suggestions.
View current properties in Buitenkaag or search targeted on street, postal code and property characteristics.
View the current housing stock in Buitenkaag and quickly filter by price, living area, rooms and more. There are currently 10 houses in this place within our selection. View also 6 sold houses in Buitenkaag for extra insight into the local housing market.
2158LR Buitenkaag
€ 1.095.000 k.k.
€ 6.887/m²
2158LS Buitenkaag
€ 650.000 k.k.
€ 4.221/m²
2158MH Buitenkaag
€ 565.000 k.k.
€ 3.897/m²
2158LV Buitenkaag
€ 995.000 k.k.
€ 4.926/m²
2158LR Buitenkaag
€ 475.000 k.k.
€ 6.012/m²
2158ME Buitenkaag
€ 395.000 k.k.
€ 4.247/m²
2158LV Buitenkaag
€ 1.125.000 k.k.
€ 5.434/m²
2158ME Buitenkaag
€ 395.000 k.k.
€ 0/m²
2158MJ Buitenkaag
€ 575.000 k.k.
€ 4.423/m²
2158MJ Buitenkaag
€ 550.000 k.k.
€ 3.395/m²
Get free quotes from real estate agents with local market knowledge. Compare more than 125 real estate agents in Buitenkaag.
Selling a home in Buitenkaag? Compare all real estate agents in Buitenkaag or view the top 10 real estate agents in Buitenkaag for extra context for your choice.
Real estate agents make sharper offers when they know you're comparing — ask for quotes for sale or purchase.
Practical answers about housing supply, sales and comparing real estate agents in Buitenkaag.
The costs of a real estate agent in Buitenkaag depend on commission, setup costs, property presentation and the chosen service. Compare the 125 real estate agents in Buitenkaag via the real estate agent page and request multiple quotes to compare rates and approach well.
Within our selection, we are currently showing 10 houses in Buitenkaag. View also the sold houses in Buitenkaag to compare the current offering with recent transactions.
Take into account not only price and living area but also maintenance, energy label, location, outdoor space and sales status. This way you compare houses in Buitenkaag on more than just the asking price.
A local real estate agent knows the neighborhoods, recent transactions and demand in Buitenkaag. By comparing 125 real estate agents in the region you get a better insight into prices, sales strategy and expected yield; the top 10 in Buitenkaag provides a useful starting point.
Yes, when making a sales plan, a valuation in Buitenkaag is wise. You gain insight into a realistic asking price and can then compare offers from real estate agents specifically.
View current location data on residents, WOZ development, housing stock, energy consumption, business activity and safety in Buitenkaag. In 2025 were there 465 residents. The average WOZ value in 2025 is EUR 443.000.
These figures help to better assess and compare the housing stock in Buitenkaag with recent sold homes. Orient yourself then on suitable top real estate agents in Buitenkaag for sales advice in this region.
Residents
465
Last year: 2025
Average WOZ
EUR 443.000
Last year: 2025
Average income per person.
EUR 33.800
Source: AllNumbers
Crimes (current year)
11
Total registered
| Year | Residents |
|---|---|
| 2021 | 485 |
| 2022 | 485 |
| 2023 | 485 |
| 2024 | 480 |
| 2025 | 465 |
| Year | Average WOZ |
|---|---|
| 2021 | EUR 337.000 |
| 2022 | EUR 366.000 |
| 2023 | EUR 427.000 |
| 2024 | EUR 430.000 |
| 2025 | EUR 443.000 |
Hoger
60
Praktisch
100
Middelbaar
160
Europa
40
Nederland
390
Buiten Europa
30
Label C
57
Label D
49
Label A
35
Label G
27
Label F
25
Label B
15
Label E
6
Label A+
2
Label A++
1
Label A+++
0
Label A++++
0
Label A+++++
0
| Year | Gas (m3) | Electricity (kWh) |
|---|---|---|
| 2020 | 1.500 | 3.260 |
| 2021 | 1.710 | 3.440 |
| 2022 | 1.290 | 3.250 |
| 2023 | 1.120 | 3.010 |
| 2024 | 1.080 | 3.120 |
Hoekwoning
Gas: 1.190 • Electricity: 3.270
Huurwoning
Gas: 1.140 • Electricity: 2.400
Koopwoning
Gas: 1.120 • Electricity: 3.150
Appartement
Gas: 630 • Electricity: 1.960
Tussenwoning
Gas: 1.020 • Electricity: 2.630
Vrijstaande woning
Gas: 1.470 • Electricity: 3.390
Twee-onder-één-kap woning
Gas: 1.020 • Electricity: 3.280
Total number of company establishments: 80
| Period | Crimes |
|---|---|
| jan 2025 | 3 |
| jan 2026 | 0 |
| jul 2025 | 1 |
| jun 2025 | 1 |
| mei 2025 | 1 |
| mrt 2025 | 0 |
| nov 2024 | 2 |
| nov 2025 | 1 |
| okt 2024 | 1 |
| okt 2025 | 1 |
| sep 2024 | 3 |
| sep 2025 | 1 |
These figures give an indicative picture of safety trends in the living environment of Buitenkaag.
Short answers based on current local statistics, handy for a quick comparison of the living environment.
Buitenkaag telt in 2025 ongeveer 465 inwoners.
De gemiddelde WOZ-waarde in Buitenkaag is in 2025 circa € 443.000.
Het gemiddelde inkomen per inwoner in Buitenkaag ligt rond € 33.800 per jaar.
Voor het huidige jaar gaat het om ongeveer 11 geregistreerde misdrijven. Gebruik deze cijfers als indicatie en vergelijk trends per periode.
In Buitenkaag komt vooral "Vrijstaande woningen" veel voor, met ongeveer 66 woningen.