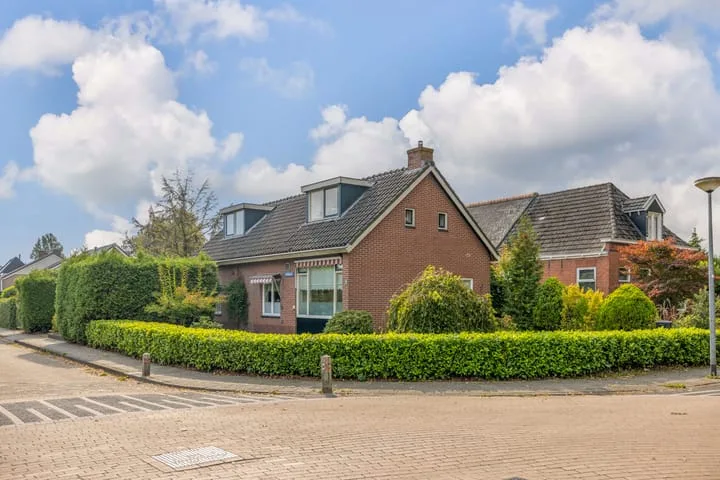
- Sold
Plantsoen 47
9367PH De Wilp
€ 299.000 k.k.
€ 2.693/m²
- Living area
- 111 m²
- Land area
- 630 m²
- Bedrooms
- 2
View 14 sold houses in De Wilp
Type to search. Use arrow down and arrow up to navigate through results and press Enter to open.
Hidden search suggestions.
Compare sold homes in De Wilp or view the current offering in this location directly.
On this page you will find recently sold homes in De Wilp. Use this overview to better estimate selling prices, popular neighborhoods, and the local housing supply before you choose a real estate agent. Also view the current housing supply with 22 houses in De Wilp.
9367PH De Wilp
€ 299.000 k.k.
€ 2.693/m²
9367RA De Wilp
€ 485.000 k.k.
€ 3.233/m²
9367PZ De Wilp
€ 375.000 k.k.
€ 3.504/m²
9367RA De Wilp
€ 439.000 k.k.
€ 3.658/m²
9367PN De Wilp
€ 550.000 k.k.
€ 3.235/m²
9367PE De Wilp
€ 559.000 k.k.
€ 3.881/m²
9367RJ De Wilp
€ 335.000 k.k.
€ 3.489/m²
9367PL De Wilp
€ 325.000 k.k.
€ 3.009/m²
9367RT De Wilp
€ 695.000 k.k.
€ 3.657/m²
9367RT De Wilp
€ 629.000 k.k.
€ 3.364/m²
9367RA De Wilp
€ 420.000 k.k.
€ 3.000/m²
9367TP De Wilp
€ 575.000 k.k.
€ 3.142/m²
9367RT De Wilp
€ 585.000 k.k.
€ 4.006/m²
9367PB De Wilp
€ 349.000 k.k.
€ 0/m²
View recent sales and receive free quotes from local real estate agents. Compare more than 18 real estate agents in De Wilp.
Selling your own home in De Wilp? Compare real estate agents in De Wilp or view the best real estate agents in De Wilp as a reference for your choice.
Real estate agents make sharper offers when they know you're comparing — ask for quotes for sale or purchase.
Short answers about housing prices, sold homes and comparing real estate agents in De Wilp.
The costs of a real estate agent in De Wilp vary per office, property type and sales approach. In De Wilp you can compare 18 real estate agents; therefore also look at the real estate agents in De Wilp to better compare fees, presentation and local experience.
On this page we currently show 14 sold houses in De Wilp from our selection. This helps you to better assess recent transactions and the local housing market.
Houses sold in De Wilp give insight into asking prices, house types and neighborhoods where recent transactions have taken place. Compare this also with the current housing stock in De Wilp to better understand the market.
You can use sold homes as a first market indication, but a local real estate agent can better take into account finishing, location, maintenance and current demand in De Wilp.
Compare the 18 real estate agents in De Wilp on local sales experience, reviews, expected yield, commission and marketing approach. View real estate agents in De Wilp or the top 10 agents in De Wilp to quickly discover strong offices.
View current location data on residents, WOZ development, housing stock, energy consumption, business activity and safety in De Wilp. In 2025 were there 1.660 residents. The average WOZ value in 2025 is EUR 332.619.
These figures help to better assess and compare the housing stock in De Wilp with recent sold homes. Orient yourself then on suitable top real estate agents in De Wilp for sales advice in this region.
Residents
1.660
Last year: 2025
Average WOZ
EUR 332.619
Last year: 2025
Average income per person.
EUR 26.343
Source: AllNumbers
Crimes (current year)
25
Total registered
| Year | Residents |
|---|---|
| 2021 | 1.620 |
| 2022 | 1.665 |
| 2023 | 1.685 |
| 2024 | 1.665 |
| 2025 | 1.660 |
| Year | Average WOZ |
|---|---|
| 2021 | EUR 241.291 |
| 2022 | EUR 270.237 |
| 2023 | EUR 316.938 |
| 2024 | EUR 314.765 |
| 2025 | EUR 332.619 |
Hoger
240
Praktisch
320
Middelbaar
580
Europa
45
Nederland
1.540
Buiten Europa
55
Label C
170
Label G
118
Label A
115
Label B
95
Label D
92
Label F
57
Label A+++
38
Label E
22
Label A++
13
Label A+
9
Label A++++
2
Label A+++++
0
| Year | Gas (m3) | Electricity (kWh) |
|---|---|---|
| 2020 | 1.629 | 3.100 |
| 2021 | 1.835 | 3.160 |
| 2022 | 1.413 | 3.017 |
| 2023 | 1.153 | 2.883 |
| 2024 | 1.059 | 3.041 |
Hoekwoning
Gas: 926 • Electricity: 1.894
Huurwoning
Gas: 981 • Electricity: 1.990
Koopwoning
Gas: 1.198 • Electricity: 3.160
Appartement
Gas: 634 • Electricity: 985
Tussenwoning
Gas: 676 • Electricity: 1.510
Vrijstaande woning
Gas: 1.261 • Electricity: 3.219
Twee-onder-één-kap woning
Gas: 793 • Electricity: 2.278
Total number of company establishments: 205
| Period | Crimes |
|---|---|
| jan 2025 | 5 |
| jan 2026 | 0 |
| jul 2025 | 4 |
| jun 2025 | 0 |
| mei 2025 | 1 |
| mrt 2025 | 2 |
| nov 2024 | 3 |
| nov 2025 | 1 |
| okt 2024 | 5 |
| okt 2025 | 1 |
| sep 2024 | 4 |
| sep 2025 | 4 |
These figures give an indicative picture of safety trends in the living environment of De Wilp.
Short answers based on current local statistics, handy for a quick comparison of the living environment.
De Wilp telt in 2025 ongeveer 1.660 inwoners.
De gemiddelde WOZ-waarde in De Wilp is in 2025 circa € 332.619.
Het gemiddelde inkomen per inwoner in De Wilp ligt rond € 26.343 per jaar.
Voor het huidige jaar gaat het om ongeveer 25 geregistreerde misdrijven. Gebruik deze cijfers als indicatie en vergelijk trends per periode.
In De Wilp komt vooral "Vrijstaande woningen" veel voor, met ongeveer 454 woningen.