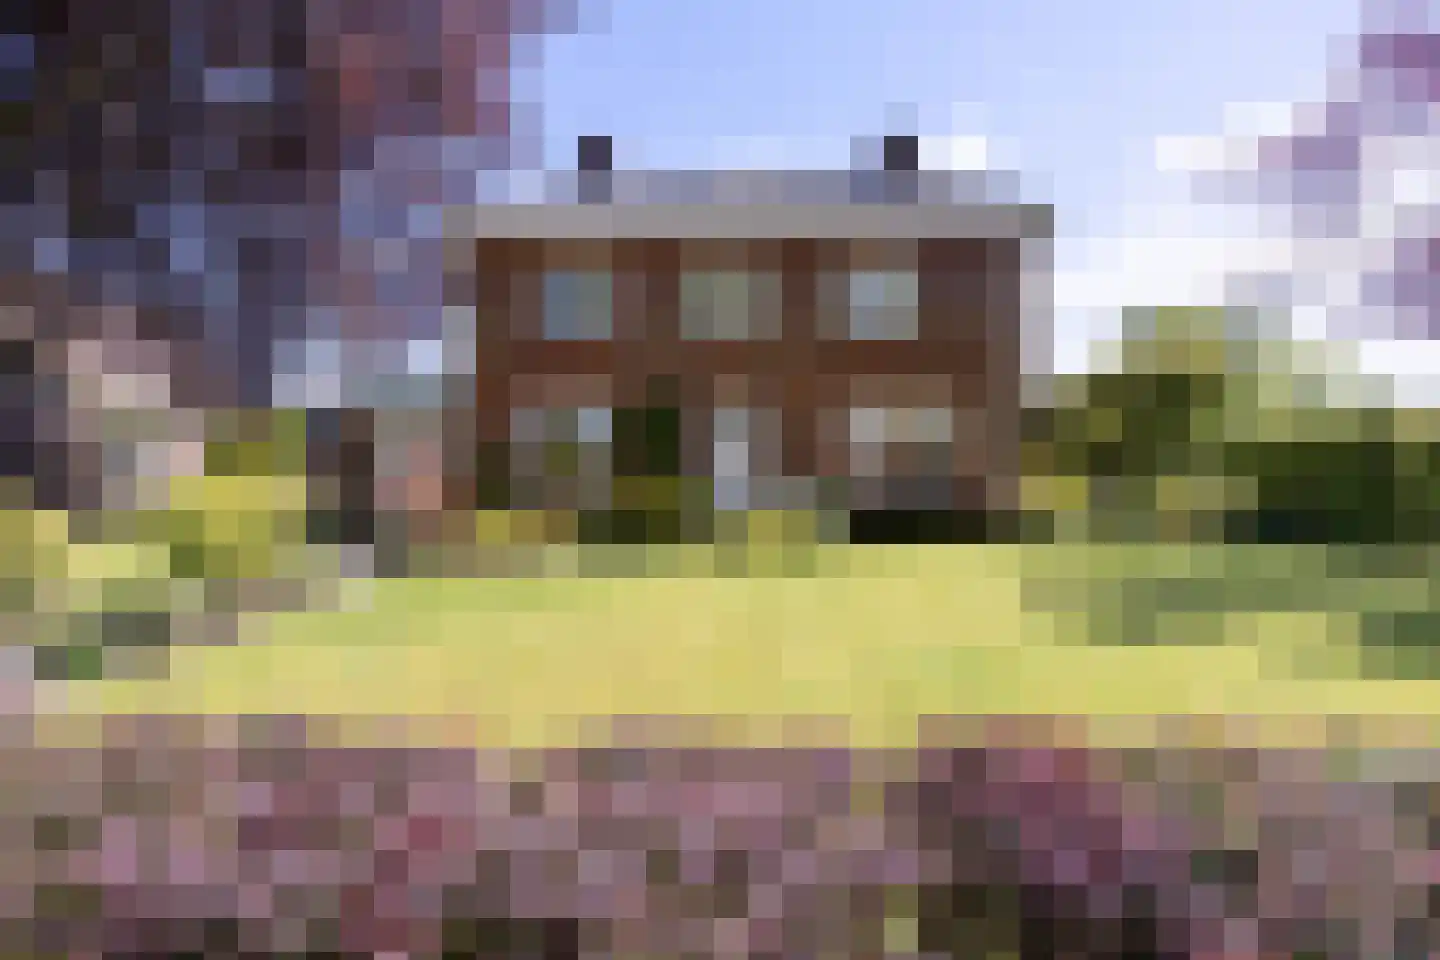
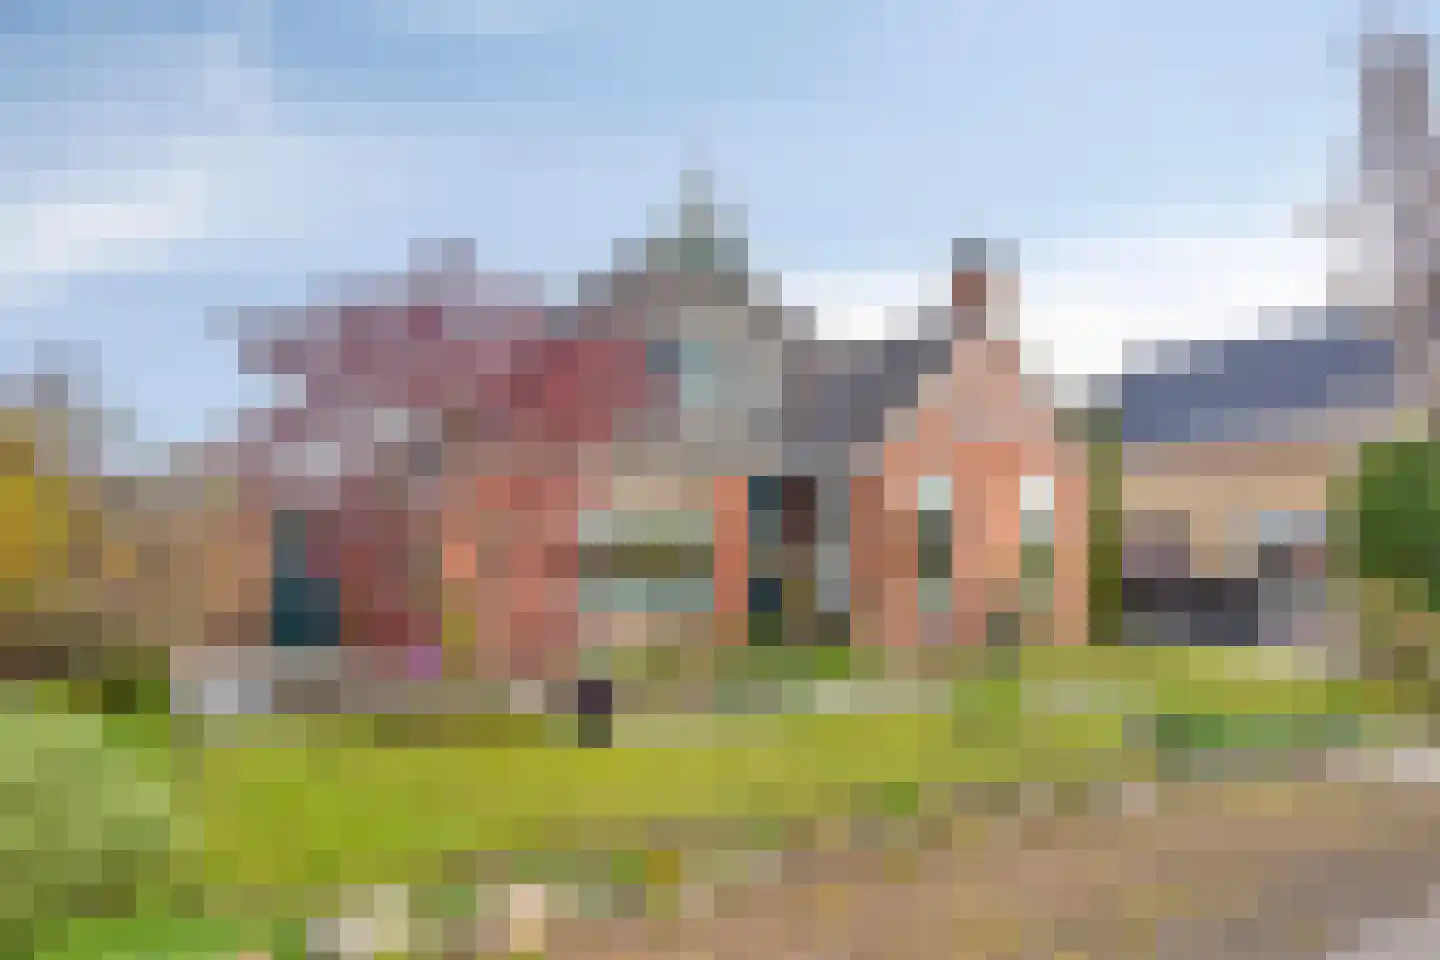
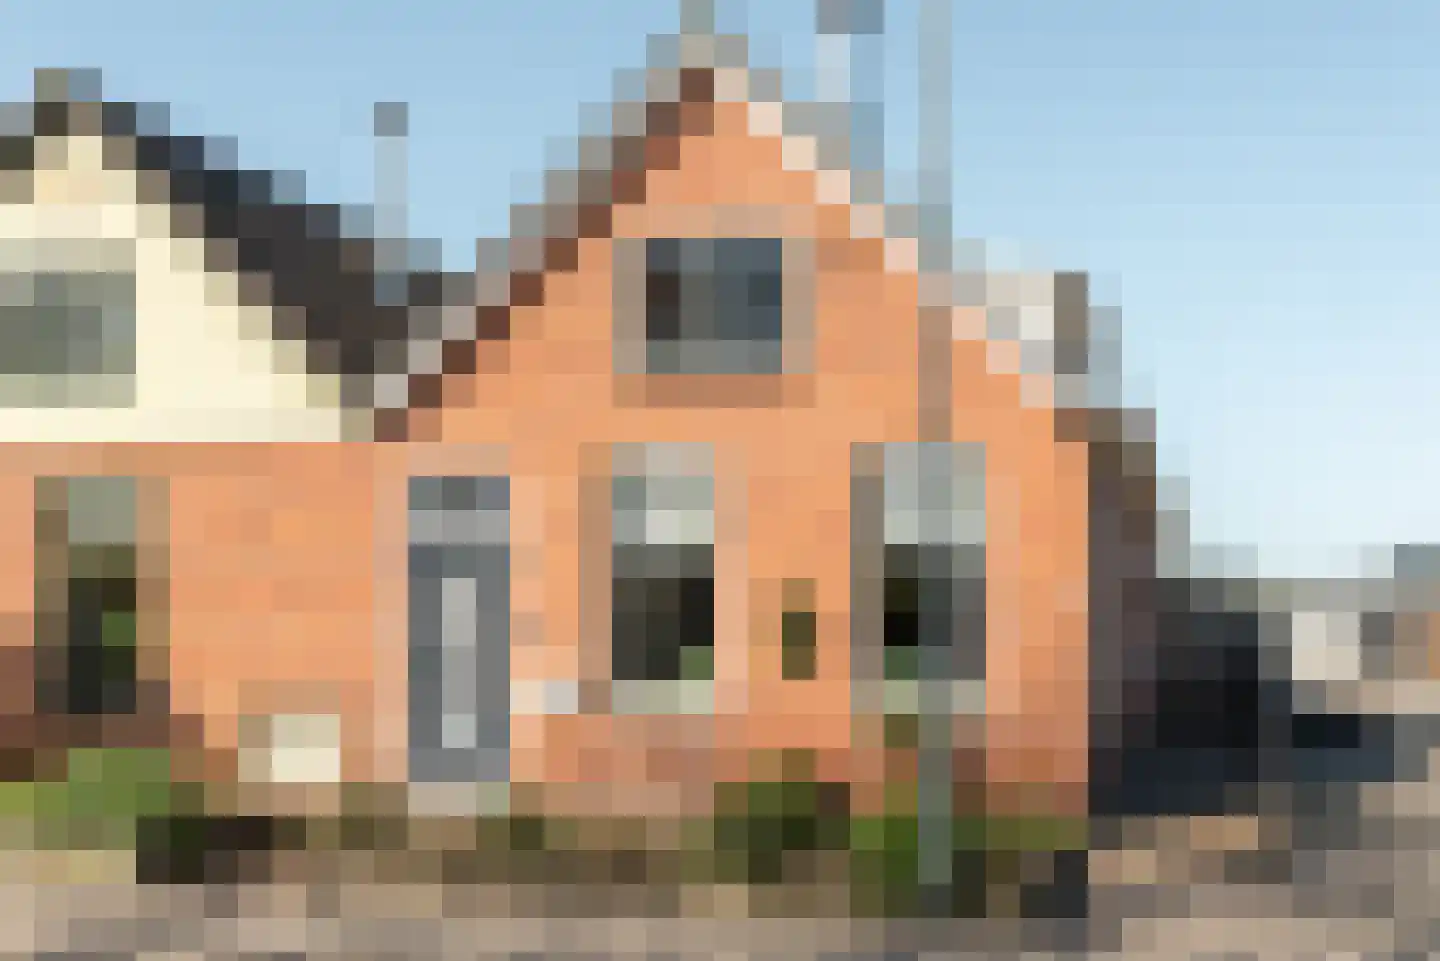
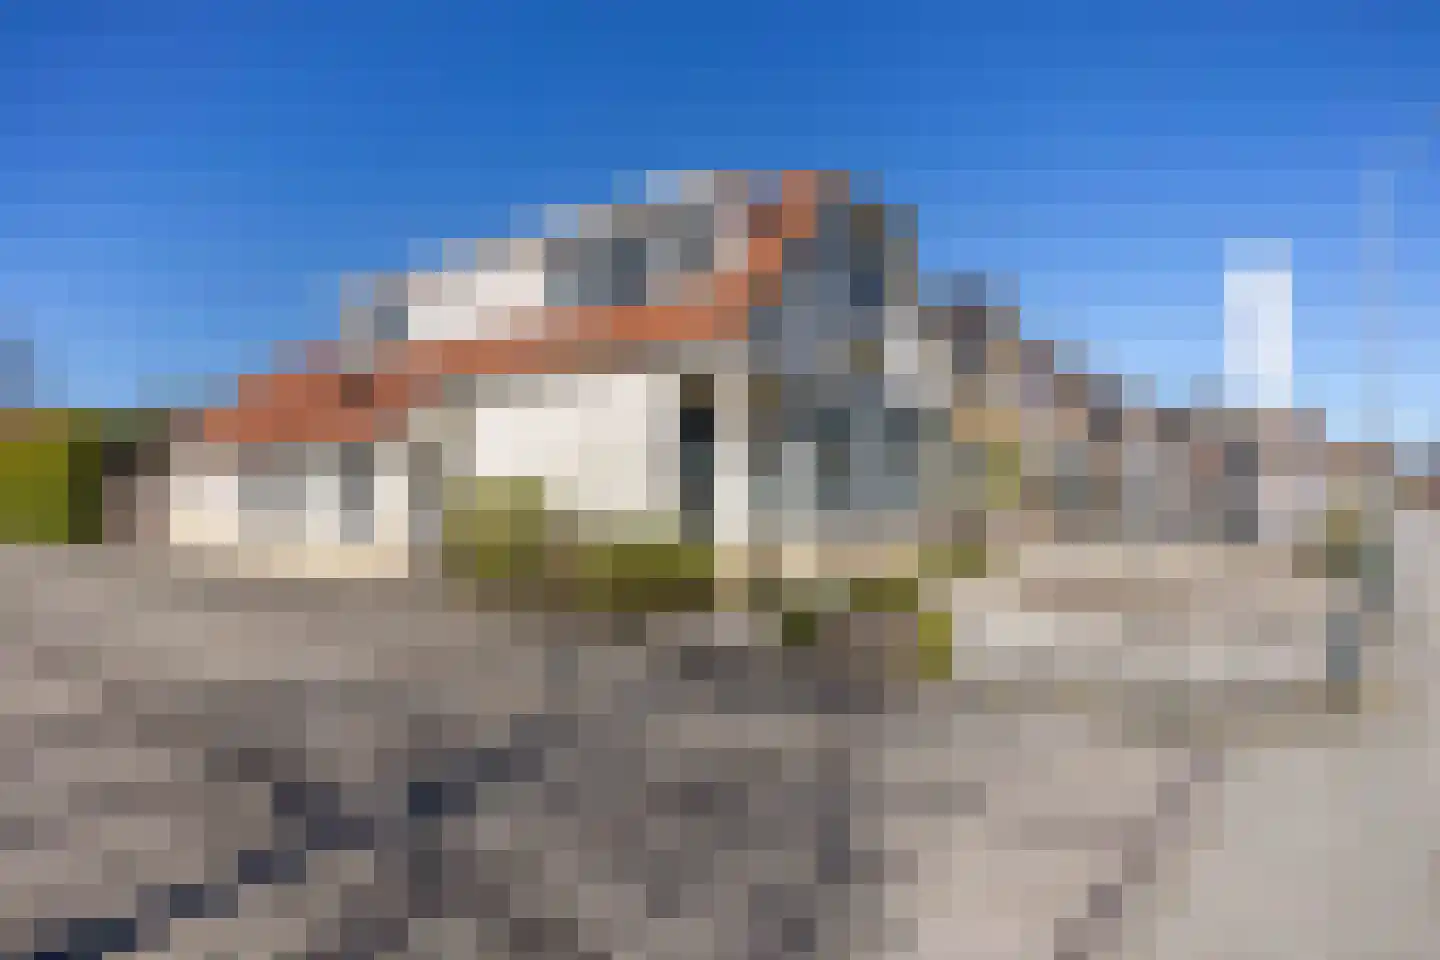
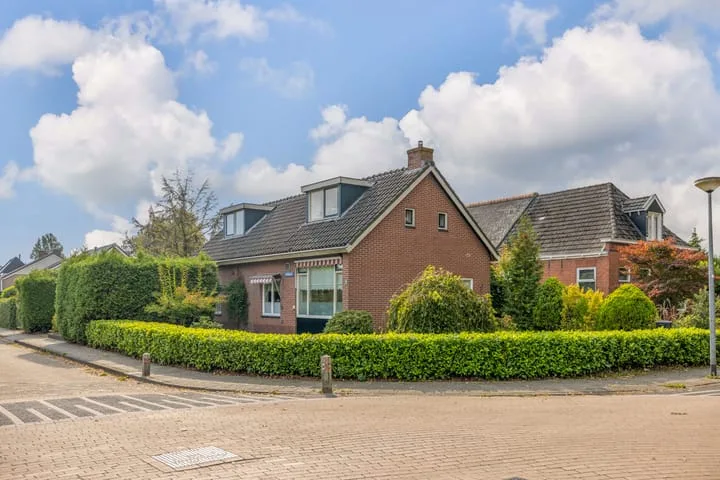
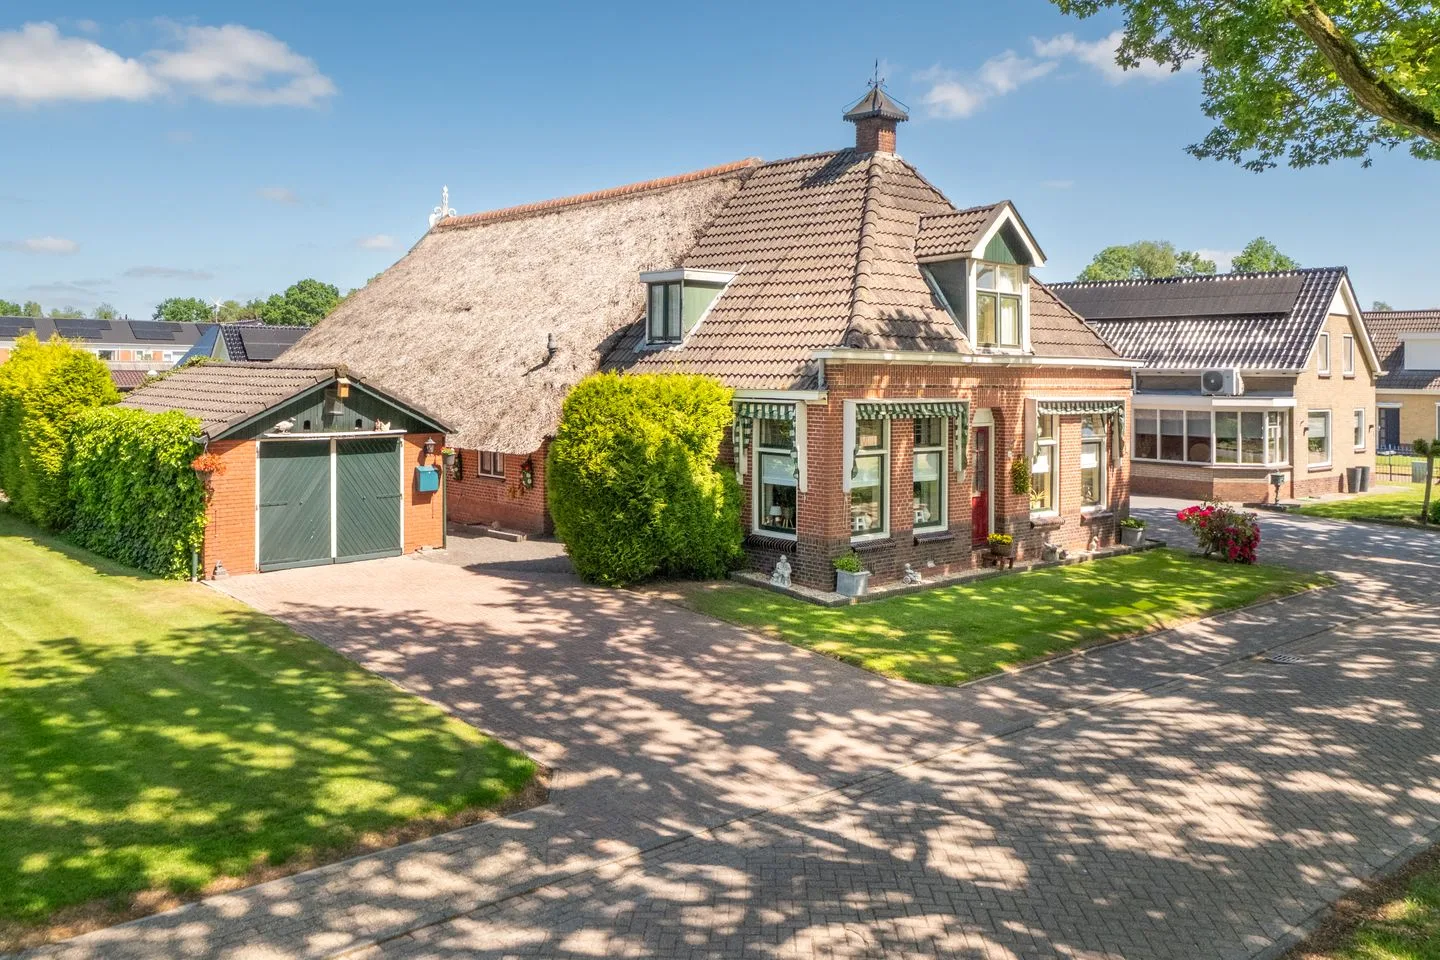
Housing offer in De Wilp

Searching in 22 houses in De Wilp

Connected to: Vastgoed Nederland NVM Makelaars

View the current housing stock in De Wilp and quickly filter by price, living area, rooms and more. There are currently 22 houses in this place within our selection. View also 14 sold houses in De Wilp for extra insight into the local housing market.

Selection

Search and filter homes

Set your preferences and discover homes that suit you.

Total supply 243.313
Filters

Set price, area and other characteristics. Adjust a filter or click on Show homes. Location changes directly above.

Reset filters

You search for

  • Place De Wilp

Selling a home in De Wilp? Compare realtor offers

Get free quotes from real estate agents with local market knowledge. Compare more than 18 real estate agents in De Wilp.

Free request a quote

  • Quotes in De Wilp
  • Non-binding
  • Personal
  • Compare free rates

Selling a home in De Wilp? Compare all real estate agents in De Wilp or view the top 10 real estate agents in De Wilp for extra context for your choice.

Compare multiple quotes

Real estate agents make sharper offers when they know you're comparing — ask for quotes for sale or purchase.

Frequently asked questions about homes in De Wilp

Practical answers about housing supply, sales and comparing real estate agents in De Wilp.

Residential and neighborhood statistics in De Wilp

View current location data on residents, WOZ development, housing stock, energy consumption, business activity and safety in De Wilp. In 2025 were there 1.660 residents. The average WOZ value in 2025 is EUR 332.619.

These figures help to better assess and compare the housing stock in De Wilp with recent sold homes. Orient yourself then on suitable top real estate agents in De Wilp for sales advice in this region.

Residents

1.660

Last year: 2025

Average WOZ

EUR 332.619

Last year: 2025

Average income per person.

EUR 26.343

Source: AllNumbers

Crimes (current year)

25

Total registered

Demographics and WOZ development

Inhabitants per year

Inhabitants per year in De Wilp
Year Residents
2021 1.620
2022 1.665
2023 1.685
2024 1.665
2025 1.660

Annual WOZ value

WOZ value per year in De Wilp
Year Average WOZ
2021 EUR 241.291
2022 EUR 270.237
2023 EUR 316.938
2024 EUR 314.765
2025 EUR 332.619

Composition of residents

Age build-up

65+: 375 0-15: 260 15-25: 165 25-45: 410 45-65: 445

Education level

Hoger

240

Praktisch

320

Middelbaar

580

Origin of residents (2025)

Europa

45

Nederland

1.540

Buiten Europa

55

Housing stock and construction periods

Types of homes

Hoekwoningen 76
Appartementen 20
Tussenwoningen 92
Vrijstaande woningen 454
Twee-onder-één-kap woningen 88

Construction period of buildings

Voor 1700 0
1700 tot 1900 21
1900 tot 1925 83
1925 tot 1950 94
1950 tot 1970 178
1970 tot 1980 164
1980 tot 1990 52
1990 tot 2000 45
2000 tot 2010 94
2010 tot 2020 15
2020 en later 11

Energy and sustainability

Energy label distribution

Label C

170

Label G

118

Label A

115

Label B

95

Label D

92

Label F

57

Label A+++

38

Label E

22

Label A++

13

Label A+

9

Label A++++

2

Label A+++++

0

Average energy consumption per year

Average energy consumption per year in De Wilp
Year Gas (m3) Electricity (kWh)
2020 1.629 3.100
2021 1.835 3.160
2022 1.413 3.017
2023 1.153 2.883
2024 1.059 3.041

Consumption per house type

Hoekwoning

Gas: 926 • Electricity: 1.894

Huurwoning

Gas: 981 • Electricity: 1.990

Koopwoning

Gas: 1.198 • Electricity: 3.160

Appartement

Gas: 634 • Electricity: 985

Tussenwoning

Gas: 676 • Electricity: 1.510

Vrijstaande woning

Gas: 1.261 • Electricity: 3.219

Twee-onder-één-kap woning

Gas: 793 • Electricity: 2.278

Business activity in De Wilp (2025)

Handel en HORECA 35
Nijverheid en energie 50
Zakelijke dienstverlening 35
Overheid, onderwijs en zorg 25
Landbouw, bosbouw en visserij 20
Vervoer, informatie en communicatie 10
Financiele diensten en onroerendgoed 0
Cultuur, recreatie en overige diensten 20

Total number of company establishments: 205

Recent crime statistics

Recent crime statistics in De Wilp
Period Crimes
jan 2025 5
jan 2026 0
jul 2025 4
jun 2025 0
mei 2025 1
mrt 2025 2
nov 2024 3
nov 2025 1
okt 2024 5
okt 2025 1
sep 2024 4
sep 2025 4

These figures give an indicative picture of safety trends in the living environment of De Wilp.

Frequently asked questions about living in De Wilp

Short answers based on current local statistics, handy for a quick comparison of the living environment.

Hoeveel inwoners heeft De Wilp?

De Wilp telt in 2025 ongeveer 1.660 inwoners.

Wat is de gemiddelde WOZ-waarde in De Wilp?

De gemiddelde WOZ-waarde in De Wilp is in 2025 circa € 332.619.

Wat is het gemiddelde inkomen per inwoner in De Wilp?

Het gemiddelde inkomen per inwoner in De Wilp ligt rond € 26.343 per jaar.

Hoe veilig is wonen in De Wilp?

Voor het huidige jaar gaat het om ongeveer 25 geregistreerde misdrijven. Gebruik deze cijfers als indicatie en vergelijk trends per periode.

Welke woningtypen komen het meest voor in De Wilp?

In De Wilp komt vooral "Vrijstaande woningen" veel voor, met ongeveer 454 woningen.

Receive free, non-binding quotes

Compare multiple real estate agents and choose the best match.