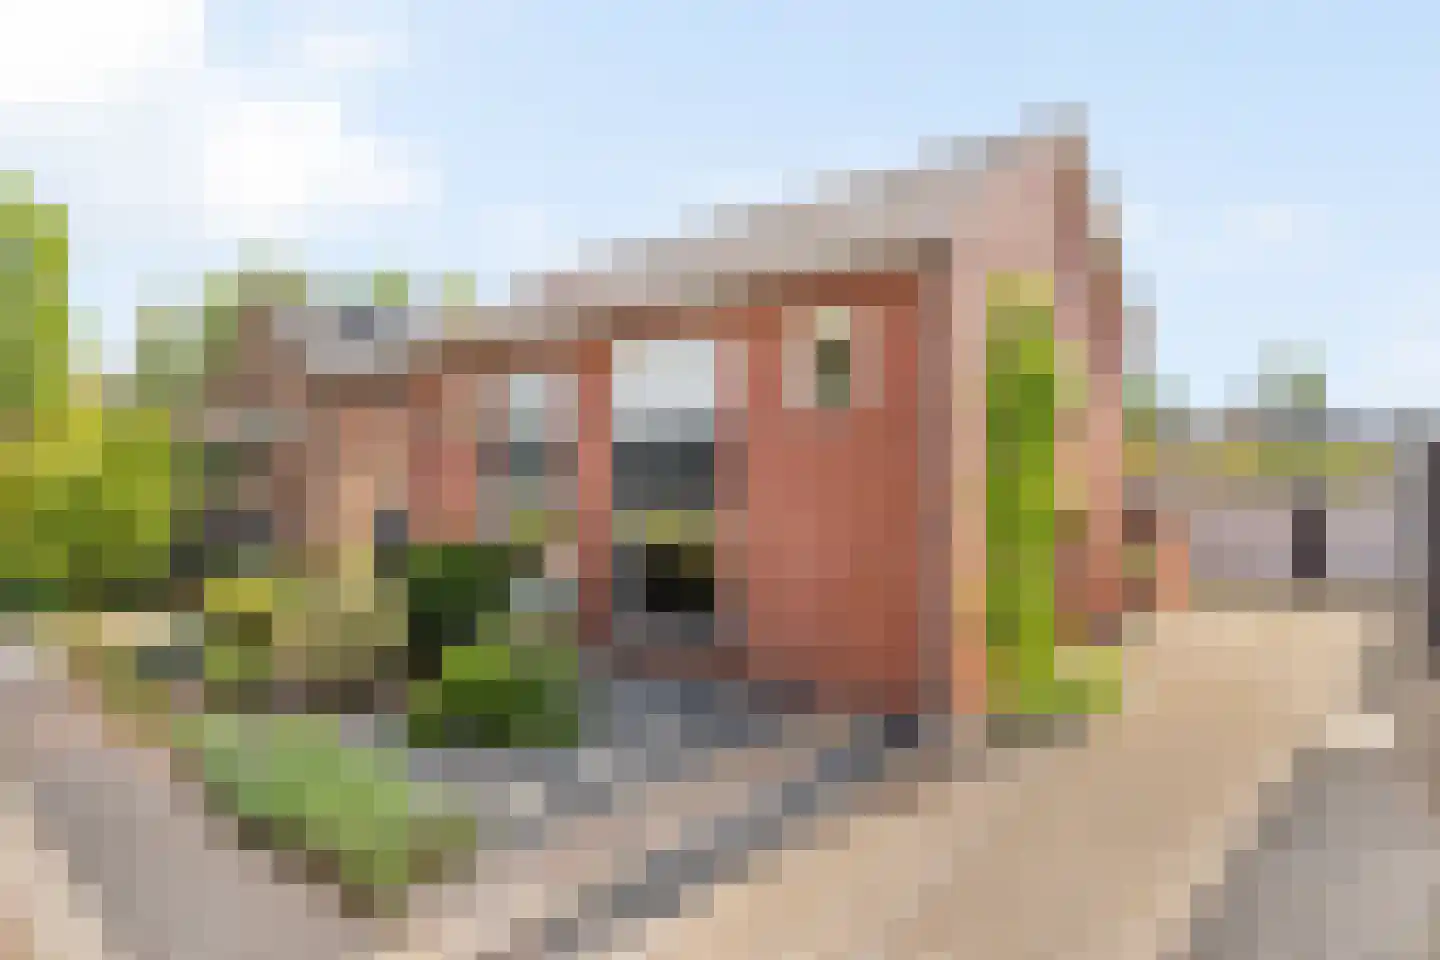
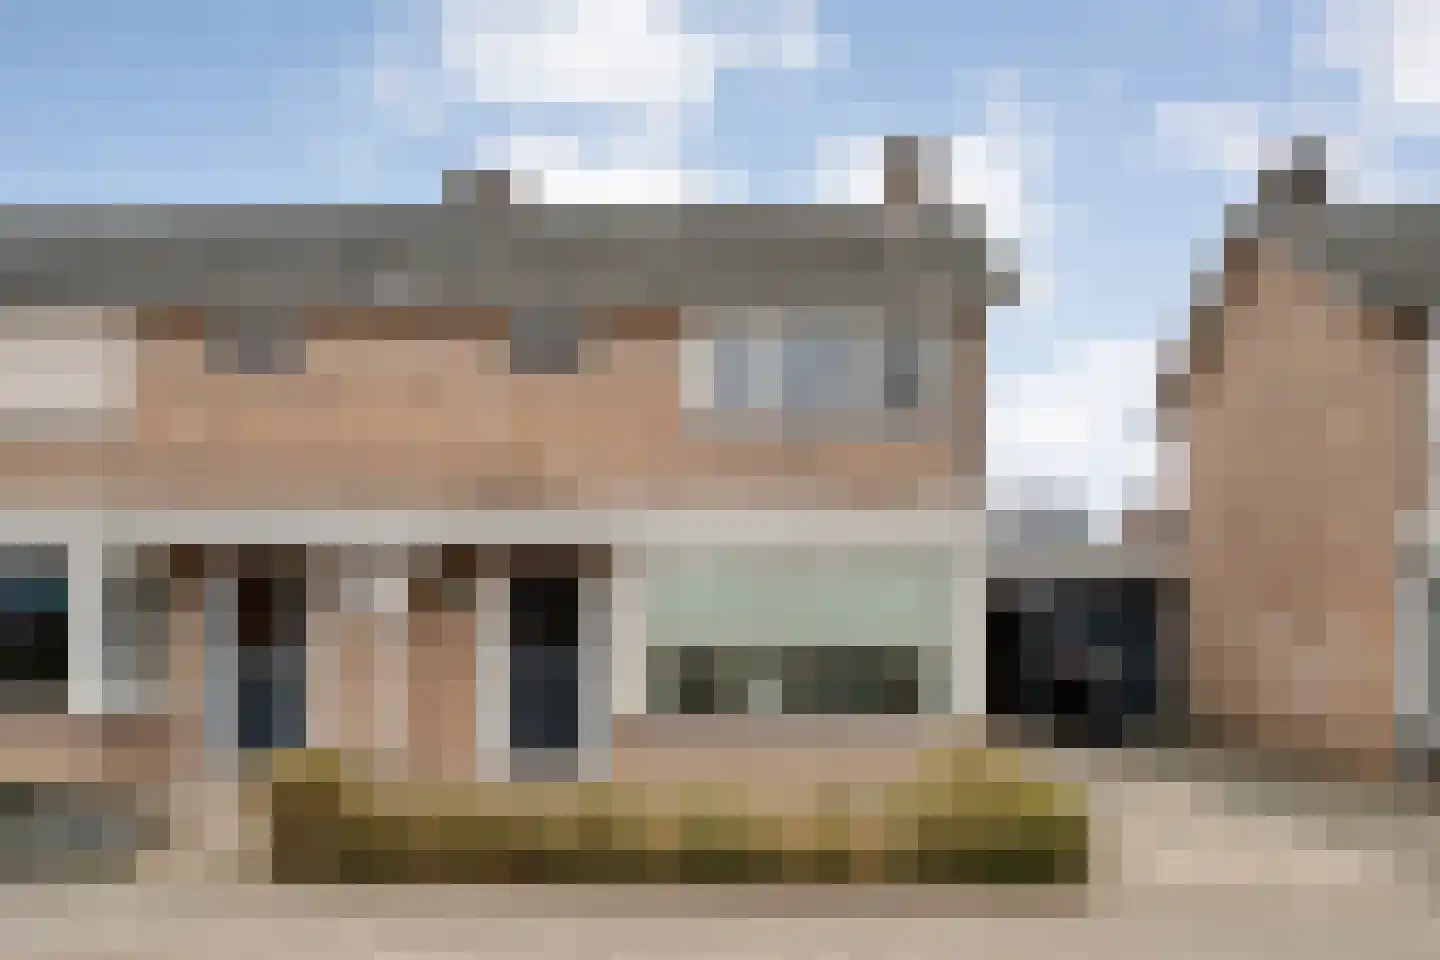
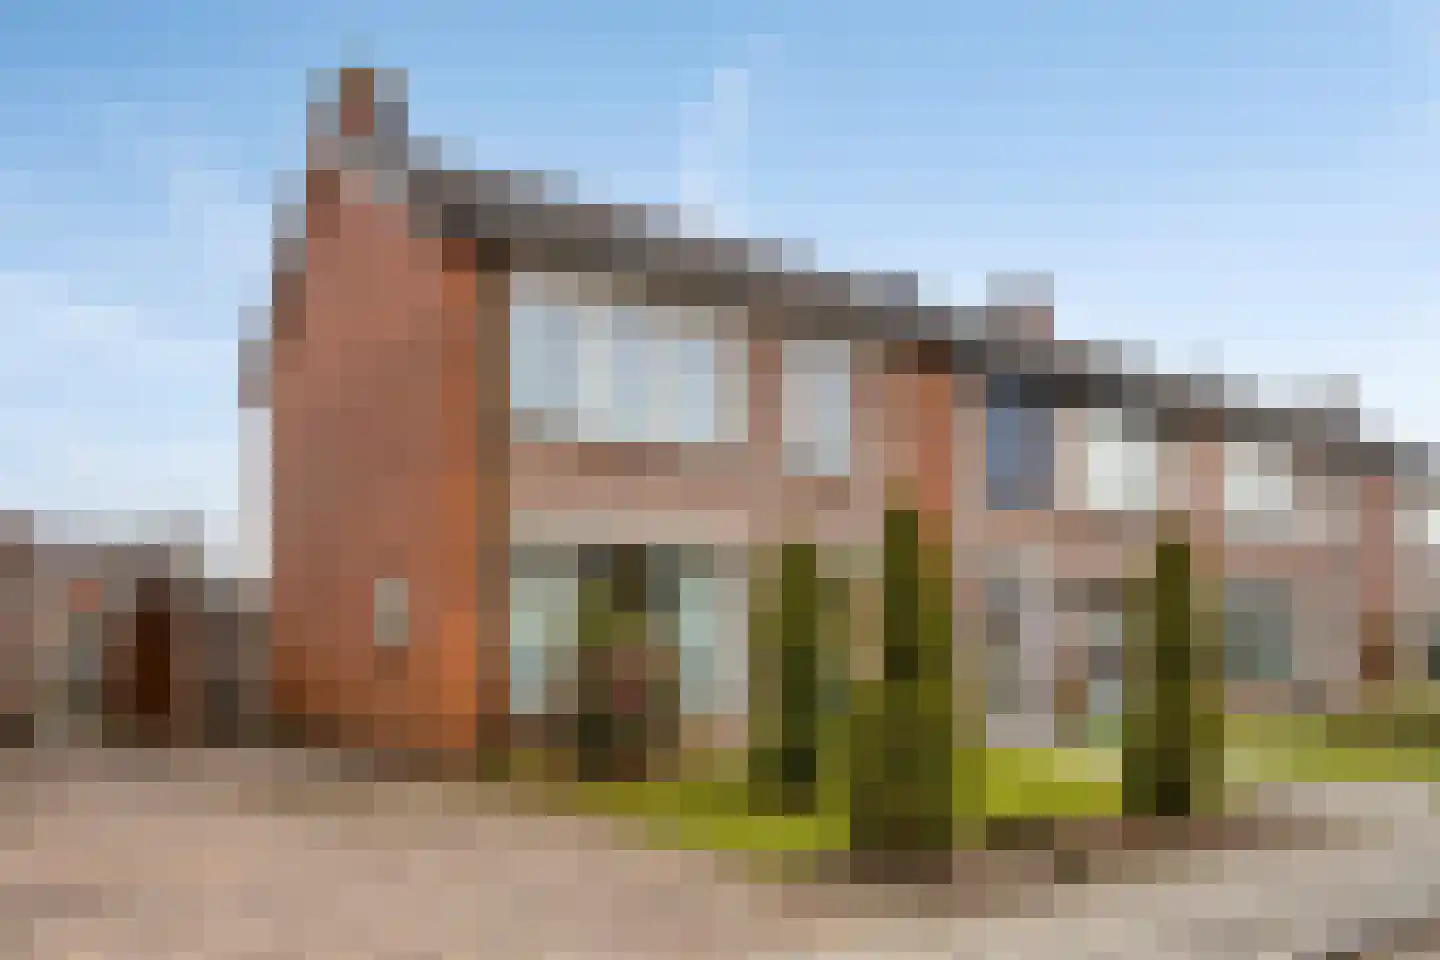
- Available
Het Elferman 41
7591WC Denekamp
€ 359.000 k.k.
€ 3.294/m²
- Living area
- 109 m²
- Land area
- 138 m²
- Bedrooms
- 4
Searching in 105 houses in Denekamp
Type to search. Use arrow down and arrow up to navigate through results and press Enter to open.
Hidden search suggestions.
View current properties in Denekamp or search targeted on street, postal code and property characteristics.
View the current housing stock in Denekamp and quickly filter by price, living area, rooms and more. There are currently 105 houses in this place within our selection. View also 84 sold houses in Denekamp for extra insight into the local housing market.
7591WC Denekamp
€ 359.000 k.k.
€ 3.294/m²
7591VN Denekamp
€ 398.000 k.k.
€ 4.682/m²
7591NR Denekamp
€ 189.000 k.k.
7591DP Denekamp
€ 392.000 k.k.
€ 2.631/m²
7591GS Denekamp
€ 498.000 k.k.
€ 2.692/m²
7591NG Denekamp
€ 990.000 k.k.
€ 3.000/m²
7591XK Denekamp
€ 395.000 k.k.
€ 3.624/m²
7591EP Denekamp
€ 419.000 k.k.
7591JB Denekamp
€ 335.000 k.k.
€ 3.045/m²
7591TH Denekamp
€ 383.000 k.k.
€ 4.032/m²
7591GX Denekamp
€ 420.000 k.k.
€ 3.750/m²
7591JK Denekamp
€ 649.000 k.k.
€ 3.245/m²
7591NN Denekamp
€ 879.000 k.k.
€ 2.608/m²
7591ET Denekamp
€ 469.000 k.k.
€ 2.495/m²
7591CA Denekamp
€ 325.000 k.k.
€ 3.693/m²
7591GZ Denekamp
€ 735.000 k.k.
€ 4.565/m²
7591TT Denekamp
€ 374.000 k.k.
€ 2.968/m²
7591PB Denekamp
€ 1.850.000 k.k.
€ 5.556/m²
7591AC Denekamp
€ 693.000 k.k.
€ 2.159/m²
7591CE Denekamp
€ 385.000 k.k.
€ 3.775/m²
7591NG Denekamp
€ 262.500 k.k.
€ 1.450/m²
7591XX Denekamp
€ 297.000 k.k.
€ 2.652/m²
7591VL Denekamp
€ 348.000 k.k.
€ 3.910/m²
7591LV Denekamp
€ 397.000 k.k.
€ 4.051/m²
7591JE Denekamp
€ 459.000 k.k.
€ 2.833/m²
7591AH Denekamp
€ 375.000 k.k.
€ 2.451/m²
7591BT Denekamp
€ 285.000 k.k.
€ 2.436/m²
7591AH Denekamp
€ 295.000 k.k.
€ 3.315/m²
Get free quotes from real estate agents with local market knowledge. Compare more than 15 real estate agents in Denekamp.
Selling a home in Denekamp? Compare all real estate agents in Denekamp or view the top 10 real estate agents in Denekamp for extra context for your choice.
Real estate agents make sharper offers when they know you're comparing — ask for quotes for sale or purchase.
Practical answers about housing supply, sales and comparing real estate agents in Denekamp.
The costs of a real estate agent in Denekamp depend on commission, setup costs, property presentation and the chosen service. Compare the 15 real estate agents in Denekamp via the real estate agent page and request multiple quotes to compare rates and approach well.
Within our selection, we are currently showing 105 houses in Denekamp. View also the sold houses in Denekamp to compare the current offering with recent transactions.
Take into account not only price and living area but also maintenance, energy label, location, outdoor space and sales status. This way you compare houses in Denekamp on more than just the asking price.
A local real estate agent knows the neighborhoods, recent transactions and demand in Denekamp. By comparing 15 real estate agents in the region you get a better insight into prices, sales strategy and expected yield; the top 10 in Denekamp provides a useful starting point.
Yes, when making a sales plan, a valuation in Denekamp is wise. You gain insight into a realistic asking price and can then compare offers from real estate agents specifically.
View current location data on residents, WOZ development, housing stock, energy consumption, business activity and safety in Denekamp. In 2026 were there 10.317 residents. The average WOZ value in 2025 is EUR 377.323.
These figures help to better assess and compare the housing stock in Denekamp with recent sold homes. Orient yourself then on suitable top real estate agents in Denekamp for sales advice in this region.
Residents
10.317
Last year: 2026
Average WOZ
EUR 377.323
Last year: 2025
Average income per person.
EUR 28.424
Source: AllNumbers
Crimes (current year)
178
Total registered
| Year | Residents |
|---|---|
| 2021 | 10.190 |
| 2022 | 10.150 |
| 2023 | 10.280 |
| 2024 | 10.250 |
| 2025 | 10.225 |
| 2026 | 10.317 |
| Year | Average WOZ |
|---|---|
| 2021 | EUR 269.838 |
| 2022 | EUR 293.313 |
| 2023 | EUR 332.347 |
| 2024 | EUR 361.603 |
| 2025 | EUR 377.323 |
Hoger
2.100
Praktisch
1.780
Middelbaar
3.650
Europa
990
Nederland
8.685
Buiten Europa
555
Label C
1.237
Label A
1.172
Label B
785
Label D
526
Label F
350
Label G
255
Label E
199
Label A+++
50
Label A+
45
Label A++
23
Label A++++
7
Label A+++++
1
| Year | Gas (m3) | Electricity (kWh) |
|---|---|---|
| 2020 | 1.388 | 3.194 |
| 2021 | 1.677 | 3.223 |
| 2022 | 1.343 | 3.014 |
| 2023 | 1.096 | 2.917 |
| 2024 | 1.060 | 3.022 |
Hoekwoning
Gas: 1.035 • Electricity: 2.740
Huurwoning
Gas: 812 • Electricity: 1.955
Koopwoning
Gas: 1.215 • Electricity: 3.321
Appartement
Gas: 631 • Electricity: 1.806
Tussenwoning
Gas: 941 • Electricity: 2.408
Vrijstaande woning
Gas: 1.432 • Electricity: 3.788
Twee-onder-één-kap woning
Gas: 1.087 • Electricity: 2.938
Total number of company establishments: 1.120
| Period | Crimes |
|---|---|
| jan 2026 | 13 |
| jul 2025 | 11 |
| jun 2025 | 16 |
| mei 2025 | 20 |
| mrt 2025 | 14 |
| mrt 2026 | 12 |
| nov 2024 | 14 |
| nov 2025 | 13 |
| okt 2024 | 19 |
| okt 2025 | 9 |
| sep 2024 | 19 |
| sep 2025 | 16 |
These figures give an indicative picture of safety trends in the living environment of Denekamp.
Short answers based on current local statistics, handy for a quick comparison of the living environment.
Denekamp telt in 2026 ongeveer 10.317 inwoners.
De gemiddelde WOZ-waarde in Denekamp is in 2025 circa € 377.323.
Het gemiddelde inkomen per inwoner in Denekamp ligt rond € 28.424 per jaar.
Voor het huidige jaar gaat het om ongeveer 178 geregistreerde misdrijven. Gebruik deze cijfers als indicatie en vergelijk trends per periode.
In Denekamp komt vooral "Vrijstaande woningen" veel voor, met ongeveer 1.448 woningen.