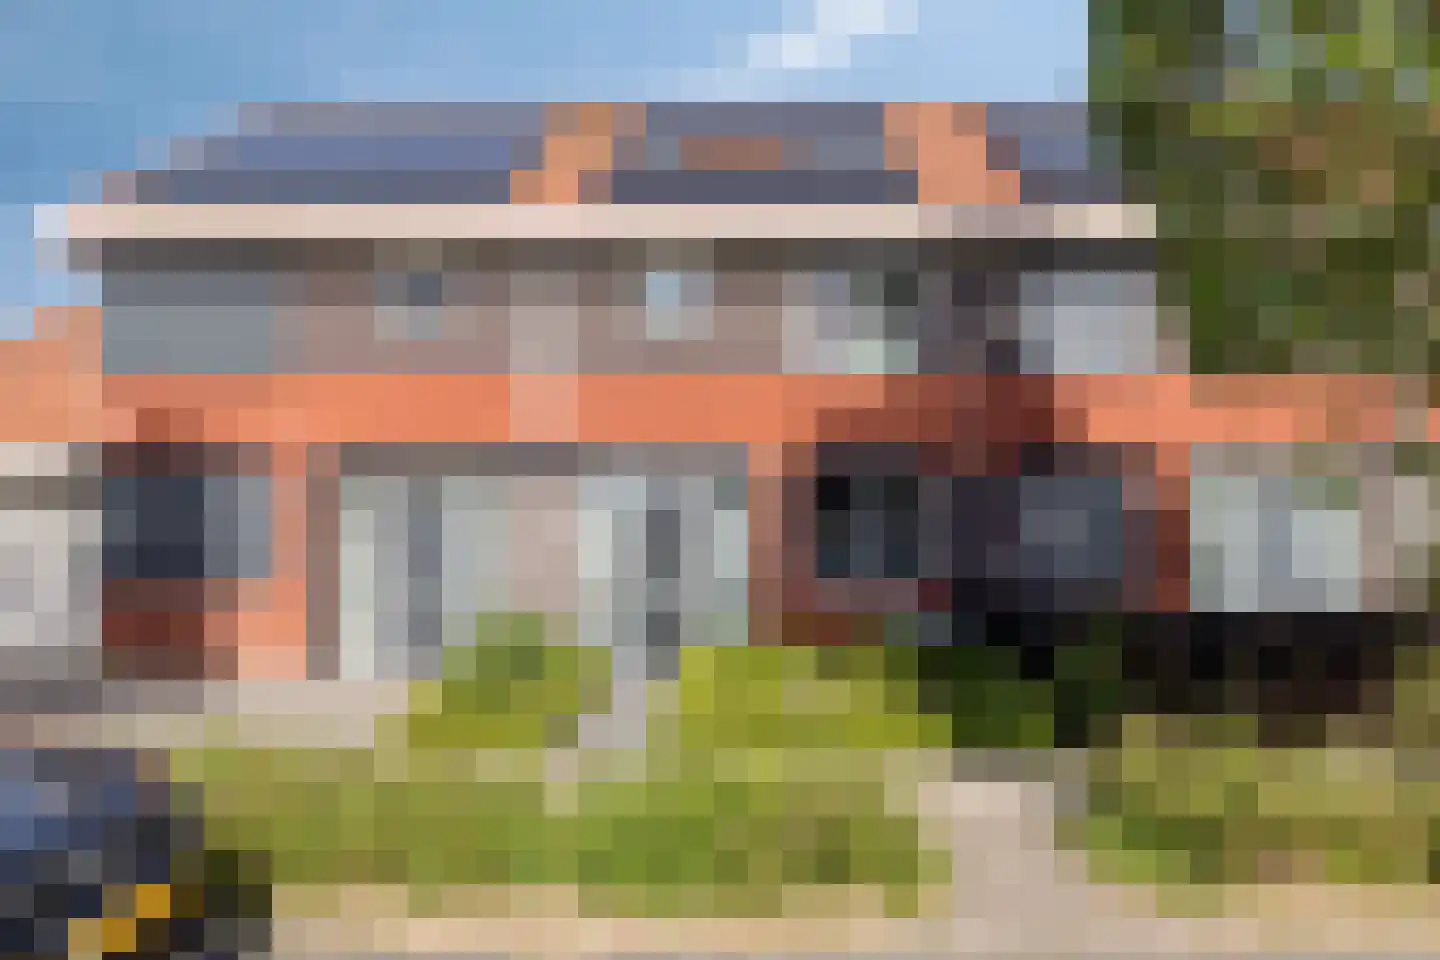
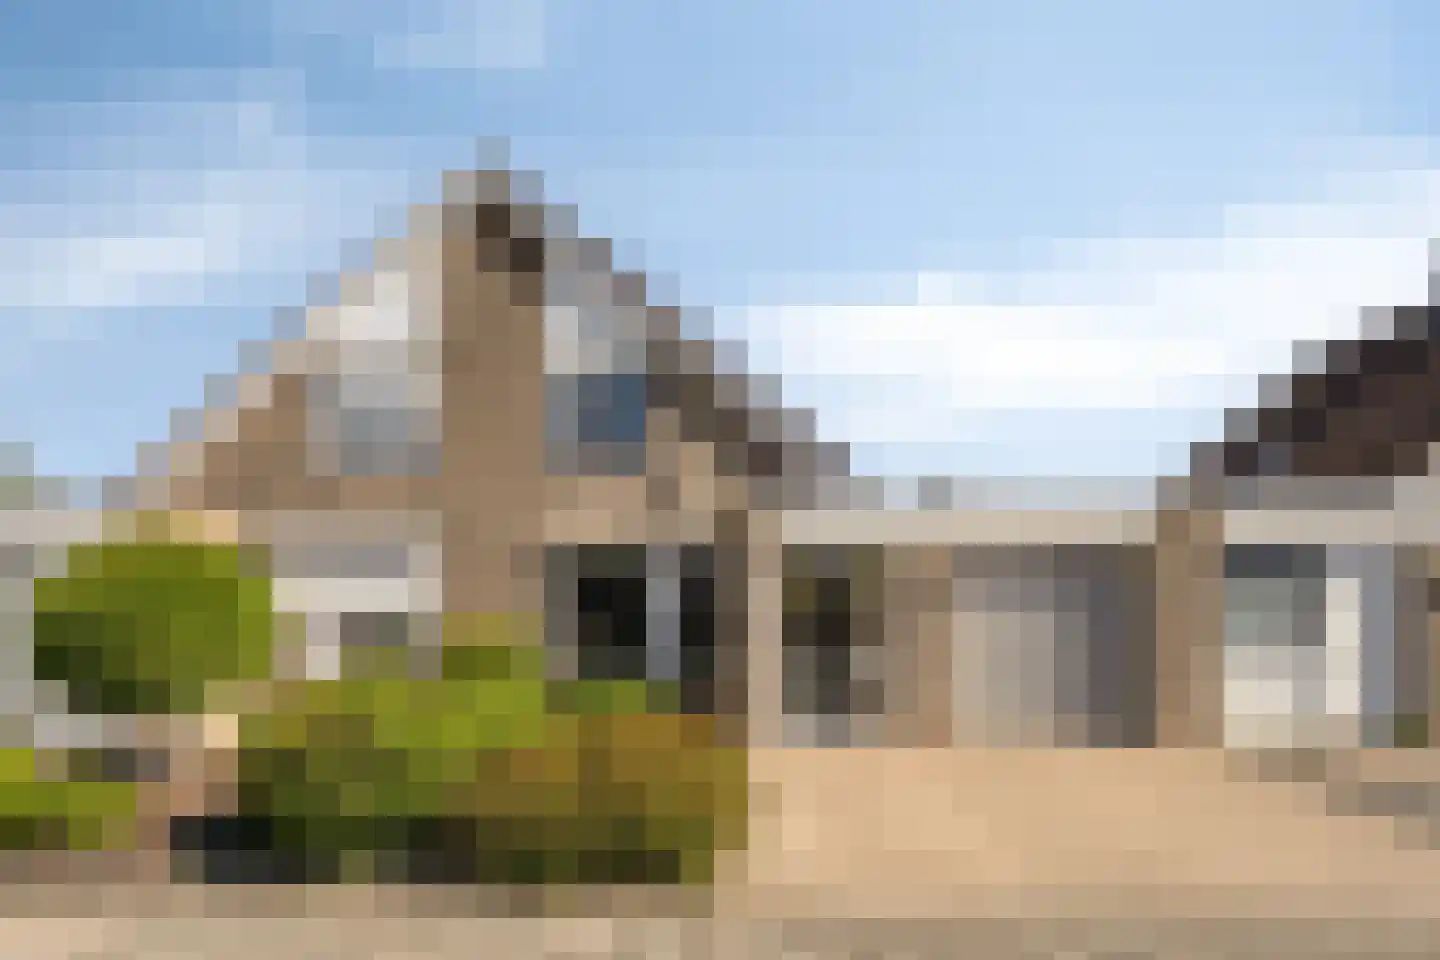
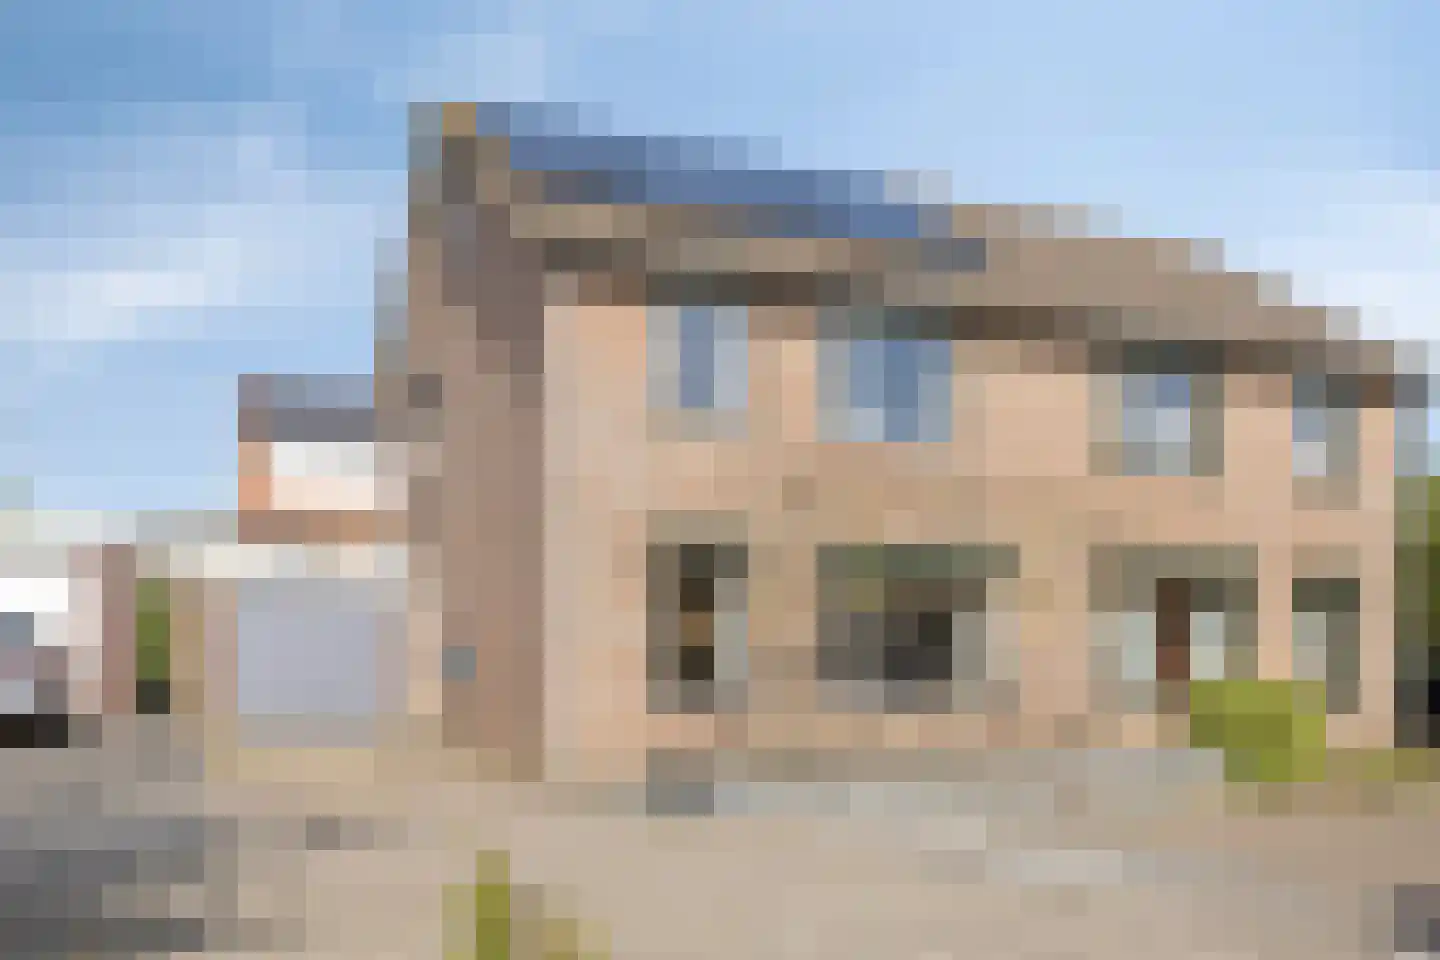
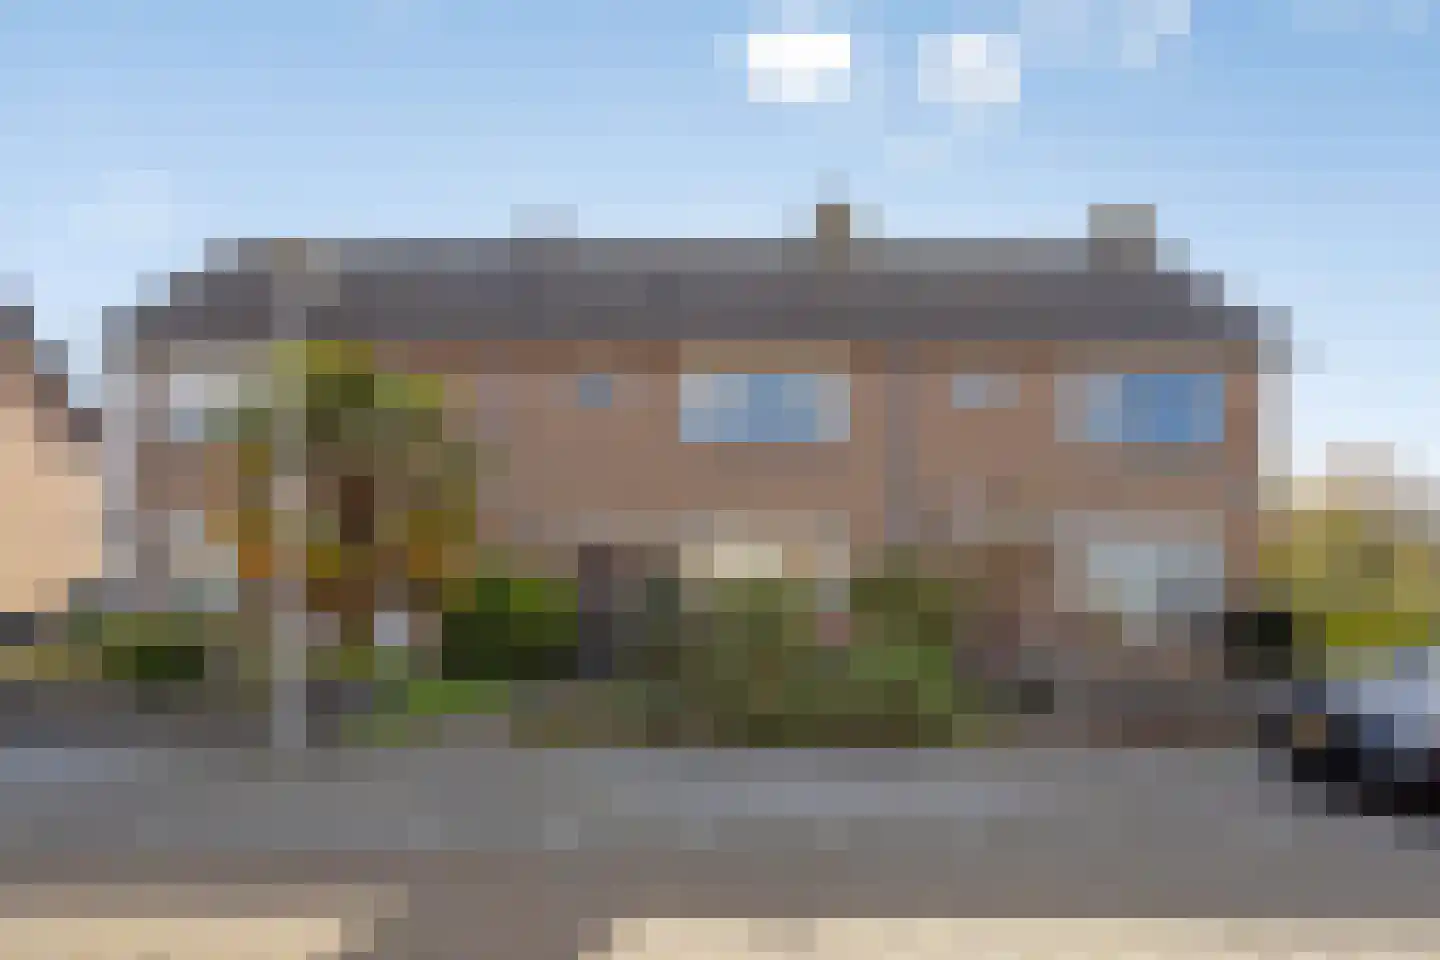
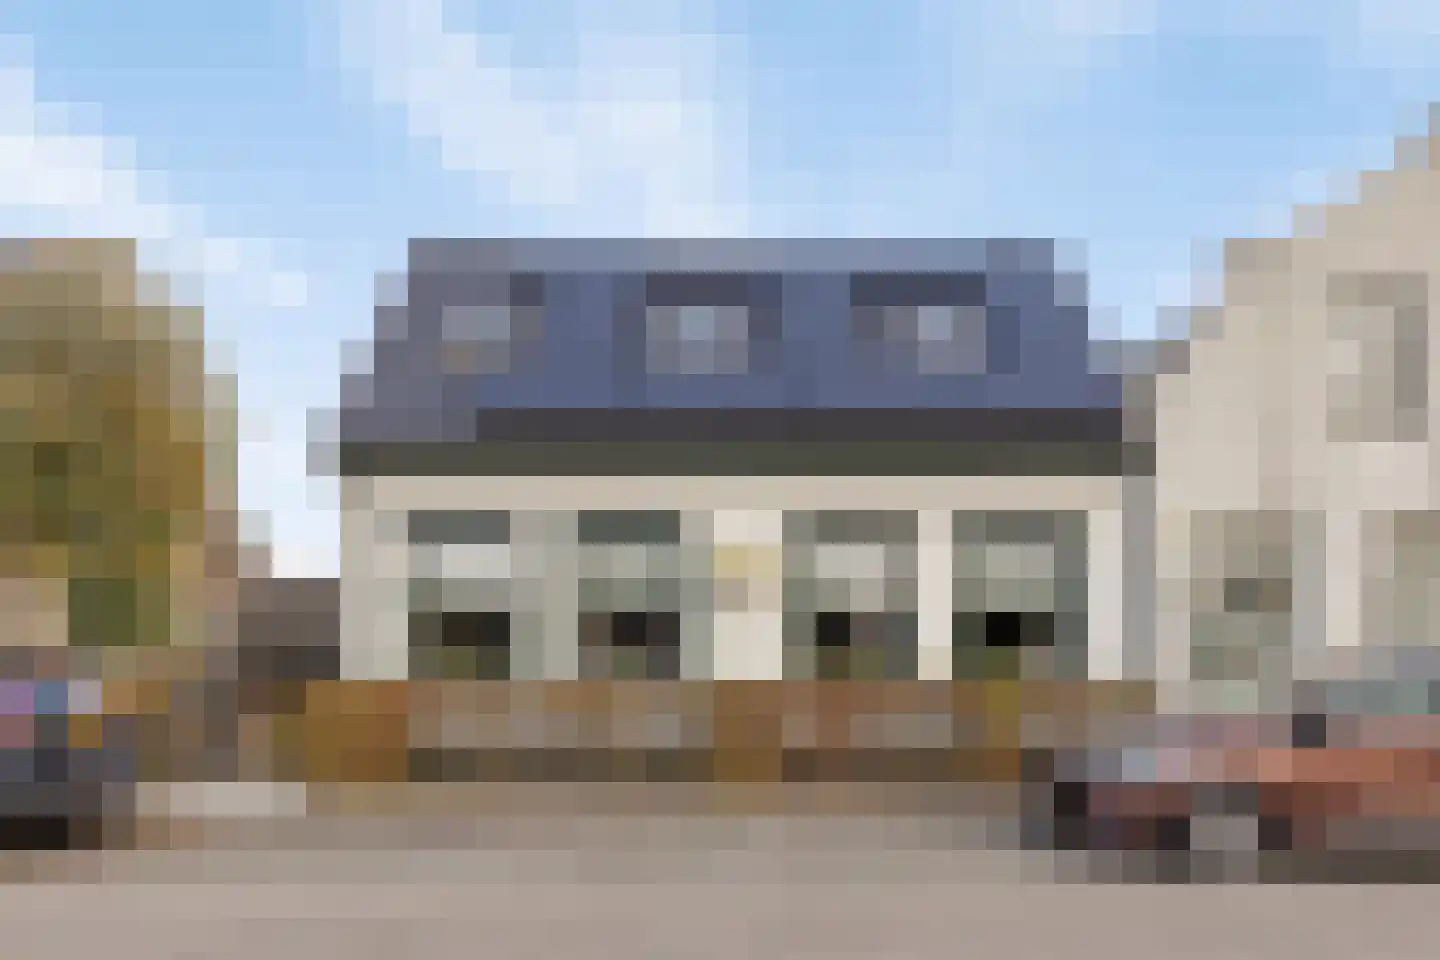
- Available
Oostvoorstraat 31
4671CA Dinteloord
€ 375.000 k.k.
€ 1.904/m²
- Living area
- 197 m²
- Land area
- —
- Bedrooms
- 2
Searching in 85 houses in Dinteloord
Type to search. Use arrow down and arrow up to navigate through results and press Enter to open.
Hidden search suggestions.
View current properties in Dinteloord or search targeted on street, postal code and property characteristics.
View the current housing stock in Dinteloord and quickly filter by price, living area, rooms and more. There are currently 85 houses in this place within our selection. View also 63 sold houses in Dinteloord for extra insight into the local housing market.
4671CA Dinteloord
€ 375.000 k.k.
€ 1.904/m²
4671ES Dinteloord
€ 395.000 k.k.
€ 3.376/m²
4671RH Dinteloord
€ 995.000 k.k.
€ 4.061/m²
4671PN Dinteloord
€ 699.000 k.k.
€ 4.315/m²
4671RH Dinteloord
€ 949.500 k.k.
€ 3.940/m²
4671CT Dinteloord
€ 276.000 k.k.
€ 2.733/m²
4671CN Dinteloord
€ 767.500 k.k.
€ 4.039/m²
4671EH Dinteloord
€ 400.000 k.k.
€ 3.810/m²
4671TH Dinteloord
€ 949.000 k.k.
€ 5.931/m²
4671CD Dinteloord
€ 389.000 k.k.
€ 2.646/m²
4671CR Dinteloord
€ 575.000 k.k.
€ 3.686/m²
4671BS Dinteloord
€ 625.000 k.k.
€ 5.631/m²
4671GR Dinteloord
€ 650.000 k.k.
€ 2.697/m²
4671EX Dinteloord
€ 449.000 k.k.
€ 3.742/m²
4671AA Dinteloord
€ 339.500 k.k.
€ 3.429/m²
4671KR Dinteloord
€ 399.000 k.k.
€ 4.071/m²
4671CJ Dinteloord
€ 419.000 k.k.
€ 3.299/m²
4671KD Dinteloord
€ 499.000 k.k.
€ 3.564/m²
4671BJ Dinteloord
€ 365.000 k.k.
€ 3.842/m²
4671RC Dinteloord
€ 745.000 k.k.
€ 4.209/m²
4671CP Dinteloord
€ 330.000 k.k.
€ 2.821/m²
4671AJ Dinteloord
€ 339.000 k.k.
€ 3.198/m²
4671GB Dinteloord
€ 550.000 k.k.
€ 3.395/m²
4671BB Dinteloord
€ 329.500 k.k.
€ 3.168/m²
4671CS Dinteloord
€ 525.000 k.k.
€ 3.344/m²
4671CA Dinteloord
€ 260.000 k.k.
€ 3.133/m²
4671AJ Dinteloord
€ 359.000 k.k.
€ 3.355/m²
4671DA Dinteloord
€ 285.000 k.k.
€ 4.523/m²
Get free quotes from real estate agents with local market knowledge. Compare more than 17 real estate agents in Dinteloord.
Selling a home in Dinteloord? View the sales-oriented guide sell a house in Dinteloord, compare all real estate agents in Dinteloord or view the top 10 real estate agents in Dinteloord for extra context to your choice.
Real estate agents make sharper offers when they know you're comparing — ask for quotes for sale or purchase.
Practical answers about housing supply, sales and comparing real estate agents in Dinteloord.
The costs of a real estate agent in Dinteloord depend on commission, setup costs, property presentation and the chosen service. Compare the 17 real estate agents in Dinteloord via the real estate agent page and request multiple quotes to compare rates and approach well.
Within our selection, we are currently showing 85 houses in Dinteloord. View also the sold houses in Dinteloord to compare the current offering with recent transactions.
Take into account not only price and living area but also maintenance, energy label, location, outdoor space and sales status. This way you compare houses in Dinteloord on more than just the asking price.
A local real estate agent knows the neighborhoods, recent transactions and demand in Dinteloord. By comparing 17 real estate agents in the region you get a better insight into prices, sales strategy and expected yield; the top 10 in Dinteloord provides a useful starting point.
Yes, when making a sales plan, a valuation in Dinteloord is wise. You gain insight into a realistic asking price and can then compare offers from real estate agents specifically.
View current location data on residents, WOZ development, housing stock, energy consumption, business activity and safety in Dinteloord. In 2025 were there 5.800 residents. The average WOZ value in 2025 is EUR 337.000.
These figures help to better assess and compare the housing stock in Dinteloord with recent sold homes. Orient yourself then on suitable top real estate agents in Dinteloord for sales advice in this region.
Residents
5.800
Last year: 2025
Average WOZ
EUR 337.000
Last year: 2025
Average income per person.
EUR 32.800
Source: AllNumbers
Crimes (current year)
190
Total registered
| Year | Residents |
|---|---|
| 2021 | 5.735 |
| 2022 | 5.850 |
| 2023 | 5.905 |
| 2024 | 5.855 |
| 2025 | 5.800 |
| Year | Average WOZ |
|---|---|
| 2021 | EUR 238.000 |
| 2022 | EUR 269.000 |
| 2023 | EUR 306.000 |
| 2024 | EUR 320.000 |
| 2025 | EUR 337.000 |
Hoger
790
Praktisch
1.380
Middelbaar
2.200
Europa
490
Nederland
4.765
Buiten Europa
545
Label C
635
Label A
623
Label B
497
Label G
270
Label D
227
Label F
171
Label E
128
Label A+
26
Label A+++
17
Label A++++
9
Label A++
8
Label A+++++
0
| Year | Gas (m3) | Electricity (kWh) |
|---|---|---|
| 2020 | 1.280 | 3.130 |
| 2021 | 1.440 | 3.180 |
| 2022 | 1.090 | 2.970 |
| 2023 | 920 | 2.840 |
| 2024 | 900 | 2.930 |
Hoekwoning
Gas: 900 • Electricity: 2.530
Huurwoning
Gas: 780 • Electricity: 2.160
Koopwoning
Gas: 1.000 • Electricity: 3.240
Appartement
Gas: 630 • Electricity: 2.040
Tussenwoning
Gas: 800 • Electricity: 2.480
Vrijstaande woning
Gas: 1.210 • Electricity: 3.910
Twee-onder-één-kap woning
Gas: 970 • Electricity: 2.990
Total number of company establishments: 680
| Period | Crimes |
|---|---|
| jan 2026 | 14 |
| jul 2025 | 19 |
| jun 2025 | 17 |
| mei 2025 | 23 |
| mrt 2025 | 19 |
| mrt 2026 | 9 |
| nov 2024 | 12 |
| nov 2025 | 8 |
| okt 2024 | 15 |
| okt 2025 | 17 |
| sep 2024 | 13 |
| sep 2025 | 13 |
These figures give an indicative picture of safety trends in the living environment of Dinteloord.
Short answers based on current local statistics, handy for a quick comparison of the living environment.
Dinteloord telt in 2025 ongeveer 5.800 inwoners.
De gemiddelde WOZ-waarde in Dinteloord is in 2025 circa € 337.000.
Het gemiddelde inkomen per inwoner in Dinteloord ligt rond € 32.800 per jaar.
Voor het huidige jaar gaat het om ongeveer 190 geregistreerde misdrijven. Gebruik deze cijfers als indicatie en vergelijk trends per periode.
In Dinteloord komt vooral "Tussenwoningen" veel voor, met ongeveer 775 woningen.