Residents
2.097
Last year: 2026
7214AG Epse • Gelderland
€ 490.000 k.k.
Cost of copper (estimated): € 11.650
2% transfer tax (€ 9.800) + notary (€ 1.150) + valuation (€ 700)
Total incl. VAT: € 501.650
Purchase price /m²: € 3.603
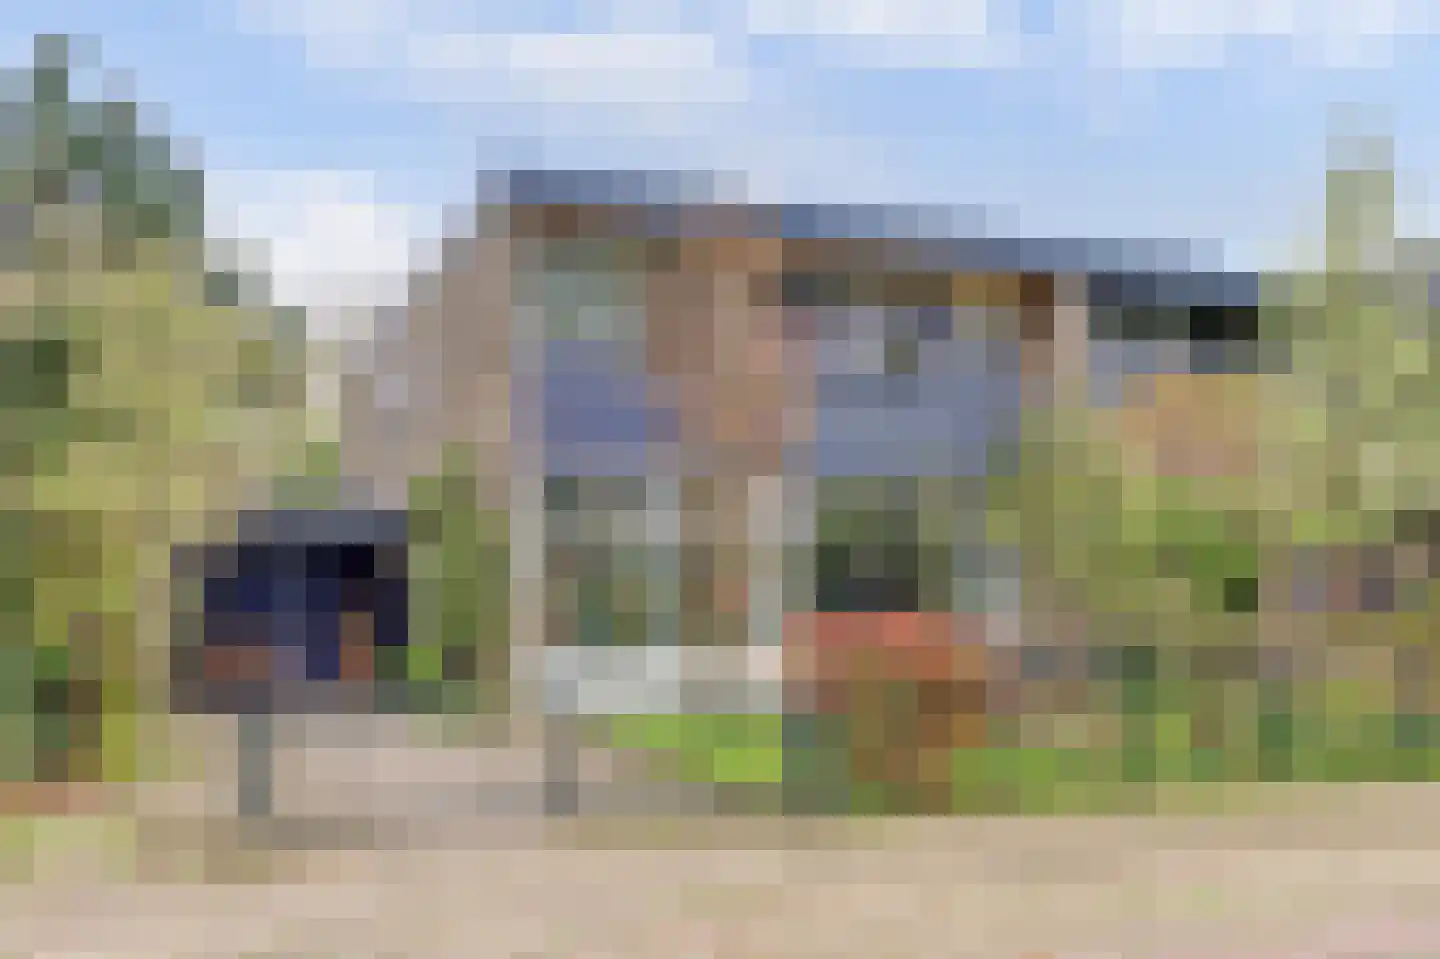
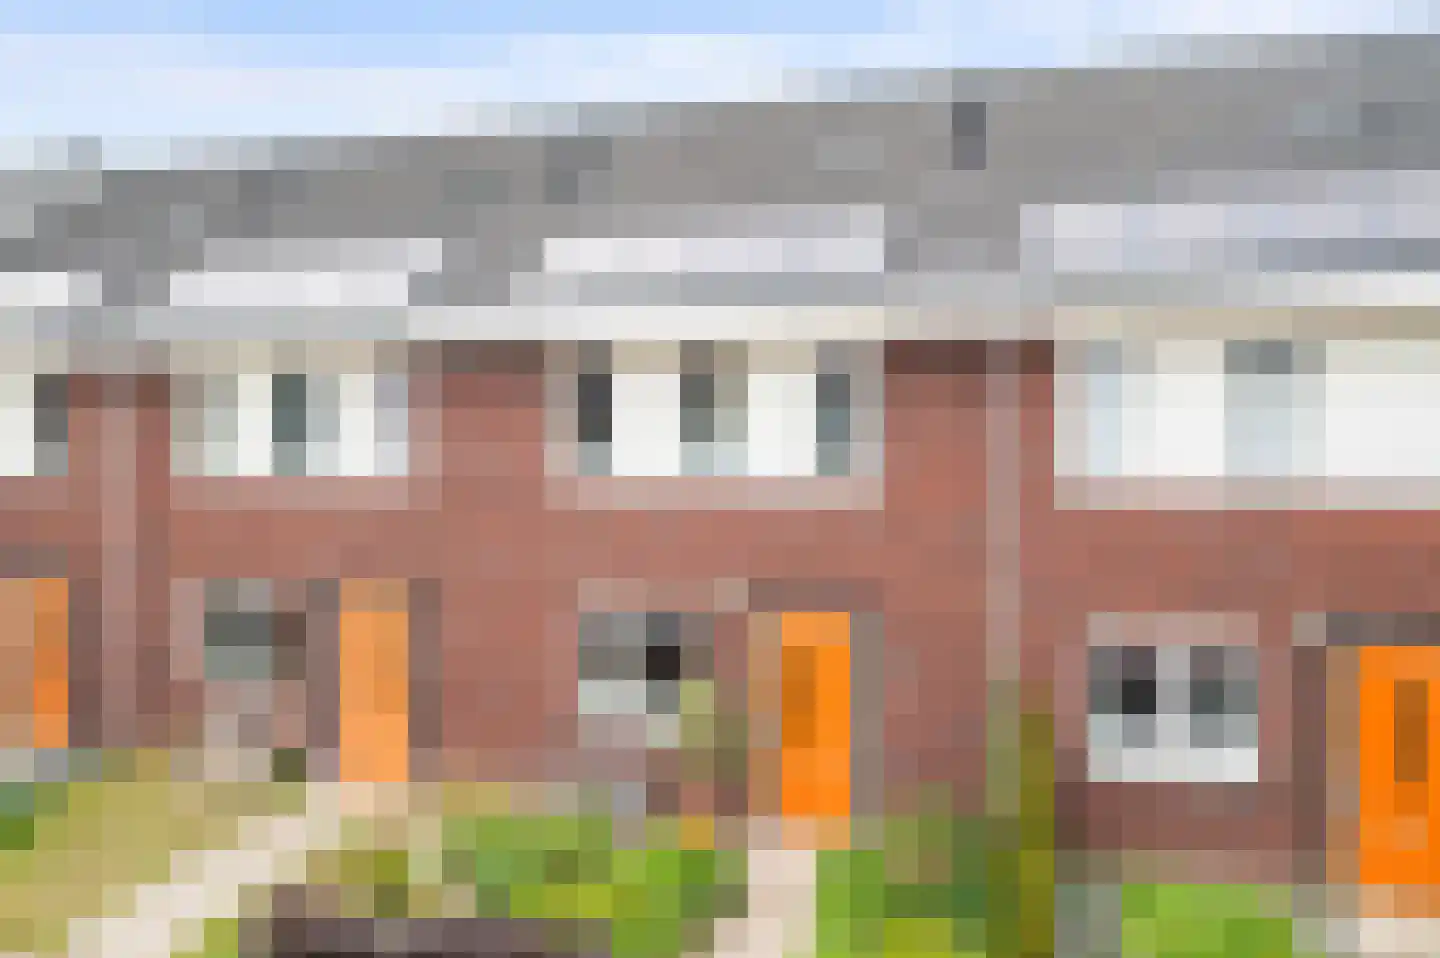
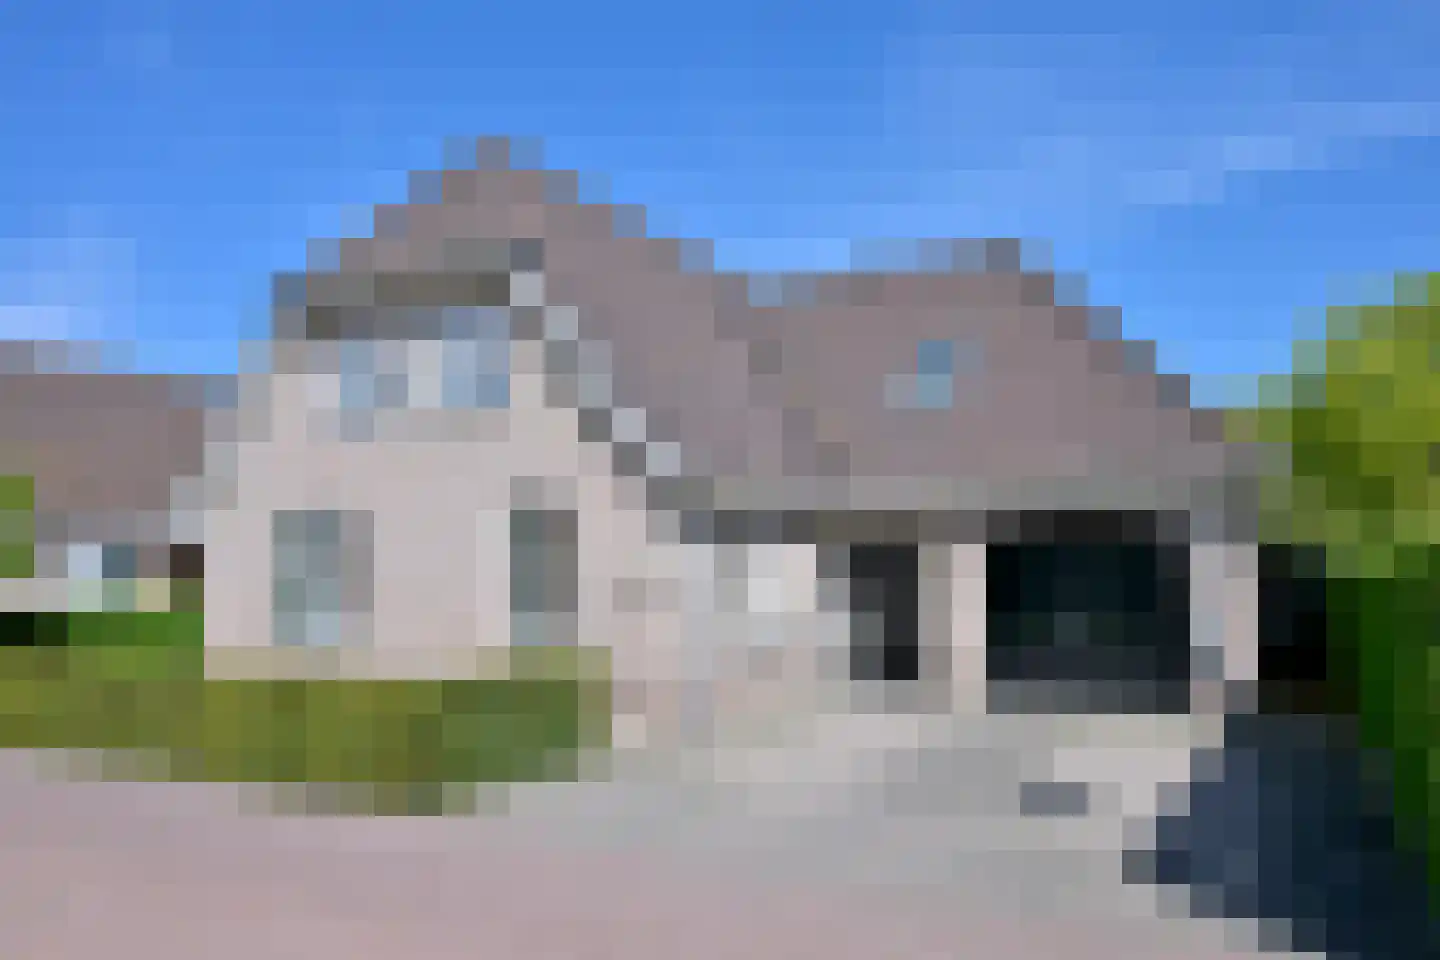
VEELZIJDIGE WONING OP AANTREKKELIJKE LOCATIE Uitgebouwde helft van dubbel woonhuis met twee vrijstaande houten schuren, plantenkas, overdekte entree en eigen oprit. Een speels ontwerp (1968) met zowel een balkon aan de voor- als achterzijde en een flinke aanbouw (2008) als goede basis met verrassend veel ruimte en flexibiliteit. De aangebouwde werk- of speelkamer met bijkeuken zou ook kunnen dienen als slaap- en badkamer op de begane grond. Hierdoor sluit het perfect aan op uiteenlopende woonwensen, van gezinsleven tot gelijkvloers wonen. Op de verdieping bevinden zich drie comfortabele slaapkamers, ideaal voor het gezin. Buiten ligt een riante tuin op het noordwesten, waar u tot in de avond van de zon geniet. De tuin is speels ingericht met meerdere hoekjes en zitjes, zodat u op elk moment een fijne plek vindt om te ontspannen. De woning is gelegen in een groene, rustige woonwijk met vrij uitzicht op tegenover gesitueerd speelveld, wat het een ideale plek maakt voor gezinnen met kinderen, maar bovenal nooit verveelt. De groene omgeving en de nabijheid van Deventer zorgen voor een perfecte balans tussen rust, ruimte en voorzieningen. PERCEEL Het royale perceel van 489 m² is het absolute pluspunt van deze woning. Dankzij de ligging geniet u aan de voor- en zijkant van vrij uitzicht op groen en de tegenovergelegen speeltuin, wat zorgt voor een ruimtelijk en vrij gevoel. De tuin is veelzijdig ingericht met meerdere zitjes, een sfeervolle verhoogde zitkuil en een vijver. Direct aan de woning bevindt zich een prettig terras, ideaal voor lange zomeravonden of een kop koffie in de ochtendzon. Op het perceel staan twee vrijstaande houten schuren, waarvan één is ingericht als fietsenschuur. De eigen oprit maakt het geheel compleet en biedt extra gemak. INDELING Begane grond: Hal met toegang tot provisiekast en originele marmeren breuksteenvloer. Toilet met wandcloset en fontein. Lichte, doorzon woonkamer met houtkachel en dubbele schuifpui. Open keuken met gaskookplaat, afzuigkap, koelkast, vriezer en oven. Bijkeuken met vaste kast, lichtkoepel en kast met wasmachine- aansluiting en aansluiting voor toilet en douche. Kantoorruimte met openslaande deuren en uitstortbak. 1e Verdieping: Overloop. Drie slaapkamers waarvan twee met vaste kast en alle drie toegang tot een balkon. Badkamer met ligbad, inloopdouche en wastafelmeubel. Separaat toilet met vaste kast. Balkon over de gehele breedte aan zowel de voor- als achterzijde. KENMERKEN Bouwjaar: 1968. Perceel: 489 m². Inhoud: ca. 480 m³. Woonoppervlakte: ca. 136 m². Heteluchtverwarming (2009), zonneboiler. Glas en gedeeltelijk dak-, muur- en vloerisolatie. Energielabel C.
€ 490.000
Cost of copper (estimated): € 11.650
2% transfer tax (€ 9.800) + notary (€ 1.150) + valuation (€ 700)
Total purchase (incl. p.p.): € 501.650
3,21%
Yearly
€ 24.500
Direct available
Estimated mortgage
Indicative gross monthly cost
Based on annuity and 30 year term
Indicative net monthly cost
iDisclaimer: this mortgage calculation is a simplified indication based on general assumptions. No rights can be derived from the results shown. Calculated with 10-annual interest (zonder NHG), automatically determined based on the price limit € 470.000. Source: 10-jaars rente uit mortgage_rates (08-06-2026 03:45). For non-NHG, an 80% mortgage of the market value has been used in this indication.
Douche, ligbad, wastafel, en wastafelmeubel
Explore Epse and the surrounding areas
View current location data on residents, WOZ development, housing stock, energy consumption, business activity and safety in Epse. In 2026 were there 2.097 residents. The average WOZ value in 2025 is EUR 620.938.
Residents
2.097
Last year: 2026
Average WOZ
EUR 620.938
Last year: 2025
Average income per person.
EUR 40.736
Source: AllNumbers
Crimes (current year)
23
Total registered
| Year | Residents |
|---|---|
| 2021 | 2.080 |
| 2022 | 2.095 |
| 2023 | 2.070 |
| 2024 | 2.080 |
| 2025 | 2.090 |
| 2026 | 2.097 |
| Year | Average WOZ |
|---|---|
| 2021 | EUR 459.157 |
| 2022 | EUR 506.369 |
| 2023 | EUR 617.066 |
| 2024 | EUR 621.534 |
| 2025 | EUR 620.938 |
Hoger
720
Praktisch
220
Middelbaar
550
Europa
115
Nederland
1.795
Buiten Europa
175
Label C
244
Label A
202
Label D
128
Label B
104
Label G
100
Label F
94
Label E
61
Label A+++
19
Label A+
9
Label A++
9
Label A++++
1
Label A+++++
0
| Year | Gas (m3) | Electricity (kWh) |
|---|---|---|
| 2020 | 1.882 | 3.653 |
| 2021 | 2.157 | 3.735 |
| 2022 | 1.686 | 3.504 |
| 2023 | 1.365 | 3.392 |
| 2024 | 1.296 | 3.588 |
Hoekwoning
Gas: 729 • Electricity: 1.887
Huurwoning
Gas: 1.025 • Electricity: 2.449
Koopwoning
Gas: 1.425 • Electricity: 3.569
Appartement
Gas: 1.091 • Electricity: 2.340
Tussenwoning
Gas: 644 • Electricity: 1.756
Vrijstaande woning
Gas: 1.818 • Electricity: 4.319
Twee-onder-één-kap woning
Gas: 1.093 • Electricity: 3.064
Total number of company establishments: 355
| Period | Crimes |
|---|---|
| jan 2026 | 6 |
| jul 2025 | 3 |
| jun 2025 | 2 |
| mei 2025 | 4 |
| mrt 2025 | 1 |
| mrt 2026 | 0 |
| nov 2024 | 3 |
| nov 2025 | 2 |
| okt 2024 | 6 |
| okt 2025 | 2 |
| sep 2024 | 2 |
| sep 2025 | 1 |
These figures give an indicative picture of safety trends in the living environment of Epse.
Short answers based on current local statistics, handy for a quick comparison of the living environment.
Epse telt in 2026 ongeveer 2.097 inwoners.
De gemiddelde WOZ-waarde in Epse is in 2025 circa € 620.938.
Het gemiddelde inkomen per inwoner in Epse ligt rond € 40.736 per jaar.
Voor het huidige jaar gaat het om ongeveer 23 geregistreerde misdrijven. Gebruik deze cijfers als indicatie en vergelijk trends per periode.
In Epse komt vooral "Vrijstaande woningen" veel voor, met ongeveer 445 woningen.
View more homes in this location.
7214AT Epse
€ 475.000 k.k.
€ 3.862/m²

7214RL Epse
€ 1.200.000 k.k.
€ 4.615/m²
7214CE Epse
€ 945.000 k.k.

7214EE Epse
€ 945.000 k.k.
€ 4.587/m²

7214RD Epse
€ 895.000 k.k.
€ 4.945/m²
7214BE Epse
€ 390.000 k.k.
€ 4.432/m²

7214RN Epse
€ 169.500 k.k.

7214AR Epse
€ 549.000 k.k.
