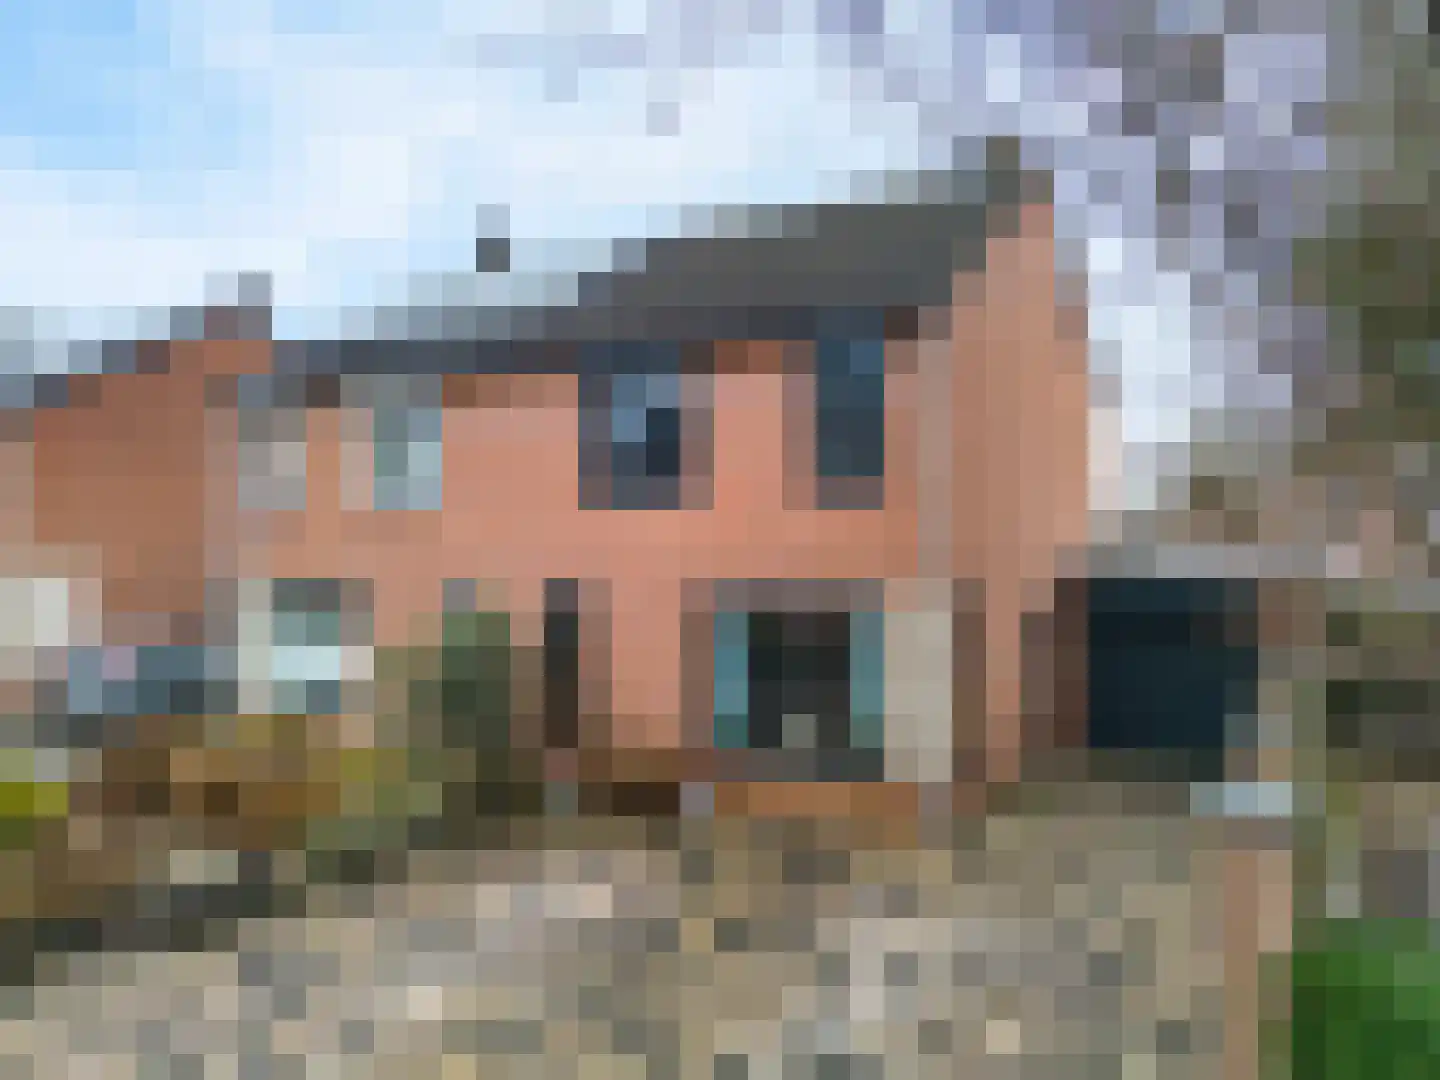
Houses sold in Geleen

View 307 sold houses in Geleen

Connected to: Vastgoed Nederland NVM Makelaars

On this page you will find recently sold homes in Geleen. Use this overview to better estimate selling prices, popular neighborhoods, and the local housing supply before you choose a real estate agent. Also view the current housing supply with 427 houses in Geleen.

Selection

Search and filter homes

Set your preferences and discover homes that suit you.

Total supply 242.483
Filters

Set price, area and other characteristics. Adjust a filter or click on Show homes. Location changes directly above.

Reset filters

You search for

  • Place Geleen
  • Status Sold

Huis verkopen in Geleen? Vergelijk verkoopmakelaars

Bekijk recente verkopen en ontvang gratis offertes van lokale makelaars. Vergelijk meer dan 65 makelaars in Geleen.

Free request a quote

  • Quotes in Geleen
  • Non-binding
  • Personal
  • Gratis tarieven vergelijken

Recent verkocht in Geleen? Lees de verkoopgerichte gids huis verkopen in Geleen, vergelijk verkoopmakelaars in Geleen of bekijk de beste verkoopmakelaars in Geleen voor referentie bij jouw keuze.

Vergelijk meerdere offertes

Makelaars maken scherpere voorstellen als ze weten dat je vergelijkt — vraag offertes aan voor verkoop of aankoop.

Frequently asked questions about sold homes in Geleen

Short answers about housing prices, sold homes and comparing real estate agents in Geleen.

Residential and neighborhood statistics in Geleen

View current location data on residents, WOZ development, housing stock, energy consumption, business activity and safety in Geleen. In 2026 were there 31.192 residents. The average WOZ value in 2025 is EUR 241.000.

These figures help to better assess and compare the housing stock in Geleen with recent sold homes. Orient yourself then on suitable top real estate agents in Geleen for sales advice in this region.

Residents

31.192

Last year: 2026

Average WOZ

EUR 241.000

Last year: 2025

Average income per person.

EUR 31.700

Source: AllNumbers

Crimes (current year)

1.859

Total registered

Demographics and WOZ development

Inhabitants per year

Inhabitants per year in Geleen
Year Residents
2021 31.245
2022 31.070
2023 31.185
2024 31.485
2025 31.330
2026 31.192

Annual WOZ value

WOZ value per year in Geleen
Year Average WOZ
2021 EUR 178.000
2022 EUR 189.000
2023 EUR 219.000
2024 EUR 222.000
2025 EUR 241.000

Composition of residents

Age build-up

65+: 8.255 0-15: 3.780 15-25: 3.060 25-45: 7.825 45-65: 8.275

Education level

Hoger

6.090

Praktisch

7.740

Middelbaar

9.870

Origin of residents (2025)

Europa

4.055

Nederland

22.280

Buiten Europa

4.995

Housing stock and construction periods

Types of homes

Hoekwoningen 2.690
Appartementen 6.202
Tussenwoningen 4.103
Vrijstaande woningen 1.098
Twee-onder-één-kap woningen 2.780

Construction period of buildings

Voor 1700 9
1700 tot 1900 118
1900 tot 1925 429
1925 tot 1950 3.067
1950 tot 1970 5.356
1970 tot 1980 1.739
1980 tot 1990 962
1990 tot 2000 832
2000 tot 2010 429
2010 tot 2020 401
2020 en later 353

Energy and sustainability

Energy label distribution

Label C

3.558

Label A

2.588

Label F

2.570

Label D

2.174

Label B

2.154

Label E

1.915

Label G

1.459

Label A+

455

Label A++++

154

Label A+++

145

Label A++

64

Label A+++++

2

Average energy consumption per year

Average energy consumption per year in Geleen
Year Gas (m3) Electricity (kWh)
2020 1.160 2.740
2021 1.310 2.760
2022 1.030 2.630
2023 880 2.510
2024 840 2.550

Consumption per house type

Hoekwoning

Gas: 960 • Electricity: 2.840

Huurwoning

Gas: 730 • Electricity: 2.050

Koopwoning

Gas: 1.000 • Electricity: 2.870

Appartement

Gas: 680 • Electricity: 1.900

Tussenwoning

Gas: 850 • Electricity: 2.590

Vrijstaande woning

Gas: 1.430 • Electricity: 3.750

Twee-onder-één-kap woning

Gas: 1.060 • Electricity: 2.920

Business activity in Geleen (2025)

Handel en HORECA 690
Nijverheid en energie 500
Zakelijke dienstverlening 715
Overheid, onderwijs en zorg 630
Landbouw, bosbouw en visserij 15
Vervoer, informatie en communicatie 180
Financiele diensten en onroerendgoed 150
Cultuur, recreatie en overige diensten 445

Total number of company establishments: 3.315

Recent crime statistics

Recent crime statistics in Geleen
Period Crimes
jan 2026 123
jul 2025 133
jun 2025 157
mei 2025 165
mrt 2025 168
mrt 2026 142
nov 2024 154
nov 2025 135
okt 2024 174
okt 2025 160
sep 2024 182
sep 2025 114

These figures give an indicative picture of safety trends in the living environment of Geleen.

Frequently asked questions about living in Geleen

Short answers based on current local statistics, handy for a quick comparison of the living environment.

Hoeveel inwoners heeft Geleen?

Geleen telt in 2026 ongeveer 31.192 inwoners.

Wat is de gemiddelde WOZ-waarde in Geleen?

De gemiddelde WOZ-waarde in Geleen is in 2025 circa € 241.000.

Wat is het gemiddelde inkomen per inwoner in Geleen?

Het gemiddelde inkomen per inwoner in Geleen ligt rond € 31.700 per jaar.

Hoe veilig is wonen in Geleen?

Voor het huidige jaar gaat het om ongeveer 1.859 geregistreerde misdrijven. Gebruik deze cijfers als indicatie en vergelijk trends per periode.

Welke woningtypen komen het meest voor in Geleen?

In Geleen komt vooral "Appartementen" veel voor, met ongeveer 6.202 woningen.

Receive free, non-binding quotes

Compare multiple real estate agents and choose the best match.