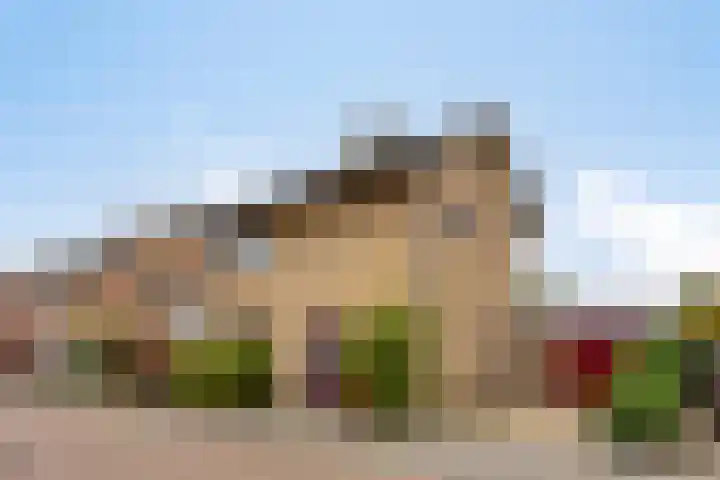
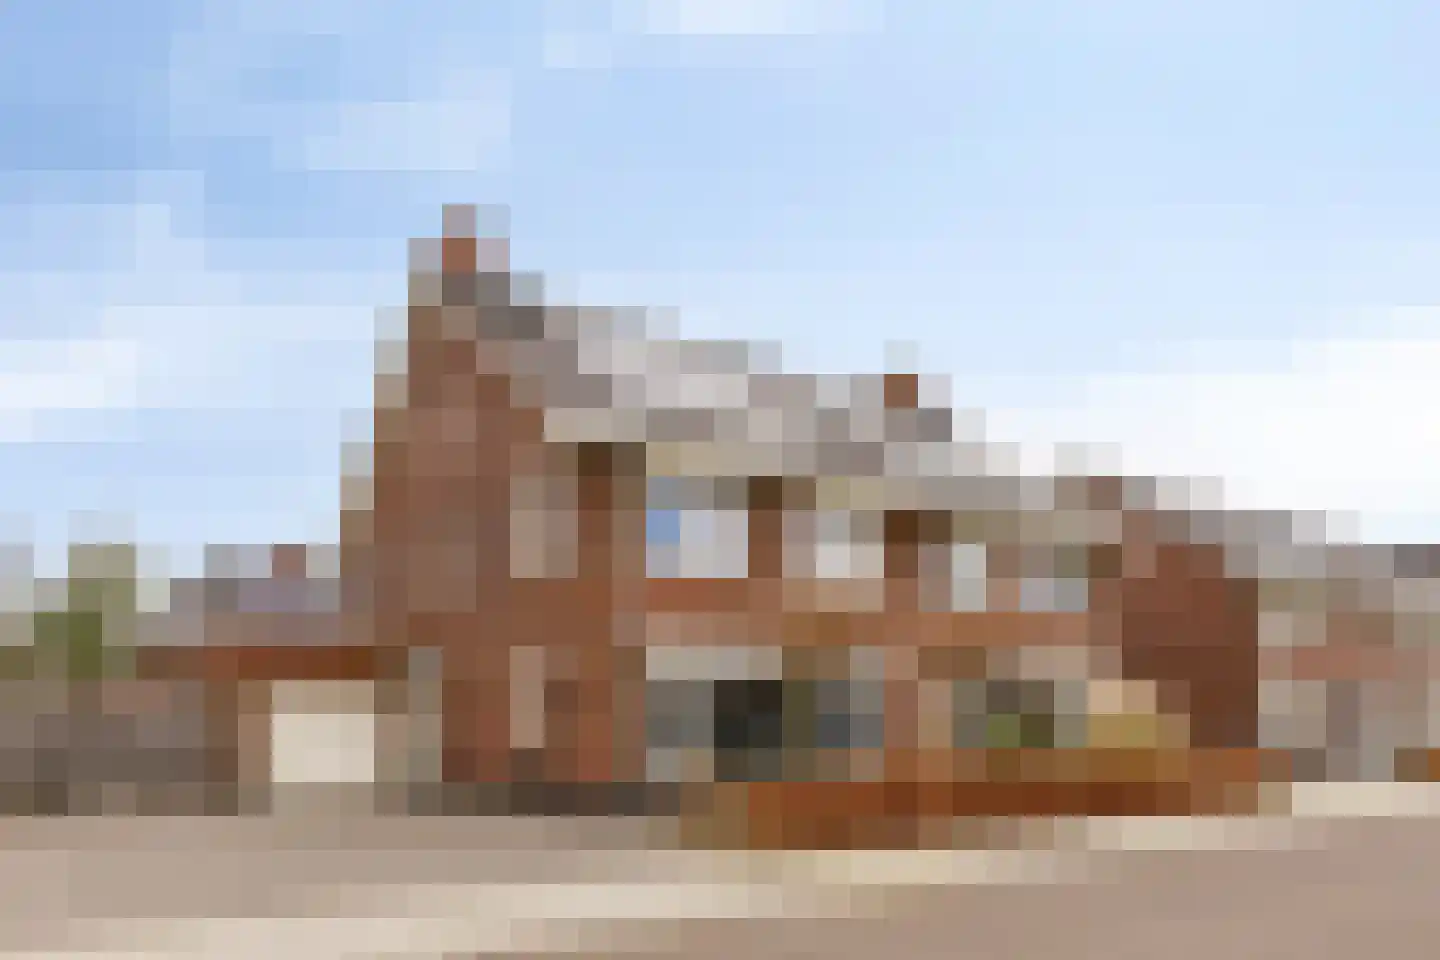
Houses sold in Haarsteeg

View 17 sold houses in Haarsteeg

Connected to: Vastgoed Nederland NVM Makelaars

On this page you will find recently sold homes in Haarsteeg. Use this overview to better estimate selling prices, popular neighborhoods, and the local housing supply before you choose a real estate agent. Also view the current housing supply with 29 houses in Haarsteeg.

Selection

Search and filter homes

Set your preferences and discover homes that suit you.

Total supply 241.821
Filters

Set price, area and other characteristics. Adjust a filter or click on Show homes. Location changes directly above.

Reset filters

You search for

  • Place Haarsteeg
  • Status Sold

Sell your house in Haarsteeg? Compare real estate agents

View recent sales and receive free quotes from local real estate agents. Compare more than 85 real estate agents in Haarsteeg.

Free request a quote

  • Quotes in Haarsteeg
  • Non-binding
  • Personal
  • Compare free rates

Selling your own home in Haarsteeg? Compare real estate agents in Haarsteeg or view the best real estate agents in Haarsteeg as a reference for your choice.

Compare multiple quotes

Real estate agents make sharper offers when they know you're comparing — ask for quotes for sale or purchase.

Frequently asked questions about sold homes in Haarsteeg

Short answers about housing prices, sold homes and comparing real estate agents in Haarsteeg.

Residential and neighborhood statistics in Haarsteeg

View current location data on residents, WOZ development, housing stock, energy consumption, business activity and safety in Haarsteeg. In 2025 were there 2.595 residents. The average WOZ value in 2025 is EUR 562.000.

These figures help to better assess and compare the housing stock in Haarsteeg with recent sold homes. Orient yourself then on suitable top real estate agents in Haarsteeg for sales advice in this region.

Residents

2.595

Last year: 2025

Average WOZ

EUR 562.000

Last year: 2025

Average income per person.

EUR 38.400

Source: AllNumbers

Crimes (current year)

36

Total registered

Demographics and WOZ development

Inhabitants per year

Inhabitants per year in Haarsteeg
Year Residents
2021 2.300
2022 2.430
2023 2.475
2024 2.590
2025 2.595

Annual WOZ value

WOZ value per year in Haarsteeg
Year Average WOZ
2021 EUR 394.000
2022 EUR 441.000
2023 EUR 521.000
2024 EUR 531.000
2025 EUR 562.000

Composition of residents

Age build-up

65+: 405 0-15: 365 15-25: 385 25-45: 600 45-65: 835

Education level

Hoger

620

Praktisch

550

Middelbaar

870

Origin of residents (2025)

Europa

155

Nederland

2.335

Buiten Europa

105

Housing stock and construction periods

Types of homes

Hoekwoningen 69
Appartementen 51
Tussenwoningen 109
Vrijstaande woningen 512
Twee-onder-één-kap woningen 247

Construction period of buildings

Voor 1700 1
1700 tot 1900 74
1900 tot 1925 54
1925 tot 1950 93
1950 tot 1970 193
1970 tot 1980 102
1980 tot 1990 59
1990 tot 2000 133
2000 tot 2010 74
2010 tot 2020 115
2020 en later 127

Energy and sustainability

Energy label distribution

Label A

204

Label B

149

Label C

144

Label D

120

Label G

120

Label F

79

Label A+++

46

Label A++

45

Label A+

38

Label E

32

Label A++++

6

Label A+++++

0

Average energy consumption per year

Average energy consumption per year in Haarsteeg
Year Gas (m3) Electricity (kWh)
2020 1.650 3.940
2021 1.900 4.050
2022 1.400 3.710
2023 1.120 3.530
2024 1.010 3.730

Consumption per house type

Hoekwoning

Gas: 740 • Electricity: 2.870

Huurwoning

Gas: 1.140 • Electricity: 2.710

Koopwoning

Gas: 1.120 • Electricity: 3.670

Appartement

Gas: 790 • Electricity: 2.470

Tussenwoning

Gas: 690 • Electricity: 2.600

Vrijstaande woning

Gas: 1.330 • Electricity: 3.930

Twee-onder-één-kap woning

Gas: 1.010 • Electricity: 3.420

Business activity in Haarsteeg (2025)

Handel en HORECA 75
Nijverheid en energie 105
Zakelijke dienstverlening 85
Overheid, onderwijs en zorg 50
Landbouw, bosbouw en visserij 45
Vervoer, informatie en communicatie 20
Financiele diensten en onroerendgoed 25
Cultuur, recreatie en overige diensten 35

Total number of company establishments: 440

Recent crime statistics

Recent crime statistics in Haarsteeg
Period Crimes
jan 2025 6
jan 2026 2
jul 2025 4
jun 2025 0
mei 2025 0
mrt 2025 2
nov 2024 3
nov 2025 1
okt 2024 2
okt 2025 1
sep 2024 6
sep 2025 3

These figures give an indicative picture of safety trends in the living environment of Haarsteeg.

Frequently asked questions about living in Haarsteeg

Short answers based on current local statistics, handy for a quick comparison of the living environment.

Hoeveel inwoners heeft Haarsteeg?

Haarsteeg telt in 2025 ongeveer 2.595 inwoners.

Wat is de gemiddelde WOZ-waarde in Haarsteeg?

De gemiddelde WOZ-waarde in Haarsteeg is in 2025 circa € 562.000.

Wat is het gemiddelde inkomen per inwoner in Haarsteeg?

Het gemiddelde inkomen per inwoner in Haarsteeg ligt rond € 38.400 per jaar.

Hoe veilig is wonen in Haarsteeg?

Voor het huidige jaar gaat het om ongeveer 36 geregistreerde misdrijven. Gebruik deze cijfers als indicatie en vergelijk trends per periode.

Welke woningtypen komen het meest voor in Haarsteeg?

In Haarsteeg komt vooral "Vrijstaande woningen" veel voor, met ongeveer 512 woningen.

Receive free, non-binding quotes

Compare multiple real estate agents and choose the best match.