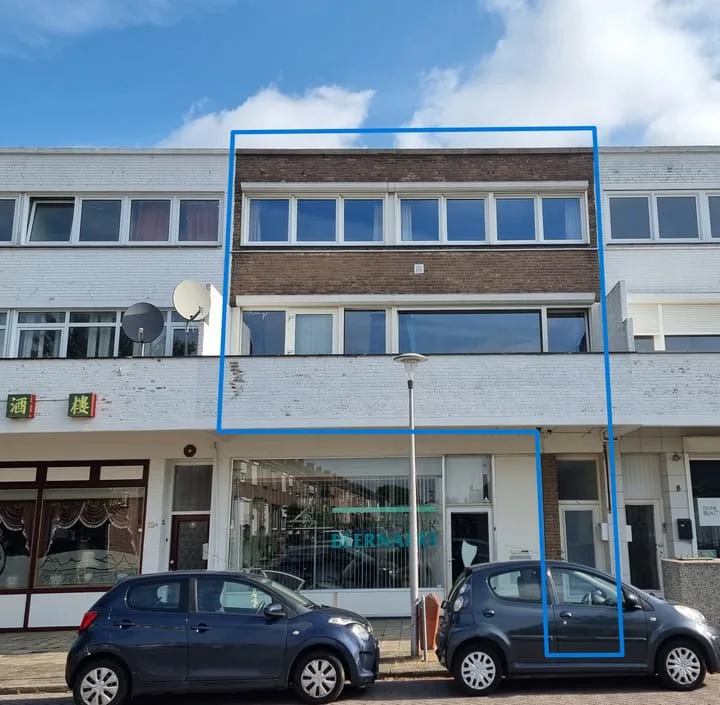
- Sold
Heerlerweg 117 A
6433HR Hoensbroek
€ 448.000 k.k.
€ 2.966/m²
- Living area
- 151 m²
- Land area
- 555 m²
- Bedrooms
- 3
View 179 sold houses in Hoensbroek
Type to search. Use arrow down and arrow up to navigate through results and press Enter to open.
Hidden search suggestions.
Compare sold homes in Hoensbroek or view the current offering in this location directly.
On this page you will find recently sold homes in Hoensbroek. Use this overview to better estimate selling prices, popular neighborhoods, and the local housing supply before you choose a real estate agent. Also view the current housing supply with 252 houses in Hoensbroek.
6433HR Hoensbroek
€ 448.000 k.k.
€ 2.966/m²
6431GD Hoensbroek
€ 349.000 k.k.
€ 2.154/m²
6433BA Hoensbroek
€ 255.000 k.k.
€ 3.187/m²
6431JB Hoensbroek
€ 159.000 k.k.
€ 1.325/m²
6431HG Hoensbroek
€ 115.000 k.k.
€ 2.613/m²
6433DH Hoensbroek
€ 479.000 k.k.
€ 3.742/m²
6431HG Hoensbroek
€ 150.000 k.k.
€ 2.500/m²
6431VC Hoensbroek
€ 188.000 k.k.
€ 2.211/m²
6432GT Hoensbroek
€ 300.000 k.k.
€ 2.586/m²
6431JR Hoensbroek
€ 325.000 k.k.
€ 3.571/m²
6431BL Hoensbroek
€ 265.000 k.k.
€ 2.880/m²
6433EX Hoensbroek
€ 328.000 k.k.
€ 2.981/m²
6431KT Hoensbroek
€ 249.000 k.k.
€ 1.753/m²
6431WD Hoensbroek
€ 244.000 k.k.
€ 2.218/m²
6433LC Hoensbroek
€ 319.000 k.k.
€ 2.246/m²
6433GC Hoensbroek
Price upon request
6431EZ Hoensbroek
€ 839.000 k.k.
€ 3.496/m²
6433BA Hoensbroek
€ 209.000 k.k.
€ 3.215/m²
6431XV Hoensbroek
€ 225.000 k.k.
€ 1.956/m²
6433DA Hoensbroek
€ 409.000 k.k.
€ 3.272/m²
6432DK Hoensbroek
€ 385.000 k.k.
€ 2.319/m²
6432AK Hoensbroek
€ 298.000 k.k.
€ 3.040/m²
6432AJ Hoensbroek
€ 195.000 k.k.
€ 2.565/m²
6433GE Hoensbroek
€ 215.000 k.k.
€ 1.919/m²
6431LJ Hoensbroek
€ 139.000 k.k.
€ 1.985/m²
6433CZ Hoensbroek
€ 195.000 k.k.
€ 1.392/m²
6431BS Hoensbroek
€ 289.000 k.k.
€ 2.833/m²
6431EE Hoensbroek
€ 159.000 k.k.
€ 1.574/m²
Bekijk recente verkopen en ontvang gratis offertes van lokale verkoopmakelaars in Hoensbroek.
Zelf je woning verkopen in Hoensbroek? Vergelijk verkoopmakelaars in Hoensbroek of bekijk de beste verkoopmakelaars in Hoensbroek als referentie bij jouw keuze.
Makelaars maken scherpere voorstellen als ze weten dat je vergelijkt — vraag offertes aan voor verkoop of aankoop.
Short answers about housing prices, sold homes and comparing real estate agents in Hoensbroek.
The costs of a real estate agent in Hoensbroek vary per office, property type and sales approach. Therefore, compare multiple quotes and also look at the real estate agents in Hoensbroek to better compare rates, presentation and local experience.
On this page we currently show 179 sold houses in Hoensbroek from our selection. This helps you to better assess recent transactions and the local housing market.
Houses sold in Hoensbroek give insight into asking prices, house types and neighborhoods where recent transactions have taken place. Compare this also with the current housing stock in Hoensbroek to better understand the market.
You can use sold homes as a first market indication, but a local real estate agent can better take into account finishing, location, maintenance and current demand in Hoensbroek.
Vergelijk makelaars in Hoensbroek op lokale verkoopervaring, reviews, verwachte opbrengst, courtage en marketingaanpak. Bekijk verkoopmakelaars in Hoensbroek of de top 10 makelaars in Hoensbroek om snel sterke kantoren te ontdekken.
View current location data on residents, WOZ development, housing stock, energy consumption, business activity and safety in Hoensbroek. In 2026 were there 18.708 residents. The average WOZ value in 2025 is EUR 200.122.
These figures help to better assess and compare the housing stock in Hoensbroek with recent sold homes. Orient yourself then on suitable top real estate agents in Hoensbroek for sales advice in this region.
Residents
18.708
Last year: 2026
Average WOZ
EUR 200.122
Last year: 2025
Average income per person.
EUR 27.990
Source: AllNumbers
Crimes (current year)
1.004
Total registered
| Year | Residents |
|---|---|
| 2021 | 18.871 |
| 2022 | 18.826 |
| 2023 | 18.780 |
| 2024 | 18.786 |
| 2025 | 18.700 |
| 2026 | 18.708 |
| Year | Average WOZ |
|---|---|
| 2021 | EUR 151.559 |
| 2022 | EUR 160.700 |
| 2023 | EUR 190.615 |
| 2024 | EUR 185.886 |
| 2025 | EUR 200.122 |
Hoger
2.538
Praktisch
5.579
Middelbaar
5.993
Europa
2.885
Nederland
13.180
Buiten Europa
2.635
Label C
2.728
Label E
1.374
Label B
1.367
Label F
1.353
Label D
1.274
Label A
1.092
Label G
1.009
Label A+
62
Label A+++
48
Label A++++
28
Label A++
16
Label A+++++
2
| Year | Gas (m3) | Electricity (kWh) |
|---|---|---|
| 2020 | 1.173 | 2.668 |
| 2021 | 1.312 | 2.685 |
| 2022 | 1.026 | 2.586 |
| 2023 | 859 | 2.485 |
| 2024 | 833 | 2.535 |
Hoekwoning
Gas: 943 • Electricity: 2.778
Huurwoning
Gas: 778 • Electricity: 2.082
Koopwoning
Gas: 951 • Electricity: 2.936
Appartement
Gas: 710 • Electricity: 1.858
Tussenwoning
Gas: 816 • Electricity: 2.535
Vrijstaande woning
Gas: 1.372 • Electricity: 3.669
Twee-onder-één-kap woning
Gas: 1.050 • Electricity: 2.979
Total number of company establishments: 1.495
| Period | Crimes |
|---|---|
| jan 2026 | 85 |
| jul 2025 | 73 |
| jun 2025 | 84 |
| mei 2025 | 102 |
| mrt 2025 | 84 |
| mrt 2026 | 66 |
| nov 2024 | 76 |
| nov 2025 | 74 |
| okt 2024 | 73 |
| okt 2025 | 87 |
| sep 2024 | 64 |
| sep 2025 | 66 |
These figures give an indicative picture of safety trends in the living environment of Hoensbroek.
Short answers based on current local statistics, handy for a quick comparison of the living environment.
Hoensbroek telt in 2026 ongeveer 18.708 inwoners.
De gemiddelde WOZ-waarde in Hoensbroek is in 2025 circa € 200.122.
Het gemiddelde inkomen per inwoner in Hoensbroek ligt rond € 27.990 per jaar.
Voor het huidige jaar gaat het om ongeveer 1.004 geregistreerde misdrijven. Gebruik deze cijfers als indicatie en vergelijk trends per periode.
In Hoensbroek komt vooral "Tussenwoningen" veel voor, met ongeveer 3.477 woningen.