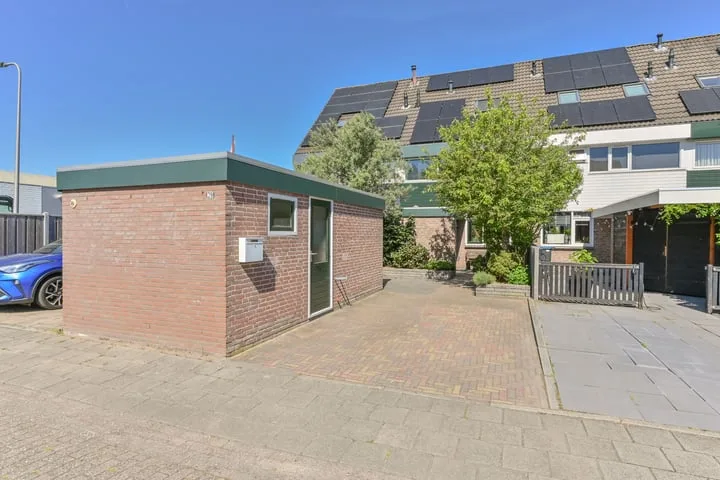
- Sold
Kalmoessingel 32
8265CR Kampen
€ 349.500 k.k.
€ 2.818/m²
- Living area
- 124 m²
- Land area
- 183 m²
- Bedrooms
- 4
View 386 sold houses in Kampen
Type to search. Use arrow down and arrow up to navigate through results and press Enter to open.
Hidden search suggestions.
Compare sold homes in Kampen or view the current offering in this location directly.
On this page you will find recently sold homes in Kampen. Use this overview to better estimate selling prices, popular neighborhoods, and the local housing supply before you choose a real estate agent. Also view the current housing supply with 512 houses in Kampen.
8265CR Kampen
€ 349.500 k.k.
€ 2.818/m²
8266KL Kampen
€ 449.500 k.k.
€ 3.942/m²
8261KN Kampen
€ 295.000 k.k.
€ 3.881/m²
8265GW Kampen
€ 375.000 k.k.
€ 3.537/m²
8264AE Kampen
€ 785.000 k.k.
€ 5.413/m²
8266BP Kampen
€ 325.000 k.k.
€ 3.125/m²
8262DR Kampen
€ 475.000 k.k.
€ 3.740/m²
8265EE Kampen
€ 365.000 k.k.
€ 3.041/m²
8265HT Kampen
€ 350.000 k.k.
€ 3.271/m²
8265GG Kampen
€ 215.000 k.k.
€ 4.673/m²
8265RR Kampen
€ 375.000 k.k.
€ 3.504/m²
8266BJ Kampen
€ 485.000 k.k.
€ 3.439/m²
8265TA Kampen
€ 565.000 k.k.
€ 3.363/m²
8266CN Kampen
€ 450.000 k.k.
€ 3.333/m²
8266LS Kampen
€ 575.000 k.k.
€ 3.833/m²
8265EB Kampen
€ 335.000 k.k.
€ 2.617/m²
8264DH Kampen
€ 600.000 k.k.
€ 4.545/m²
8261LB Kampen
€ 350.000 k.k.
€ 3.097/m²
8265HA Kampen
€ 439.000 k.k.
€ 2.582/m²
8265BX Kampen
€ 300.000 k.k.
€ 3.571/m²
8261AW Kampen
€ 285.000 k.k.
€ 2.908/m²
8261KE Kampen
€ 295.000 k.k.
€ 3.072/m²
Get free quotes from realtors with local market knowledge in Kampen.
Selling a home in Kampen? Compare real estate agents who know the local housing market. Also check out all real estate agents in Kampen or the top 10 real estate agents in Kampen for extra context for your choice.
By comparing brokers and requesting quotes
Short answers about housing prices, sold homes and comparing real estate agents in Kampen.
The costs of a real estate agent in Kampen vary per office, property type and sales approach. Therefore, compare multiple quotes and also look at the real estate agents in Kampen to better compare rates, presentation and local experience.
On this page we currently show 386 sold houses in Kampen from our selection. This helps you to better assess recent transactions and the local housing market.
Houses sold in Kampen give insight into asking prices, house types and neighborhoods where recent transactions have taken place. Compare this also with the current housing stock in Kampen to better understand the market.
You can use sold homes as a first market indication, but a local real estate agent can better take into account finishing, location, maintenance and current demand in Kampen.
Compare realtors in Kampen on local sales experience, reviews, expected yield, commission and marketing approach. The top 10 realtors in Kampen helps to quickly discover strong offices.
View current location data on residents, WOZ development, housing stock, energy consumption, business activity and safety in Kampen. In 2025 were there 38.830 residents. The average WOZ value in 2025 is EUR 333.000.
These figures help to better assess and compare the housing stock in Kampen with recent sold homes. Orient yourself then on suitable top real estate agents in Kampen for sales advice in this region.
Residents
38.830
Last year: 2025
Average WOZ
EUR 333.000
Last year: 2025
Average income per person.
EUR 30.300
Source: AllNumbers
Crimes (current year)
1.297
Total registered
| Year | Residents |
|---|---|
| 2021 | 37.816 |
| 2022 | 37.890 |
| 2023 | 38.415 |
| 2024 | 38.595 |
| 2025 | 38.830 |
| Year | Average WOZ |
|---|---|
| 2021 | EUR 229.000 |
| 2022 | EUR 252.000 |
| 2023 | EUR 288.000 |
| 2024 | EUR 310.000 |
| 2025 | EUR 333.000 |
Hoger
7.730
Praktisch
8.090
Middelbaar
12.740
Europa
1.755
Nederland
32.725
Buiten Europa
4.345
Label A
5.716
Label C
3.685
Label B
2.802
Label F
1.599
Label G
1.494
Label D
1.130
Label E
822
Label A+++
494
Label A+
335
Label A++++
189
Label A++
123
Label A+++++
11
| Year | Gas (m3) | Electricity (kWh) |
|---|---|---|
| 2020 | 1.120 | 2.540 |
| 2021 | 1.280 | 2.600 |
| 2022 | 1.000 | 2.450 |
| 2023 | 850 | 2.360 |
| 2024 | 820 | 2.410 |
Hoekwoning
Gas: 940 • Electricity: 2.530
Huurwoning
Gas: 720 • Electricity: 1.860
Koopwoning
Gas: 930 • Electricity: 2.710
Appartement
Gas: 650 • Electricity: 1.740
Tussenwoning
Gas: 850 • Electricity: 2.340
Vrijstaande woning
Gas: 1.290 • Electricity: 3.980
Twee-onder-één-kap woning
Gas: 990 • Electricity: 3.220
Total number of company establishments: 4.405
| Period | Crimes |
|---|---|
| jan 2025 | 118 |
| jan 2026 | 113 |
| jul 2025 | 106 |
| jun 2025 | 119 |
| mei 2025 | 113 |
| mrt 2025 | 95 |
| nov 2024 | 88 |
| nov 2025 | 95 |
| okt 2024 | 114 |
| okt 2025 | 128 |
| sep 2024 | 93 |
| sep 2025 | 116 |
These figures give an indicative picture of safety trends in the living environment of Kampen.
Short answers based on current local statistics, handy for a quick comparison of the living environment.
Kampen telt in 2025 ongeveer 38.830 inwoners.
De gemiddelde WOZ-waarde in Kampen is in 2025 circa € 333.000.
Het gemiddelde inkomen per inwoner in Kampen ligt rond € 30.300 per jaar.
Voor het huidige jaar gaat het om ongeveer 1.297 geregistreerde misdrijven. Gebruik deze cijfers als indicatie en vergelijk trends per periode.
In Kampen komt vooral "Tussenwoningen" veel voor, met ongeveer 7.245 woningen.