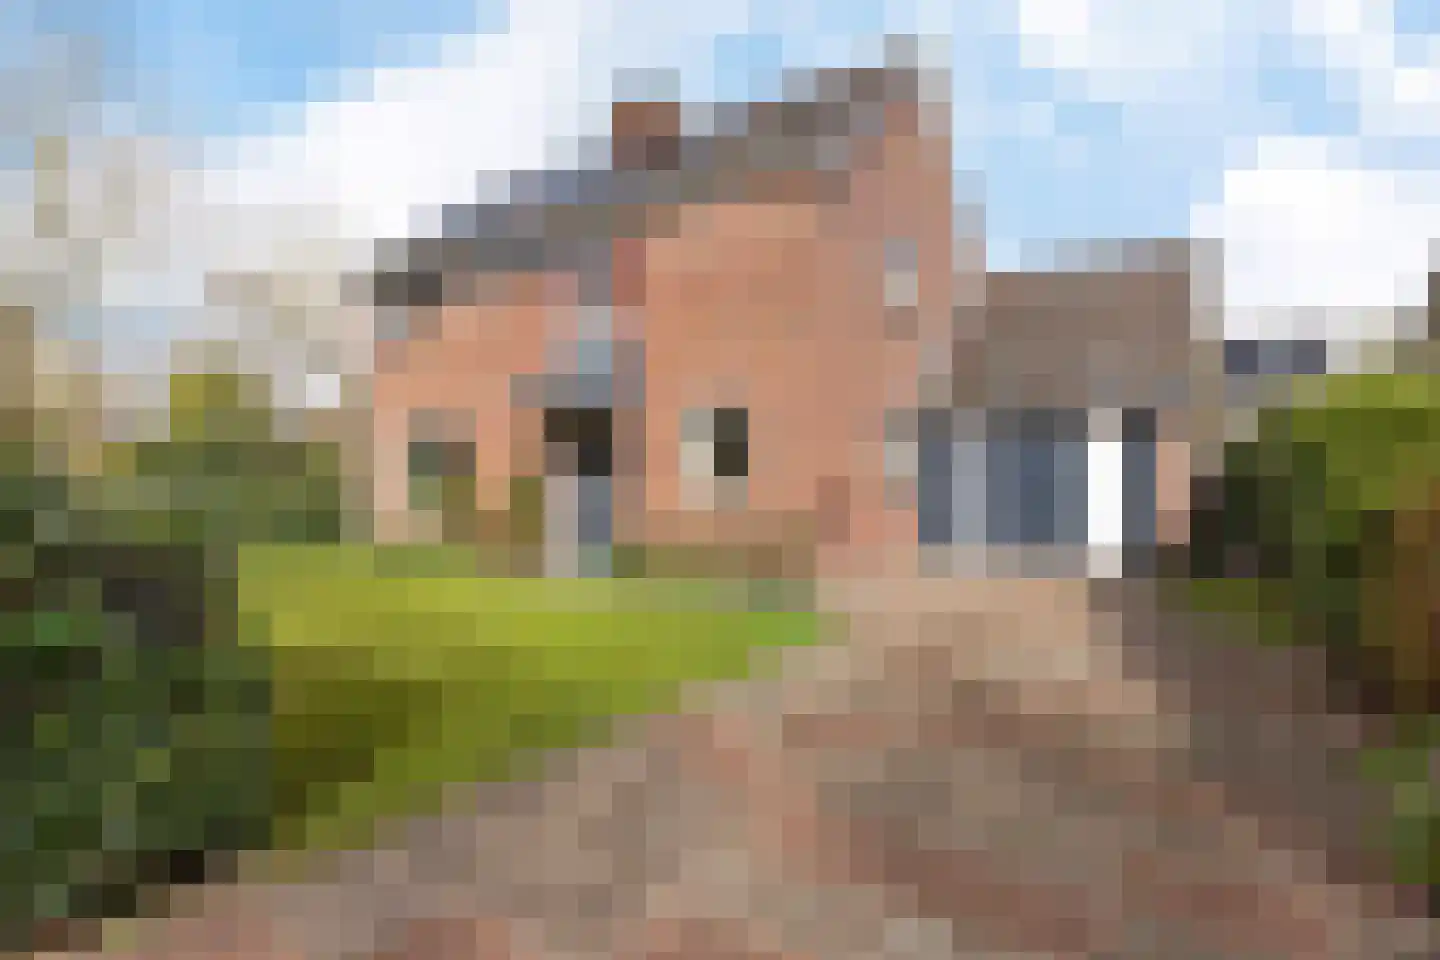
- Sold
Grietenij 94
9351JG Leek
€ 485.000 k.k.
€ 2.771/m²
- Living area
- 175 m²
- Land area
- 625 m²
- Bedrooms
- 6
View 108 sold houses in Leek
Type to search. Use arrow down and arrow up to navigate through results and press Enter to open.
Hidden search suggestions.
Compare sold homes in Leek or view the current offering in this location directly.
On this page you will find recently sold homes in Leek. Use this overview to better estimate selling prices, popular neighborhoods, and the local housing supply before you choose a real estate agent. Also view the current housing supply with 144 houses in Leek.
9351JG Leek
€ 485.000 k.k.
€ 2.771/m²
9351ZN Leek
€ 395.000 k.k.
€ 3.134/m²
9351ZK Leek
€ 595.000 k.k.
€ 3.500/m²
9351WD Leek
€ 899.000 k.k.
€ 4.067/m²
9351LP Leek
€ 419.000 k.k.
€ 2.909/m²
9351WK Leek
€ 585.000 k.k.
€ 3.750/m²
9351XN Leek
€ 550.000 k.k.
€ 3.437/m²
9351MP Leek
€ 400.000 k.k.
€ 2.500/m²
9351HX Leek
€ 289.000 k.k.
€ 2.603/m²
9351CR Leek
€ 325.000 k.k.
€ 2.642/m²
9351LG Leek
€ 350.000 k.k.
€ 2.651/m²
9351ES Leek
€ 599.000 k.k.
€ 4.830/m²
9351EJ Leek
€ 385.000 k.k.
€ 3.774/m²
9351AK Leek
€ 475.000 k.k.
€ 3.991/m²
9351RR Leek
€ 325.000 k.k.
€ 2.559/m²
9351XB Leek
€ 529.000 k.k.
€ 3.412/m²
9351GB Leek
€ 319.500 k.k.
€ 3.758/m²
9351XB Leek
€ 535.000 k.k.
€ 3.474/m²
9351PP Leek
€ 795.000 k.k.
€ 4.251/m²
9351SR Leek
€ 400.000 k.k.
€ 2.777/m²
9351ZM Leek
€ 587.500 k.k.
€ 3.649/m²
9351AV Leek
€ 315.000 k.k.
€ 2.142/m²
9351PM Leek
€ 849.500 k.k.
€ 4.591/m²
9351GB Leek
€ 275.000 k.k.
€ 3.235/m²
9351AW Leek
€ 269.000 k.k.
€ 3.842/m²
9351GK Leek
€ 359.000 k.k.
€ 2.849/m²
9351XB Leek
€ 675.000 k.k.
€ 4.411/m²
9351RL Leek
€ 410.000 k.k.
€ 2.697/m²
Get free quotes from realtors with local market knowledge in Leek.
Selling a home in Leek? Compare real estate agents who know the local housing market. Also check out all real estate agents in Leek or the top 10 real estate agents in Leek for extra context for your choice.
By comparing brokers and requesting quotes
Short answers about housing prices, sold homes and comparing real estate agents in Leek.
The costs of a real estate agent in Leek vary per office, property type and sales approach. Therefore, compare multiple quotes and also look at the real estate agents in Leek to better compare rates, presentation and local experience.
On this page we currently show 108 sold houses in Leek from our selection. This helps you to better assess recent transactions and the local housing market.
Houses sold in Leek give insight into asking prices, house types and neighborhoods where recent transactions have taken place. Compare this also with the current housing stock in Leek to better understand the market.
You can use sold homes as a first market indication, but a local real estate agent can better take into account finishing, location, maintenance and current demand in Leek.
Compare realtors in Leek on local sales experience, reviews, expected yield, commission and marketing approach. The top 10 realtors in Leek helps to quickly discover strong offices.
View current location data on residents, WOZ development, housing stock, energy consumption, business activity and safety in Leek. In 2025 were there 12.413 residents. The average WOZ value in 2025 is EUR 323.383.
These figures help to better assess and compare the housing stock in Leek with recent sold homes. Orient yourself then on suitable top real estate agents in Leek for sales advice in this region.
Residents
12.413
Last year: 2025
Average WOZ
EUR 323.383
Last year: 2025
Average income per person.
EUR 25.860
Source: AllNumbers
Crimes (current year)
340
Total registered
| Year | Residents |
|---|---|
| 2021 | 11.753 |
| 2022 | 11.973 |
| 2023 | 12.153 |
| 2024 | 12.359 |
| 2025 | 12.413 |
| Year | Average WOZ |
|---|---|
| 2021 | EUR 232.030 |
| 2022 | EUR 252.982 |
| 2023 | EUR 295.507 |
| 2024 | EUR 291.897 |
| 2025 | EUR 323.383 |
Hoger
2.462
Praktisch
2.039
Middelbaar
3.666
Europa
649
Nederland
10.706
Buiten Europa
1.049
Label A
1.816
Label C
1.205
Label B
738
Label D
672
Label A+++
312
Label F
211
Label E
201
Label A++++
157
Label G
141
Label A+
129
Label A++
90
Label A+++++
2
| Year | Gas (m3) | Electricity (kWh) |
|---|---|---|
| 2020 | 1.350 | 2.762 |
| 2021 | 1.487 | 2.819 |
| 2022 | 1.128 | 2.636 |
| 2023 | 934 | 2.579 |
| 2024 | 887 | 2.707 |
Hoekwoning
Gas: 910 • Electricity: 2.384
Huurwoning
Gas: 764 • Electricity: 2.073
Koopwoning
Gas: 1.013 • Electricity: 2.802
Appartement
Gas: 521 • Electricity: 1.276
Tussenwoning
Gas: 795 • Electricity: 2.047
Vrijstaande woning
Gas: 1.207 • Electricity: 3.486
Twee-onder-één-kap woning
Gas: 992 • Electricity: 2.548
Total number of company establishments: 1.493
| Period | Crimes |
|---|---|
| jan 2025 | 27 |
| jan 2026 | 42 |
| jul 2025 | 25 |
| jun 2025 | 43 |
| mei 2025 | 28 |
| mrt 2025 | 27 |
| nov 2024 | 32 |
| nov 2025 | 33 |
| okt 2024 | 34 |
| okt 2025 | 36 |
| sep 2024 | 17 |
| sep 2025 | 22 |
These figures give an indicative picture of safety trends in the living environment of Leek.
Short answers based on current local statistics, handy for a quick comparison of the living environment.
Leek telt in 2025 ongeveer 12.413 inwoners.
De gemiddelde WOZ-waarde in Leek is in 2025 circa € 323.383.
Het gemiddelde inkomen per inwoner in Leek ligt rond € 25.860 per jaar.
Voor het huidige jaar gaat het om ongeveer 340 geregistreerde misdrijven. Gebruik deze cijfers als indicatie en vergelijk trends per periode.
In Leek komt vooral "Tussenwoningen" veel voor, met ongeveer 1.629 woningen.