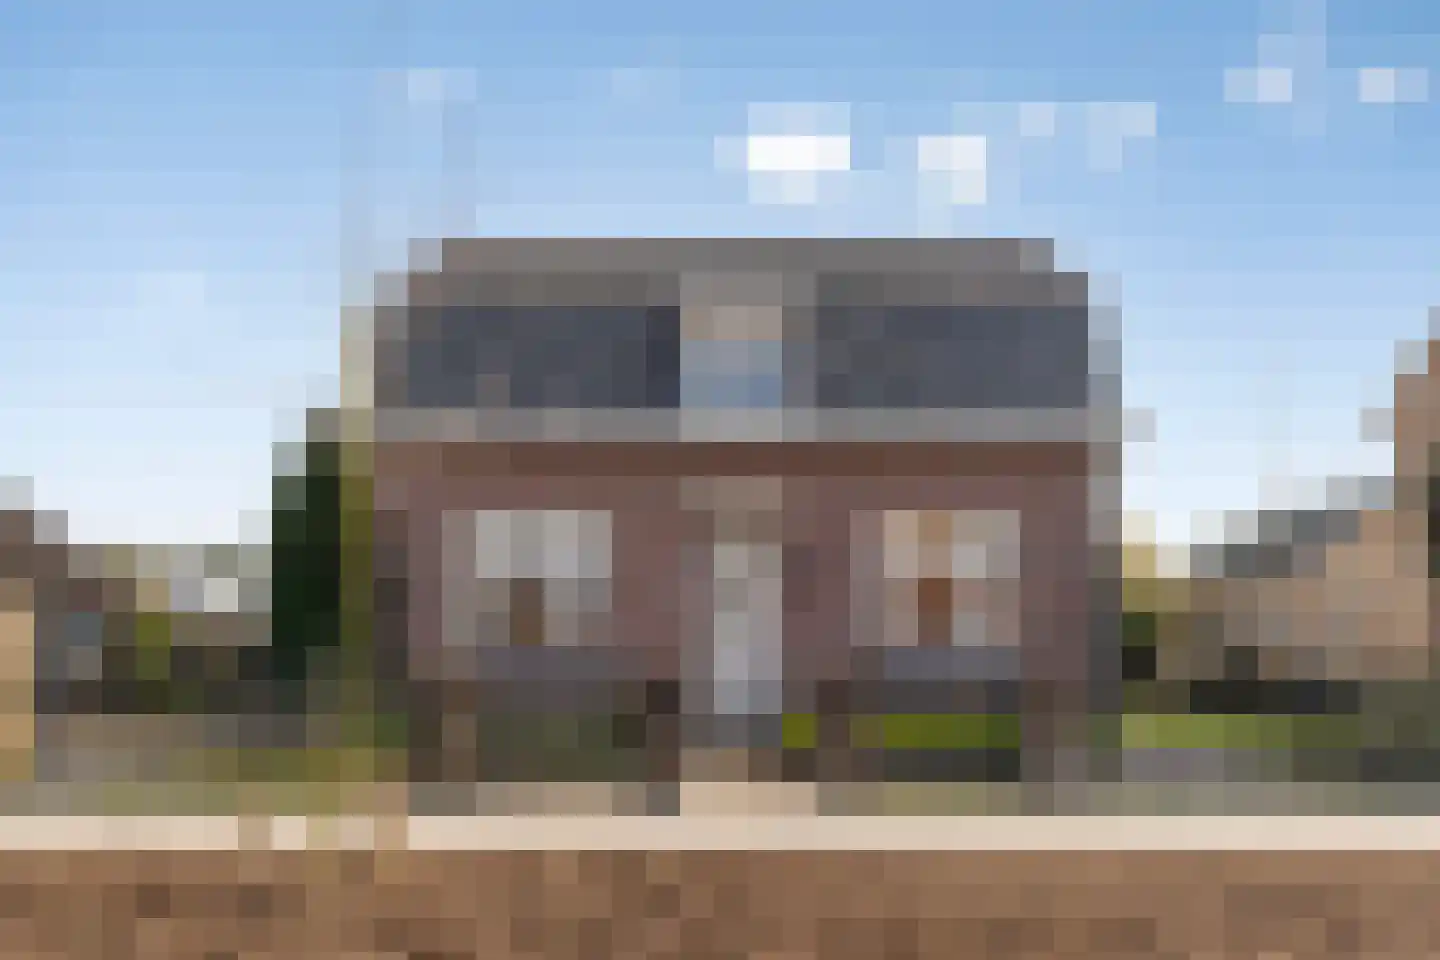
Houses sold in Leunen

View 12 sold houses in Leunen

Connected to: Vastgoed Nederland NVM Makelaars

On this page you will find recently sold homes in Leunen. Use this overview to better estimate selling prices, popular neighborhoods, and the local housing supply before you choose a real estate agent. Also view the current housing supply with 20 houses in Leunen.

Selection

Search and filter homes

Set your preferences and discover homes that suit you.

Total supply 241.423
Filters

Set price, area and other characteristics. Adjust a filter or click on Show homes. Location changes directly above.

Reset filters

You search for

  • Place Leunen
  • Status Sold

Huis verkopen in Leunen? Vergelijk verkoopmakelaars

Bekijk recente verkopen en ontvang gratis offertes van lokale verkoopmakelaars in Leunen.

Free request a quote

  • Quotes in Leunen
  • Non-binding
  • Personal
  • Gratis tarieven vergelijken

Zelf je woning verkopen in Leunen? Vergelijk verkoopmakelaars in Leunen of bekijk de beste verkoopmakelaars in Leunen als referentie bij jouw keuze.

Vergelijk meerdere offertes

Makelaars maken scherpere voorstellen als ze weten dat je vergelijkt — vraag offertes aan voor verkoop of aankoop.

Frequently asked questions about sold homes in Leunen

Short answers about housing prices, sold homes and comparing real estate agents in Leunen.

Residential and neighborhood statistics in Leunen

View current location data on residents, WOZ development, housing stock, energy consumption, business activity and safety in Leunen. In 2025 were there 2.205 residents. The average WOZ value in 2025 is EUR 411.000.

These figures help to better assess and compare the housing stock in Leunen with recent sold homes. Orient yourself then on suitable top real estate agents in Leunen for sales advice in this region.

Residents

2.205

Last year: 2025

Average WOZ

EUR 411.000

Last year: 2025

Average income per person.

EUR 32.800

Source: AllNumbers

Crimes (current year)

60

Total registered

Demographics and WOZ development

Inhabitants per year

Inhabitants per year in Leunen
Year Residents
2021 2.270
2022 2.235
2023 2.250
2024 2.215
2025 2.205

Annual WOZ value

WOZ value per year in Leunen
Year Average WOZ
2021 EUR 308.000
2022 EUR 327.000
2023 EUR 369.000
2024 EUR 380.000
2025 EUR 411.000

Composition of residents

Age build-up

65+: 495 0-15: 365 15-25: 230 25-45: 465 45-65: 650

Education level

Hoger

470

Praktisch

430

Middelbaar

820

Origin of residents (2025)

Europa

140

Nederland

1.975

Buiten Europa

85

Housing stock and construction periods

Types of homes

Hoekwoningen 124
Appartementen 4
Tussenwoningen 224
Vrijstaande woningen 370
Twee-onder-één-kap woningen 202

Construction period of buildings

Voor 1700 0
1700 tot 1900 29
1900 tot 1925 31
1925 tot 1950 75
1950 tot 1970 223
1970 tot 1980 196
1980 tot 1990 162
1990 tot 2000 47
2000 tot 2010 109
2010 tot 2020 66
2020 en later 50

Energy and sustainability

Energy label distribution

Label C

232

Label A

212

Label D

127

Label B

125

Label F

77

Label G

75

Label E

31

Label A+

7

Label A++

5

Label A+++

5

Label A++++

1

Label A+++++

0

Average energy consumption per year

Average energy consumption per year in Leunen
Year Gas (m3) Electricity (kWh)
2020 1.570 3.710
2021 1.770 3.780
2022 1.390 3.480
2023 1.140 3.370
2024 1.110 3.440

Consumption per house type

Hoekwoning

Gas: 960 • Electricity: 2.710

Huurwoning

Gas: 960 • Electricity: 2.320

Koopwoning

Gas: 1.180 • Electricity: 3.570

Appartement

Gas: 990 • Electricity: 4.420

Tussenwoning

Gas: 910 • Electricity: 2.630

Vrijstaande woning

Gas: 1.400 • Electricity: 4.180

Twee-onder-één-kap woning

Gas: 1.030 • Electricity: 3.000

Business activity in Leunen (2025)

Handel en HORECA 35
Nijverheid en energie 35
Zakelijke dienstverlening 55
Overheid, onderwijs en zorg 40
Landbouw, bosbouw en visserij 40
Vervoer, informatie en communicatie 10
Financiele diensten en onroerendgoed 10
Cultuur, recreatie en overige diensten 25

Total number of company establishments: 260

Recent crime statistics

Recent crime statistics in Leunen
Period Crimes
jan 2025 5
jan 2026 4
jul 2025 4
jun 2025 2
mei 2025 6
mrt 2025 4
nov 2024 6
nov 2025 12
okt 2024 3
okt 2025 9
sep 2024 3
sep 2025 5

These figures give an indicative picture of safety trends in the living environment of Leunen.

Frequently asked questions about living in Leunen

Short answers based on current local statistics, handy for a quick comparison of the living environment.

Hoeveel inwoners heeft Leunen?

Leunen telt in 2025 ongeveer 2.205 inwoners.

Wat is de gemiddelde WOZ-waarde in Leunen?

De gemiddelde WOZ-waarde in Leunen is in 2025 circa € 411.000.

Wat is het gemiddelde inkomen per inwoner in Leunen?

Het gemiddelde inkomen per inwoner in Leunen ligt rond € 32.800 per jaar.

Hoe veilig is wonen in Leunen?

Voor het huidige jaar gaat het om ongeveer 60 geregistreerde misdrijven. Gebruik deze cijfers als indicatie en vergelijk trends per periode.

Welke woningtypen komen het meest voor in Leunen?

In Leunen komt vooral "Vrijstaande woningen" veel voor, met ongeveer 370 woningen.

Gratis vrijblijvende offertes ontvangen

Vergelijk meerdere makelaars en kies de beste match.