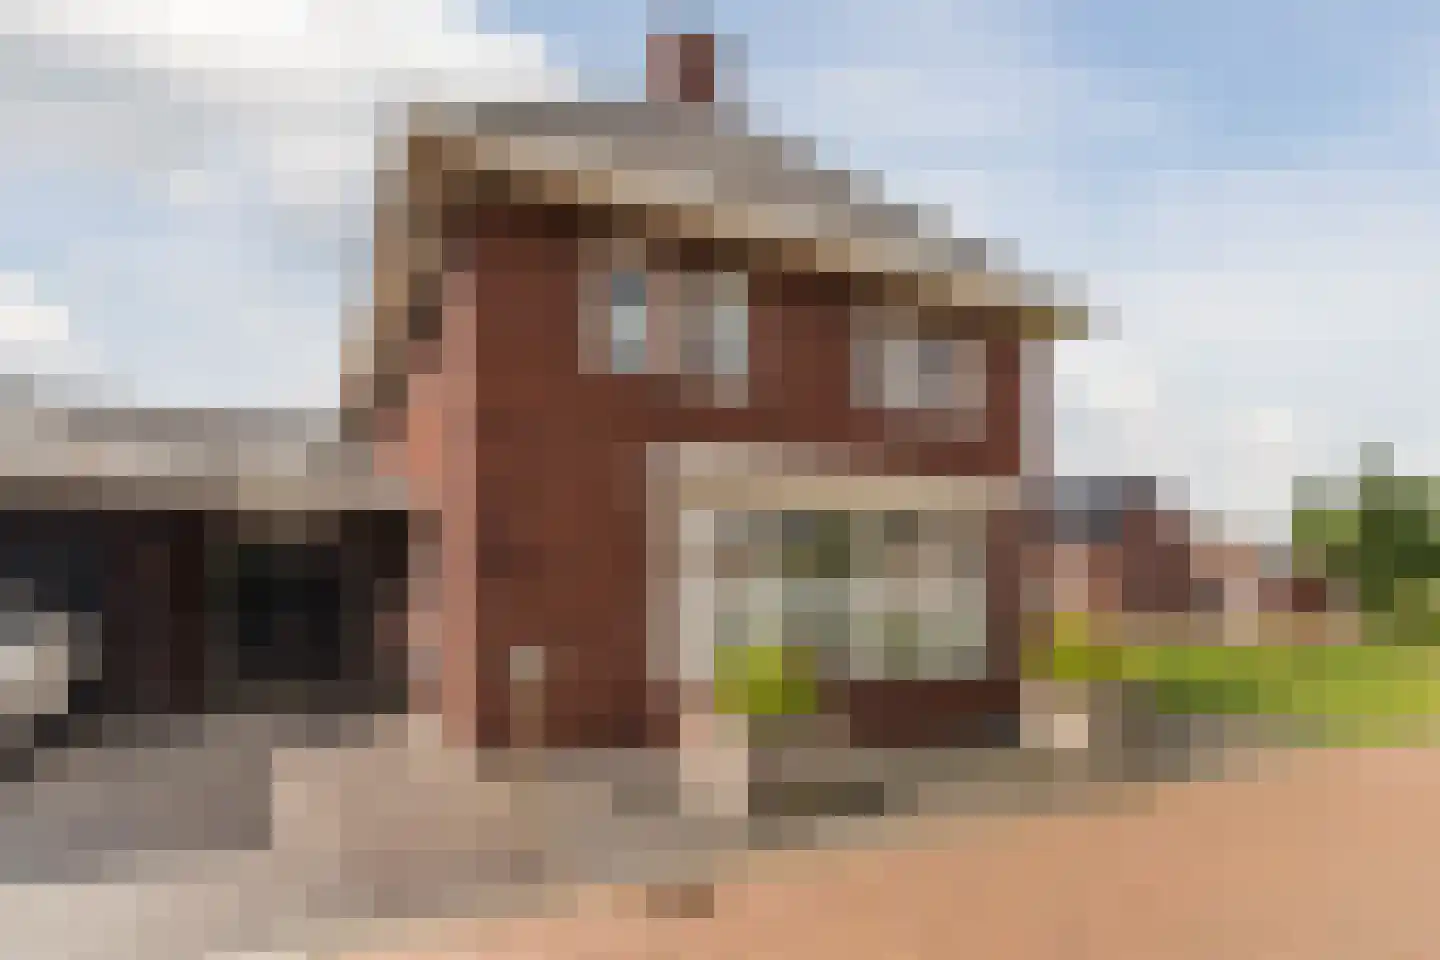
- Available
Molenhoeven 17
5472PX Loosbroek
€ 465.000 k.k.
€ 3.394/m²
- Living area
- 137 m²
- Land area
- 264 m²
- Bedrooms
- 3
Searching in 14 houses in Loosbroek
Type to search. Use arrow down and arrow up to navigate through results and press Enter to open.
Hidden search suggestions.
View current properties in Loosbroek or search targeted on street, postal code and property characteristics.
View the current housing stock in Loosbroek and quickly filter by price, living area, rooms and more. There are currently 14 houses in this place within our selection. View also 10 sold houses in Loosbroek for extra insight into the local housing market.
5472PX Loosbroek
€ 465.000 k.k.
€ 3.394/m²
5472RJ Loosbroek
€ 795.000 k.k.
€ 3.681/m²
5472PE Loosbroek
€ 950.000 k.k.
€ 4.077/m²
5472PZ Loosbroek
€ 475.000 k.k.
€ 3.393/m²
5472PD Loosbroek
€ 650.000 k.k.
€ 4.221/m²
5472RG Loosbroek
€ 749.000 k.k.
€ 3.467/m²
5471NA Loosbroek
€ 625.000 k.k.
€ 3.415/m²
5472RG Loosbroek
€ 449.000 k.k.
€ 3.805/m²
5472PK Loosbroek
€ 575.000 k.k.
€ 3.549/m²
5472PG Loosbroek
€ 649.000 k.k.
€ 4.570/m²
5472PJ Loosbroek
€ 625.000 k.k.
€ 2.582/m²
5472PK Loosbroek
€ 395.000 k.k.
€ 3.761/m²
5472PE Loosbroek
€ 515.000 k.k.
€ 2.959/m²
5472PK Loosbroek
€ 425.000 k.k.
€ 3.571/m²
Get free quotes from real estate agents with local market knowledge. Compare more than 56 real estate agents in Loosbroek.
Selling a home in Loosbroek? Compare all real estate agents in Loosbroek or view the top 10 real estate agents in Loosbroek for extra context for your choice.
Real estate agents make sharper offers when they know you're comparing — ask for quotes for sale or purchase.
Practical answers about housing supply, sales and comparing real estate agents in Loosbroek.
The costs of a real estate agent in Loosbroek depend on commission, setup costs, property presentation and the chosen service. Compare the 56 real estate agents in Loosbroek via the real estate agent page and request multiple quotes to compare rates and approach well.
Within our selection, we are currently showing 14 houses in Loosbroek. View also the sold houses in Loosbroek to compare the current offering with recent transactions.
Take into account not only price and living area but also maintenance, energy label, location, outdoor space and sales status. This way you compare houses in Loosbroek on more than just the asking price.
A local real estate agent knows the neighborhoods, recent transactions and demand in Loosbroek. By comparing 56 real estate agents in the region you get a better insight into prices, sales strategy and expected yield; the top 10 in Loosbroek provides a useful starting point.
Yes, when making a sales plan, a valuation in Loosbroek is wise. You gain insight into a realistic asking price and can then compare offers from real estate agents specifically.
View current location data on residents, WOZ development, housing stock, energy consumption, business activity and safety in Loosbroek. In 2025 were there 1.325 residents. The average WOZ value in 2025 is EUR 528.076.
These figures help to better assess and compare the housing stock in Loosbroek with recent sold homes. Orient yourself then on suitable top real estate agents in Loosbroek for sales advice in this region.
Residents
1.325
Last year: 2025
Average WOZ
EUR 528.076
Last year: 2025
Average income per person.
EUR 30.908
Source: AllNumbers
Crimes (current year)
28
Total registered
| Year | Residents |
|---|---|
| 2021 | 1.317 |
| 2022 | 1.313 |
| 2023 | 1.323 |
| 2024 | 1.324 |
| 2025 | 1.325 |
| Year | Average WOZ |
|---|---|
| 2021 | EUR 373.854 |
| 2022 | EUR 412.363 |
| 2023 | EUR 477.542 |
| 2024 | EUR 503.600 |
| 2025 | EUR 528.076 |
Hoger
228
Praktisch
295
Middelbaar
440
Europa
59
Nederland
1.228
Buiten Europa
27
Label A
130
Label C
87
Label B
74
Label D
65
Label G
48
Label F
22
Label E
15
Label A+++
11
Label A++
6
Label A+
5
Label A++++
1
Label A+++++
0
| Year | Gas (m3) | Electricity (kWh) |
|---|---|---|
| 2020 | 1.568 | 3.917 |
| 2021 | 1.834 | 4.189 |
| 2022 | 1.414 | 3.993 |
| 2023 | 1.152 | 3.816 |
| 2024 | 1.127 | 3.724 |
Hoekwoning
Gas: 673 • Electricity: 2.210
Huurwoning
Gas: 1.148 • Electricity: 3.108
Koopwoning
Gas: 1.156 • Electricity: 3.928
Appartement
Gas: 1.175 • Electricity: 3.333
Tussenwoning
Gas: 539 • Electricity: 1.783
Vrijstaande woning
Gas: 1.286 • Electricity: 4.273
Twee-onder-één-kap woning
Gas: 981 • Electricity: 3.303
Total number of company establishments: 255
| Period | Crimes |
|---|---|
| jan 2025 | 3 |
| jan 2026 | 1 |
| jul 2025 | 2 |
| jun 2025 | 0 |
| mei 2025 | 2 |
| mrt 2025 | 2 |
| nov 2024 | 3 |
| nov 2025 | 3 |
| okt 2024 | 4 |
| okt 2025 | 4 |
| sep 2024 | 1 |
| sep 2025 | 2 |
These figures give an indicative picture of safety trends in the living environment of Loosbroek.
Short answers based on current local statistics, handy for a quick comparison of the living environment.
Loosbroek telt in 2025 ongeveer 1.325 inwoners.
De gemiddelde WOZ-waarde in Loosbroek is in 2025 circa € 528.076.
Het gemiddelde inkomen per inwoner in Loosbroek ligt rond € 30.908 per jaar.
Voor het huidige jaar gaat het om ongeveer 28 geregistreerde misdrijven. Gebruik deze cijfers als indicatie en vergelijk trends per periode.
In Loosbroek komt vooral "Vrijstaande woningen" veel voor, met ongeveer 292 woningen.