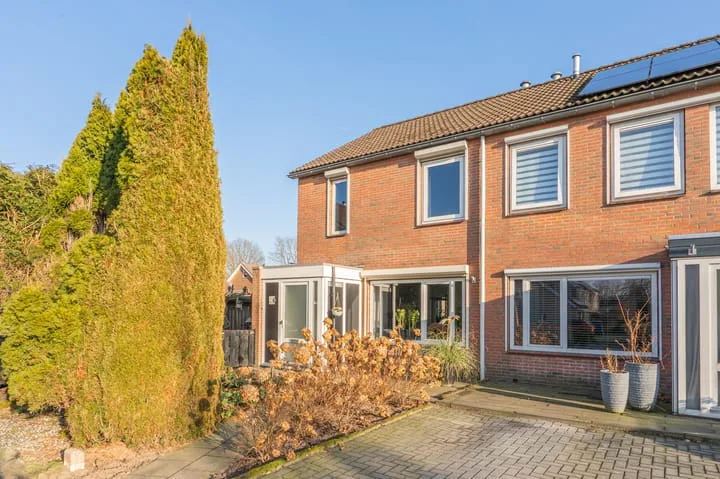
- Sold
Zonnedauw 9
7918AT Nieuwlande
€ 329.500 k.k.
€ 2.968/m²
- Living area
- 111 m²
- Land area
- 315 m²
- Bedrooms
- 4
View 6 sold houses in Nieuwlande
Type to search. Use arrow down and arrow up to navigate through results and press Enter to open.
Hidden search suggestions.
Compare sold homes in Nieuwlande or view the current offering in this location directly.
On this page you will find recently sold homes in Nieuwlande. Use this overview to better estimate selling prices, popular neighborhoods, and the local housing supply before you choose a real estate agent. Also view the current housing supply with 9 houses in Nieuwlande.
7918AT Nieuwlande
€ 329.500 k.k.
€ 2.968/m²
7918AK Nieuwlande
€ 375.000 k.k.
€ 2.551/m²
7918TB Nieuwlande
€ 300.000 k.k.
€ 1.863/m²
7918TH Nieuwlande
€ 674.500 k.k.
€ 3.181/m²
7918TM Nieuwlande
€ 535.000 k.k.
€ 3.128/m²
7918TR Nieuwlande
€ 450.000 k.k.
€ 4.054/m²
View recent sales and receive free quotes from local real estate agents. Compare more than 15 real estate agents in Nieuwlande.
Selling your own home in Nieuwlande? Compare real estate agents in Nieuwlande or view the best real estate agents in Nieuwlande as a reference for your choice.
Real estate agents make sharper offers when they know you're comparing — ask for quotes for sale or purchase.
Short answers about housing prices, sold homes and comparing real estate agents in Nieuwlande.
The costs of a real estate agent in Nieuwlande vary per office, property type and sales approach. In Nieuwlande you can compare 15 real estate agents; therefore also look at the real estate agents in Nieuwlande to better compare fees, presentation and local experience.
On this page we currently show 6 sold houses in Nieuwlande from our selection. This helps you to better assess recent transactions and the local housing market.
Houses sold in Nieuwlande give insight into asking prices, house types and neighborhoods where recent transactions have taken place. Compare this also with the current housing stock in Nieuwlande to better understand the market.
You can use sold homes as a first market indication, but a local real estate agent can better take into account finishing, location, maintenance and current demand in Nieuwlande.
Compare the 15 real estate agents in Nieuwlande on local sales experience, reviews, expected yield, commission and marketing approach. View real estate agents in Nieuwlande or the top 10 agents in Nieuwlande to quickly discover strong offices.
View current location data on residents, WOZ development, housing stock, energy consumption, business activity and safety in Nieuwlande. In 2026 were there 1.428 residents. The average WOZ value in 2025 is EUR 337.000.
These figures help to better assess and compare the housing stock in Nieuwlande with recent sold homes. Orient yourself then on suitable top real estate agents in Nieuwlande for sales advice in this region.
Residents
1.428
Last year: 2026
Average WOZ
EUR 337.000
Last year: 2025
Average income per person.
EUR 27.800
Source: AllNumbers
Crimes (current year)
7
Total registered
| Year | Residents |
|---|---|
| 2021 | 1.370 |
| 2022 | 1.405 |
| 2023 | 1.420 |
| 2024 | 1.415 |
| 2025 | 1.425 |
| 2026 | 1.428 |
| Year | Average WOZ |
|---|---|
| 2021 | EUR 237.000 |
| 2022 | EUR 259.000 |
| 2023 | EUR 300.000 |
| 2024 | EUR 320.000 |
| 2025 | EUR 337.000 |
Hoger
230
Praktisch
290
Middelbaar
540
Europa
40
Nederland
1.345
Buiten Europa
40
Label C
128
Label A
125
Label G
73
Label B
65
Label F
64
Label D
48
Label A+++
18
Label E
12
Label A++++
4
Label A+
3
Label A++
1
Label A+++++
0
| Year | Gas (m3) | Electricity (kWh) |
|---|---|---|
| 2020 | 1.640 | 3.350 |
| 2021 | 1.830 | 3.480 |
| 2022 | 1.400 | 3.360 |
| 2023 | 1.120 | 3.210 |
| 2024 | 1.090 | 3.360 |
Hoekwoning
Gas: 920 • Electricity: 2.620
Huurwoning
Gas: 950 • Electricity: 2.100
Koopwoning
Gas: 1.150 • Electricity: 3.420
Appartement
Gas: 1.000 • Electricity: 2.070
Tussenwoning
Gas: 900 • Electricity: 2.300
Vrijstaande woning
Gas: 1.250 • Electricity: 3.870
Twee-onder-één-kap woning
Gas: 1.060 • Electricity: 2.730
Total number of company establishments: 150
| Period | Crimes |
|---|---|
| jan 2026 | 0 |
| jul 2025 | 0 |
| jun 2025 | 2 |
| mei 2025 | 0 |
| mrt 2025 | 1 |
| mrt 2026 | 2 |
| nov 2024 | 2 |
| nov 2025 | 0 |
| okt 2024 | 1 |
| okt 2025 | 1 |
| sep 2024 | 1 |
| sep 2025 | 1 |
These figures give an indicative picture of safety trends in the living environment of Nieuwlande.
Short answers based on current local statistics, handy for a quick comparison of the living environment.
Nieuwlande telt in 2026 ongeveer 1.428 inwoners.
De gemiddelde WOZ-waarde in Nieuwlande is in 2025 circa € 337.000.
Het gemiddelde inkomen per inwoner in Nieuwlande ligt rond € 27.800 per jaar.
Voor het huidige jaar gaat het om ongeveer 7 geregistreerde misdrijven. Gebruik deze cijfers als indicatie en vergelijk trends per periode.
In Nieuwlande komt vooral "Vrijstaande woningen" veel voor, met ongeveer 299 woningen.