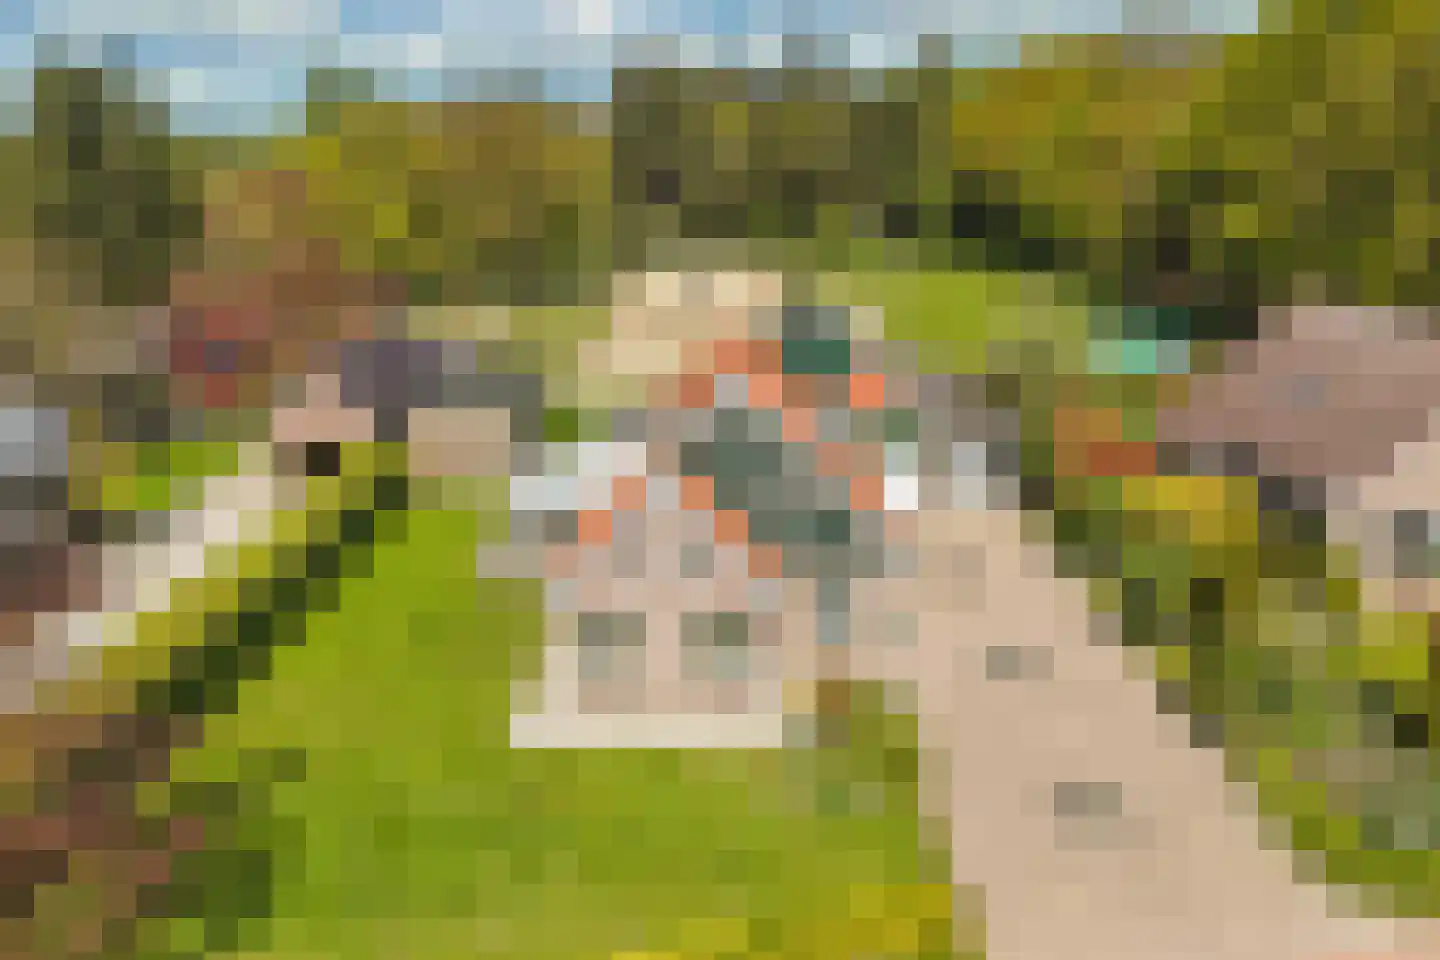
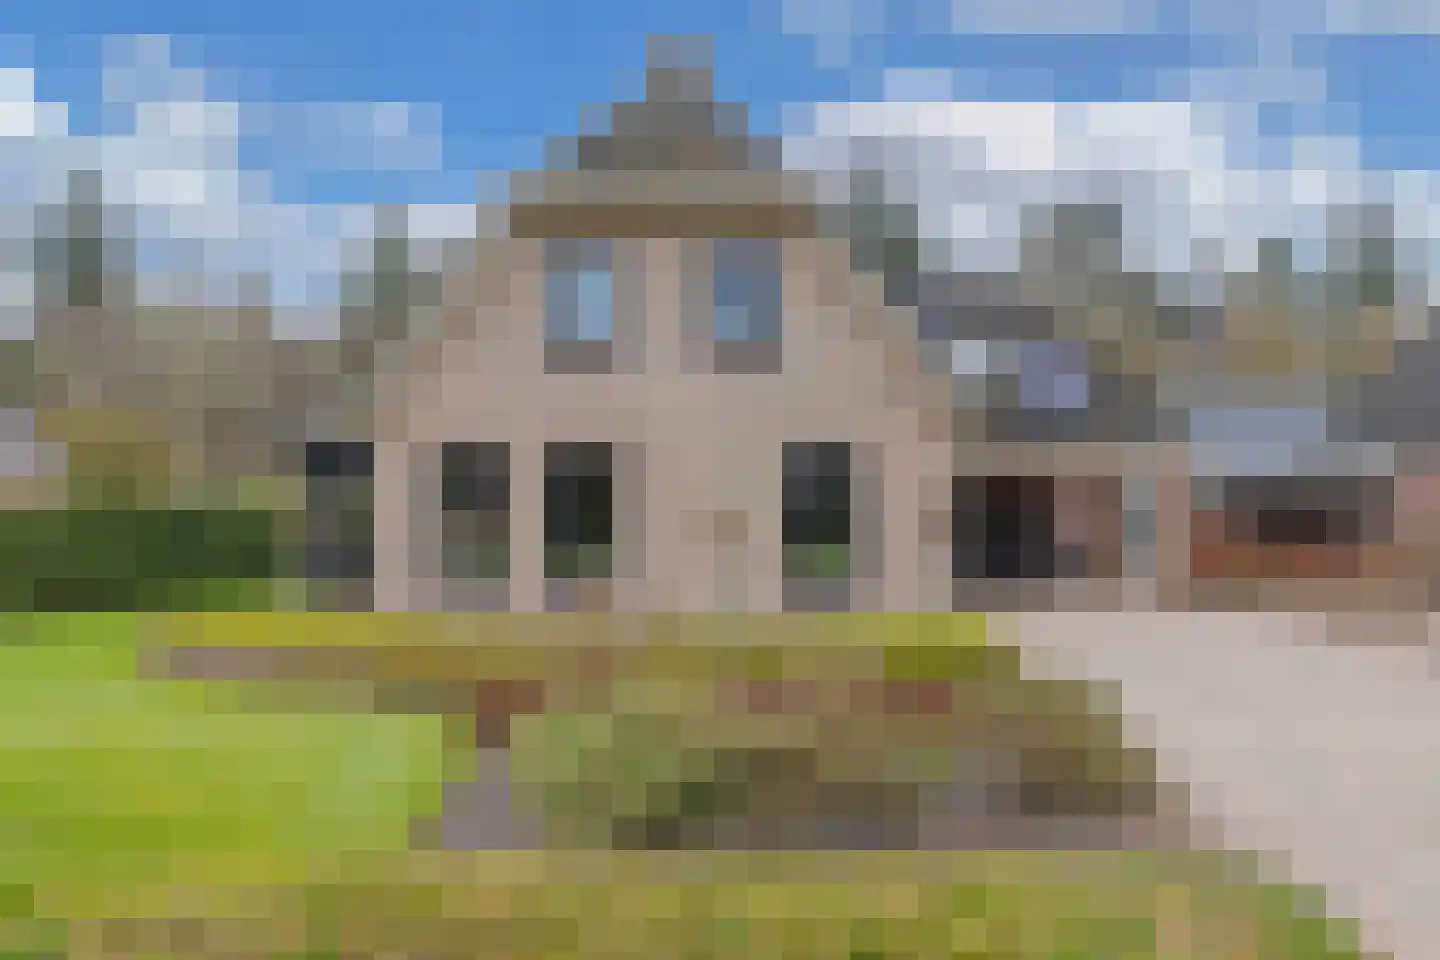
- Available
Binnenweg 9
8475EE Nijeholtpade
€ 925.000 k.k.
€ 6.469/m²
- Living area
- 143 m²
- Land area
- 13480 m²
- Bedrooms
- 4
Searching in 9 houses in Nijeholtpade
Type to search. Use arrow down and arrow up to navigate through results and press Enter to open.
Hidden search suggestions.
View current properties in Nijeholtpade or search targeted on street, postal code and property characteristics.
View the current housing stock in Nijeholtpade and quickly filter by price, living area, rooms and more. There are currently 9 houses in this place within our selection. View also 5 sold houses in Nijeholtpade for extra insight into the local housing market.
8475EE Nijeholtpade
€ 925.000 k.k.
€ 6.469/m²
8475CG Nijeholtpade
€ 750.000 k.k.
€ 6.198/m²
8475EC Nijeholtpade
€ 654.321 k.k.
€ 5.948/m²
8475EE Nijeholtpade
€ 725.000 k.k.
8475CE Nijeholtpade
€ 679.000 k.k.
€ 3.429/m²
8475CB Nijeholtpade
€ 475.000 k.k.
€ 3.598/m²
8475CD Nijeholtpade
€ 369.000 k.k.
€ 3.294/m²
8475CE Nijeholtpade
€ 475.000 k.k.
€ 2.950/m²
8475EG Nijeholtpade
€ 395.000 k.k.
€ 2.762/m²
Get free quotes from real estate agents with local market knowledge. Compare more than 17 real estate agents in Nijeholtpade.
Selling a home in Nijeholtpade? Compare all real estate agents in Nijeholtpade or view the top 10 real estate agents in Nijeholtpade for extra context for your choice.
Real estate agents make sharper offers when they know you're comparing — ask for quotes for sale or purchase.
Practical answers about housing supply, sales and comparing real estate agents in Nijeholtpade.
The costs of a real estate agent in Nijeholtpade depend on commission, setup costs, property presentation and the chosen service. Compare the 17 real estate agents in Nijeholtpade via the real estate agent page and request multiple quotes to compare rates and approach well.
Within our selection, we are currently showing 9 houses in Nijeholtpade. View also the sold houses in Nijeholtpade to compare the current offering with recent transactions.
Take into account not only price and living area but also maintenance, energy label, location, outdoor space and sales status. This way you compare houses in Nijeholtpade on more than just the asking price.
A local real estate agent knows the neighborhoods, recent transactions and demand in Nijeholtpade. By comparing 17 real estate agents in the region you get a better insight into prices, sales strategy and expected yield; the top 10 in Nijeholtpade provides a useful starting point.
Yes, when making a sales plan, a valuation in Nijeholtpade is wise. You gain insight into a realistic asking price and can then compare offers from real estate agents specifically.
View current location data on residents, WOZ development, housing stock, energy consumption, business activity and safety in Nijeholtpade. In 2026 were there 518 residents. The average WOZ value in 2025 is EUR 453.000.
These figures help to better assess and compare the housing stock in Nijeholtpade with recent sold homes. Orient yourself then on suitable top real estate agents in Nijeholtpade for sales advice in this region.
Residents
518
Last year: 2026
Average WOZ
EUR 453.000
Last year: 2025
Average income per person.
EUR 32.400
Source: AllNumbers
Crimes (current year)
7
Total registered
| Year | Residents |
|---|---|
| 2021 | 495 |
| 2022 | 500 |
| 2023 | 510 |
| 2024 | 535 |
| 2025 | 540 |
| 2026 | 518 |
| Year | Average WOZ |
|---|---|
| 2021 | EUR 355.000 |
| 2022 | EUR 384.000 |
| 2023 | EUR 442.000 |
| 2024 | EUR 449.000 |
| 2025 | EUR 453.000 |
Hoger
140
Praktisch
80
Middelbaar
190
Europa
50
Nederland
465
Buiten Europa
20
Label G
53
Label B
39
Label C
37
Label A
25
Label D
23
Label F
10
Label E
8
Label A+
2
Label A+++
1
Label A++
0
Label A++++
0
Label A+++++
0
| Year | Gas (m3) | Electricity (kWh) |
|---|---|---|
| 2020 | 1.690 | 3.820 |
| 2021 | 1.900 | 3.860 |
| 2022 | 1.480 | 3.680 |
| 2023 | 1.200 | 3.540 |
| 2024 | 1.120 | 3.610 |
Hoekwoning
Gas: 1.550 • Electricity: 2.300
Huurwoning
Gas: 1.100 • Electricity: 2.240
Koopwoning
Gas: 1.210 • Electricity: 3.730
Tussenwoning
Gas: 1.220 • Electricity: 2.110
Vrijstaande woning
Gas: 1.260 • Electricity: 3.790
Twee-onder-één-kap woning
Gas: 870 • Electricity: 2.120
Total number of company establishments: 80
| Period | Crimes |
|---|---|
| jan 2026 | 1 |
| jul 2025 | 1 |
| jun 2025 | 0 |
| mei 2025 | 0 |
| mrt 2025 | 1 |
| mrt 2026 | 2 |
| nov 2024 | 1 |
| nov 2025 | 0 |
| okt 2024 | 0 |
| okt 2025 | 0 |
| sep 2024 | 0 |
| sep 2025 | 0 |
These figures give an indicative picture of safety trends in the living environment of Nijeholtpade.
Short answers based on current local statistics, handy for a quick comparison of the living environment.
Nijeholtpade telt in 2026 ongeveer 518 inwoners.
De gemiddelde WOZ-waarde in Nijeholtpade is in 2025 circa € 453.000.
Het gemiddelde inkomen per inwoner in Nijeholtpade ligt rond € 32.400 per jaar.
Voor het huidige jaar gaat het om ongeveer 7 geregistreerde misdrijven. Gebruik deze cijfers als indicatie en vergelijk trends per periode.
In Nijeholtpade komt vooral "Vrijstaande woningen" veel voor, met ongeveer 166 woningen.