
Residents
24.467
Last year: 2026
5673BA Nuenen • Noord-Brabant

For this property, no detailed description is available yet.
€ 825.000
Cost of copper (estimated): € 18.350
2% transfer tax (€ 16.500) + notary (€ 1.150) + valuation (€ 700)
Total purchase (incl. p.p.): € 843.350
3,04%
Yearly
€ 41.250
Direct available
Estimated mortgage
Indicative gross monthly cost
Based on annuity and 30 year term
Indicative net monthly cost
iDisclaimer: this mortgage calculation is a simplified indication based on general assumptions. No rights can be derived from the results shown. Calculated with 10-annual interest (zonder NHG), automatically determined based on the price limit € 470.000. Source: 10-jaars rente uit mortgage_rates (05-05-2026 03:45). For non-NHG, an 80% mortgage of the market value has been used in this indication.
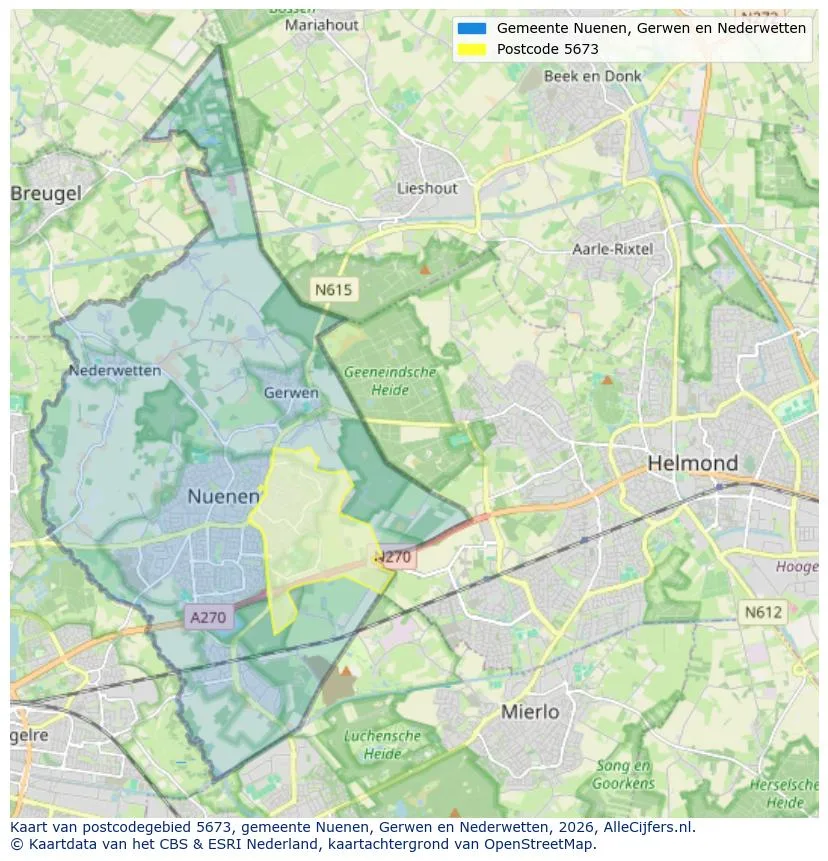
Explore Nuenen and the surrounding areas
View current location data on residents, WOZ development, housing stock, energy consumption, business activity and safety in Nuenen. In 2026 were there 24.467 residents. The average WOZ value in 2025 is EUR 513.000.
Residents
24.467
Last year: 2026
Average WOZ
EUR 513.000
Last year: 2025
Average income per person.
EUR 39.300
Source: AllNumbers
Crimes (current year)
666
Total registered
| Year | Residents |
|---|---|
| 2022 | 23.826 |
| 2023 | 24.015 |
| 2024 | 24.231 |
| 2025 | 24.290 |
| 2026 | 24.467 |
| Year | Average WOZ |
|---|---|
| 2021 | EUR 370.000 |
| 2022 | EUR 403.000 |
| 2023 | EUR 470.000 |
| 2024 | EUR 491.000 |
| 2025 | EUR 513.000 |
Hoger
44
Praktisch
20
Middelbaar
36
Europa
1.909
Nederland
20.042
Buiten Europa
2.339
Label C
3.287
Label A
2.600
Label B
2.428
Label D
1.230
Label F
531
Label G
367
Label A+++
278
Label E
243
Label A+
134
Label A++++
112
Label A++
60
Label A+++++
4
| Year | Gas (m3) | Electricity (kWh) |
|---|---|---|
| 2020 | 1.440 | 3.230 |
| 2021 | 1.610 | 3.260 |
| 2022 | 1.260 | 3.040 |
| 2023 | 1.040 | 2.890 |
| 2024 | 1.010 | 2.990 |
Hoekwoning
Gas: 1.010 • Electricity: 2.820
Huurwoning
Gas: 700 • Electricity: 2.040
Koopwoning
Gas: 1.140 • Electricity: 3.160
Appartement
Gas: 540 • Electricity: 1.740
Tussenwoning
Gas: 940 • Electricity: 2.600
Vrijstaande woning
Gas: 1.490 • Electricity: 4.030
Twee-onder-één-kap woning
Gas: 1.190 • Electricity: 3.330
Total number of company establishments: 3.545
| Period | Crimes |
|---|---|
| jan 2025 | 62 |
| jan 2026 | 60 |
| jul 2025 | 42 |
| jun 2025 | 61 |
| mei 2025 | 59 |
| mrt 2025 | 66 |
| nov 2024 | 61 |
| nov 2025 | 51 |
| okt 2024 | 57 |
| okt 2025 | 57 |
| sep 2024 | 79 |
| sep 2025 | 53 |
These figures give an indicative picture of safety trends in the living environment of Nuenen.
Short answers based on current local statistics, handy for a quick comparison of the living environment.
Nuenen telt in 2026 ongeveer 24.467 inwoners.
De gemiddelde WOZ-waarde in Nuenen is in 2025 circa € 513.000.
Het gemiddelde inkomen per inwoner in Nuenen ligt rond € 39.300 per jaar.
Voor het huidige jaar gaat het om ongeveer 666 geregistreerde misdrijven. Gebruik deze cijfers als indicatie en vergelijk trends per periode.
In Nuenen komt vooral "Tussenwoningen" veel voor, met ongeveer 4.098 woningen.
View more homes in this location.

5674SB Nuenen
€ 725.000 k.k.

5672SN Nuenen
€ 495.000 k.k.
€ 3.640/m²

5674RS Nuenen
€ 375.000 k.k.
€ 6.944/m²

5671LL Nuenen
€ 1.975 p/m
€ 17/m²

5671GT Nuenen
€ 475.000 k.k.
€ 3.992/m²

5673LX Nuenen
€ 1.525 p/m
€ 14/m²

5673NE Nuenen
€ 639.000 k.k.
€ 4.377/m²

5673MJ Nuenen
€ 1.650 p/m
€ 13/m²
