Residents
1.511
Last year: 2026
8421PX Oldeberkoop • Fryslân
€ 785.000 k.k.
Cost of copper (estimated): € 17.550
2% transfer tax (€ 15.700) + notary (€ 1.150) + valuation (€ 700)
Total incl. VAT: € 802.550
Purchase price /m²: € 5.097
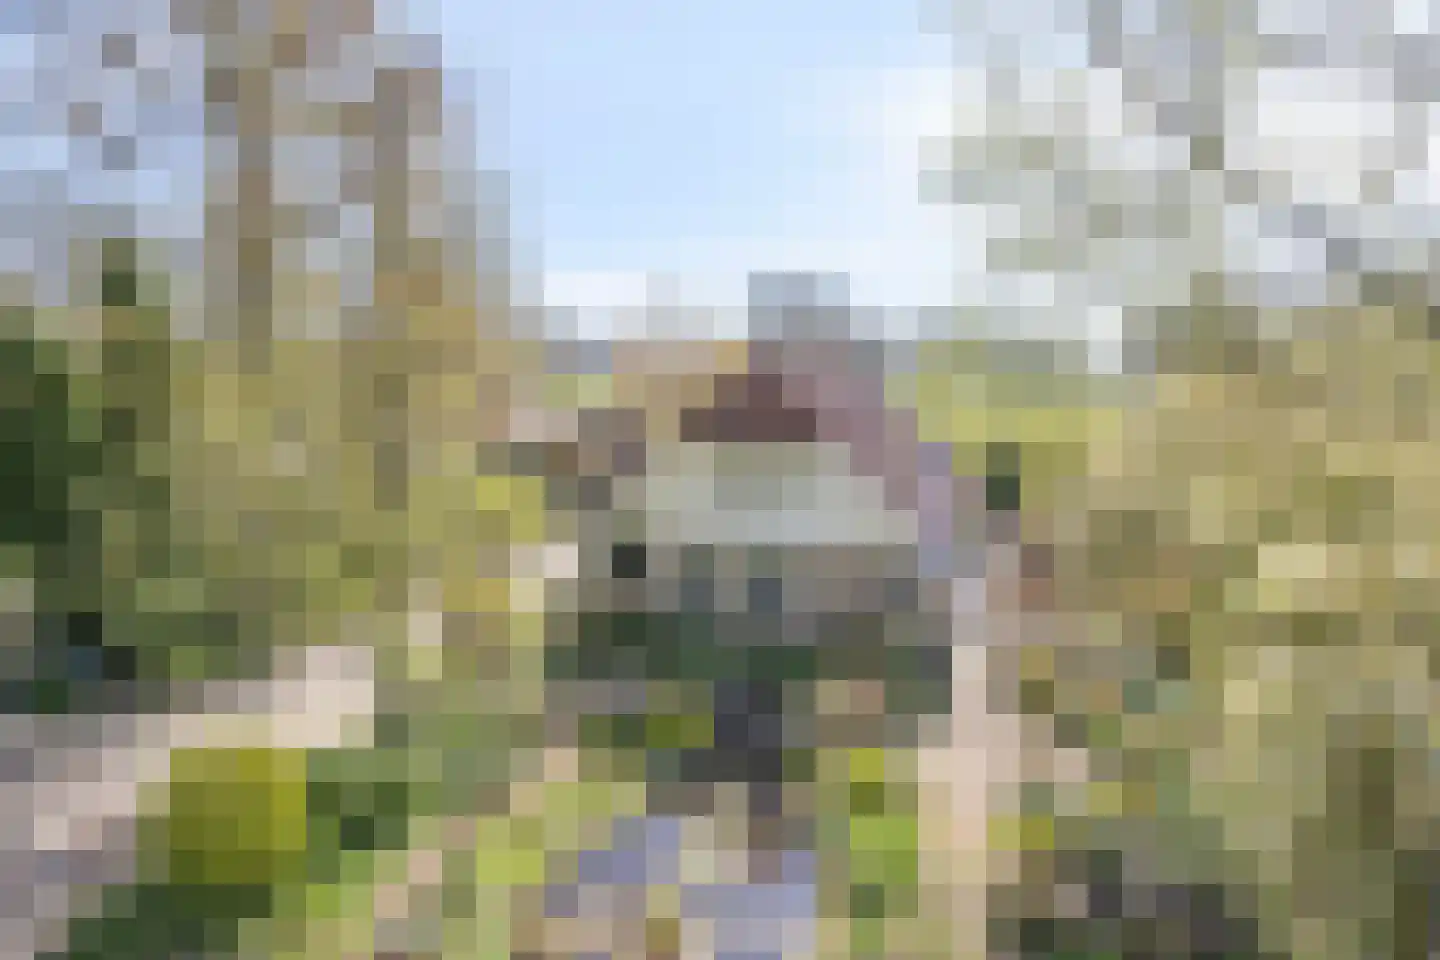
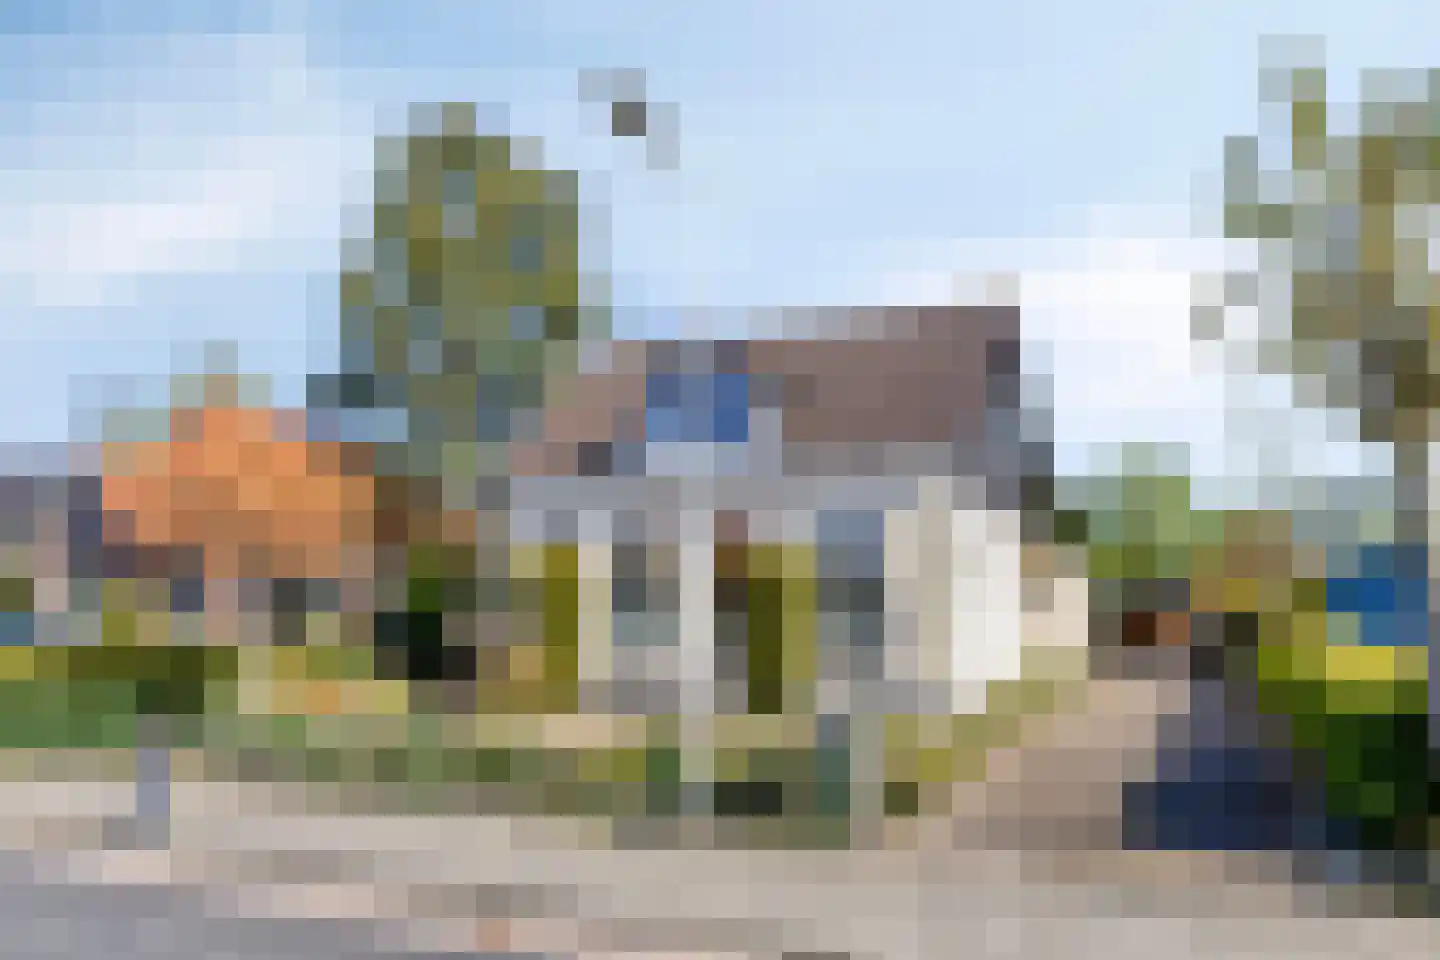
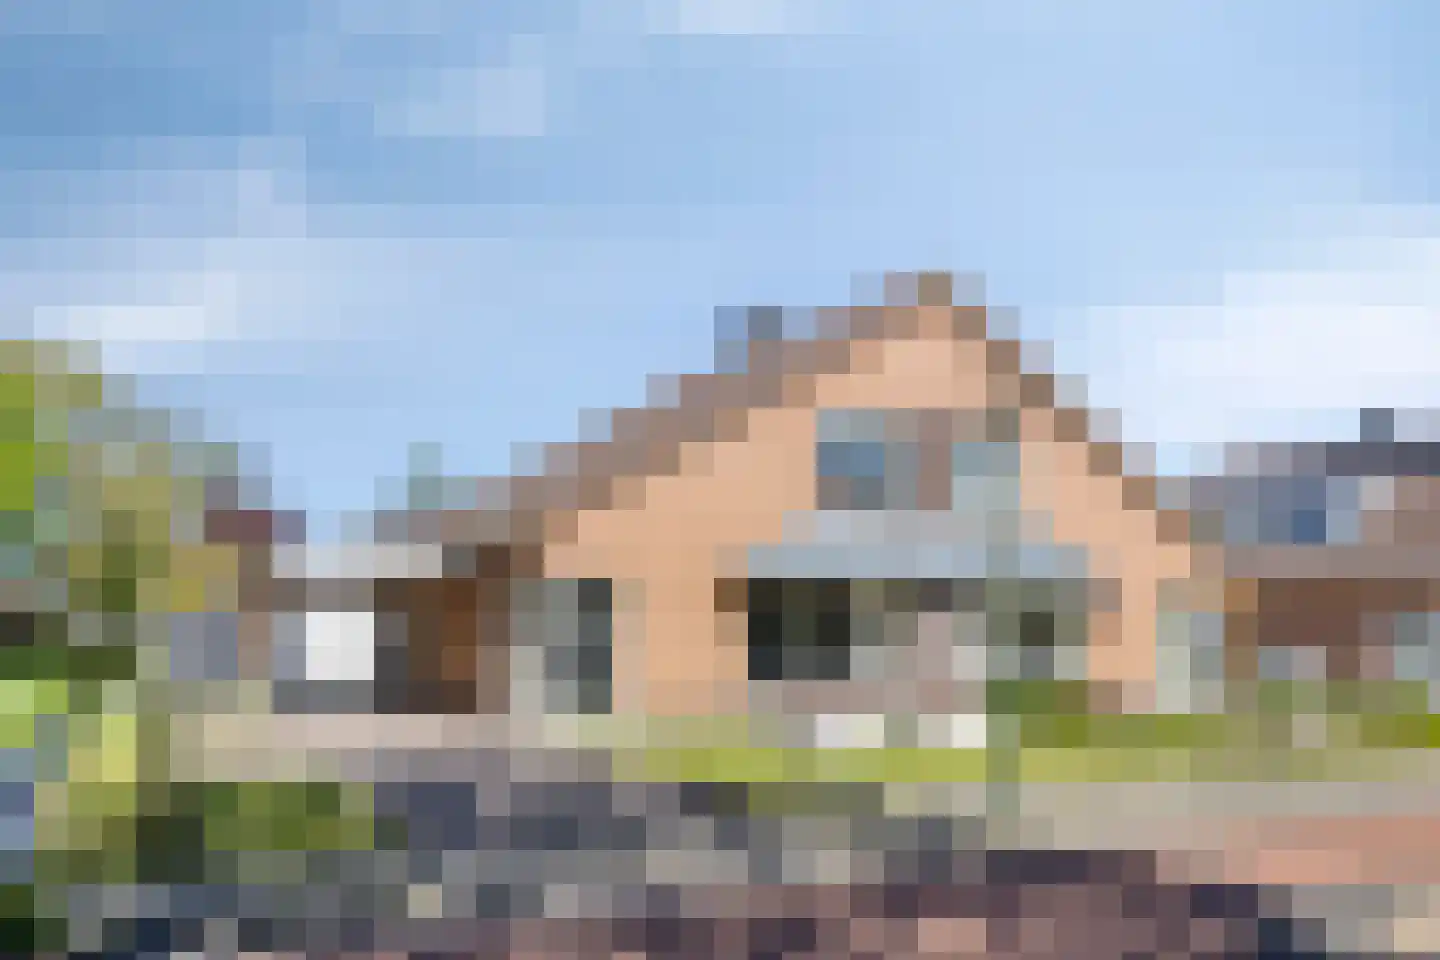
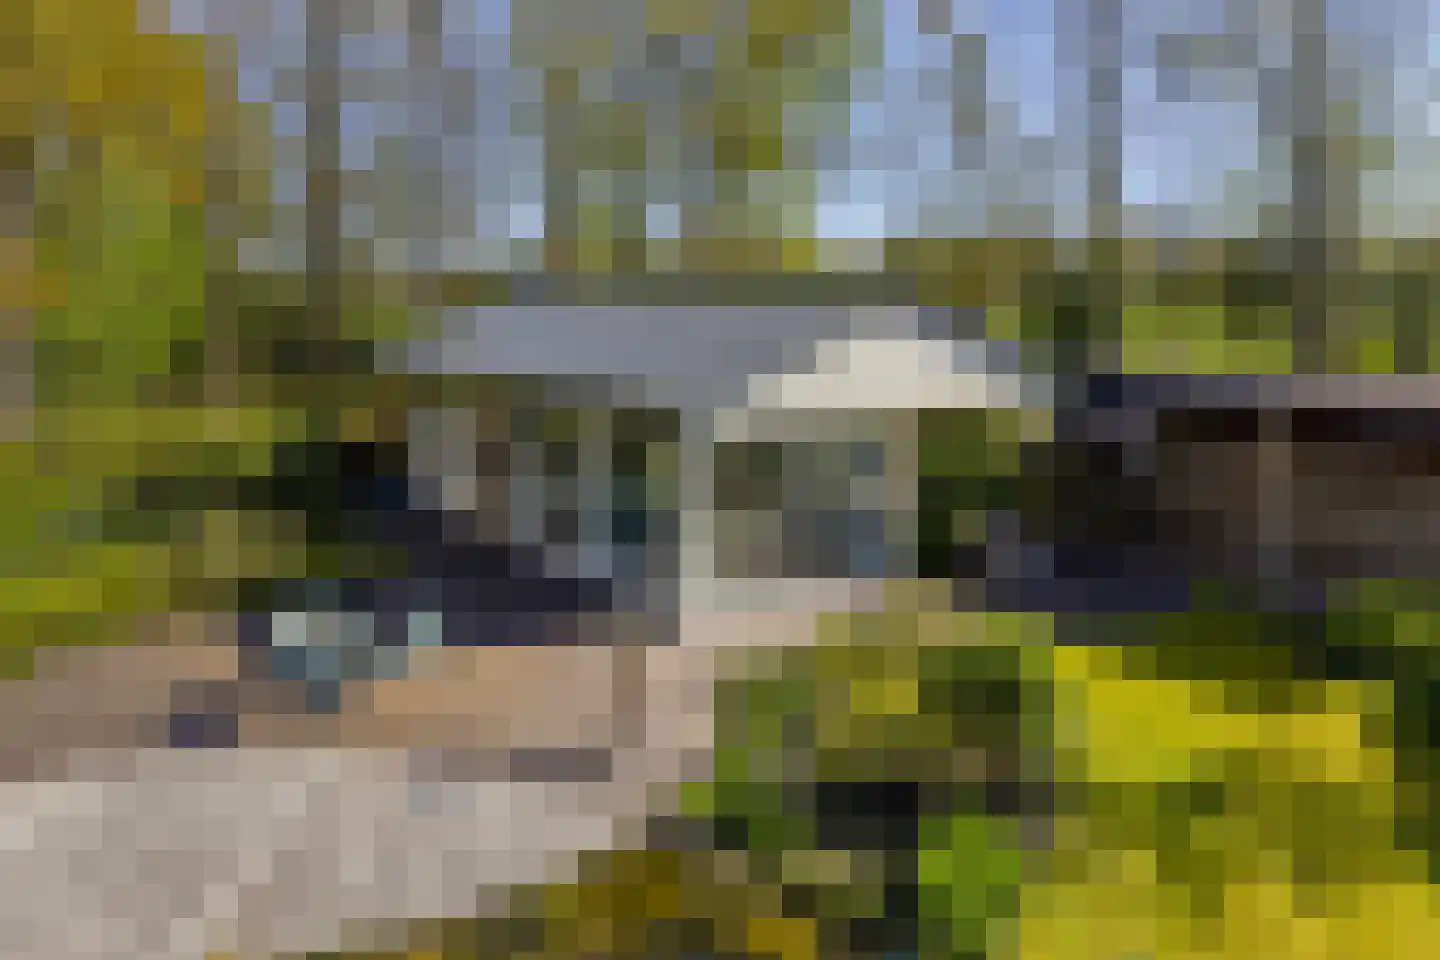
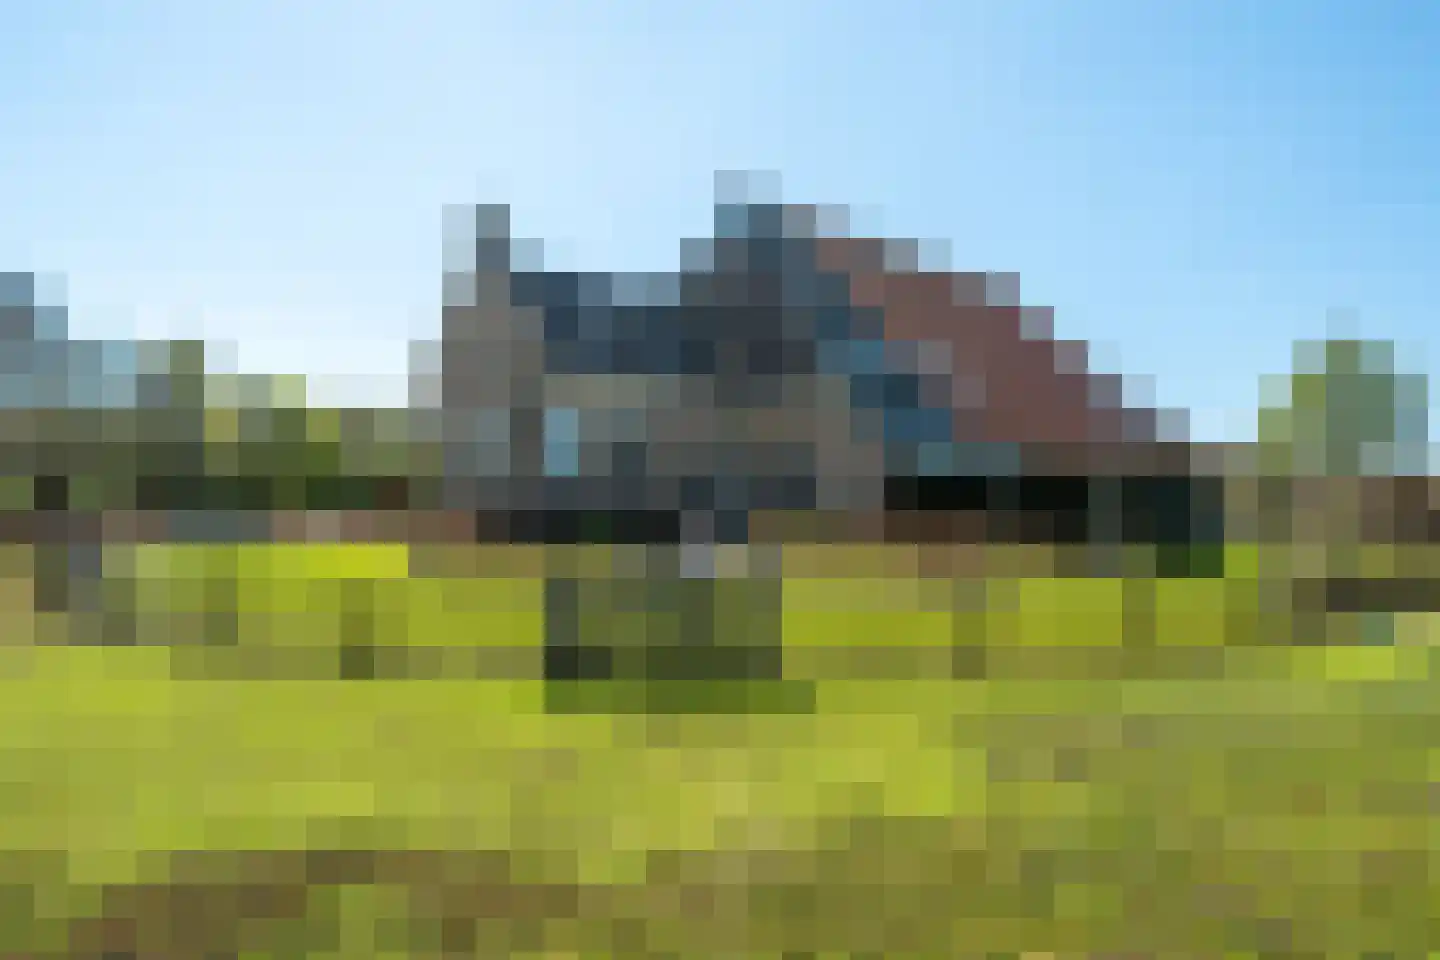
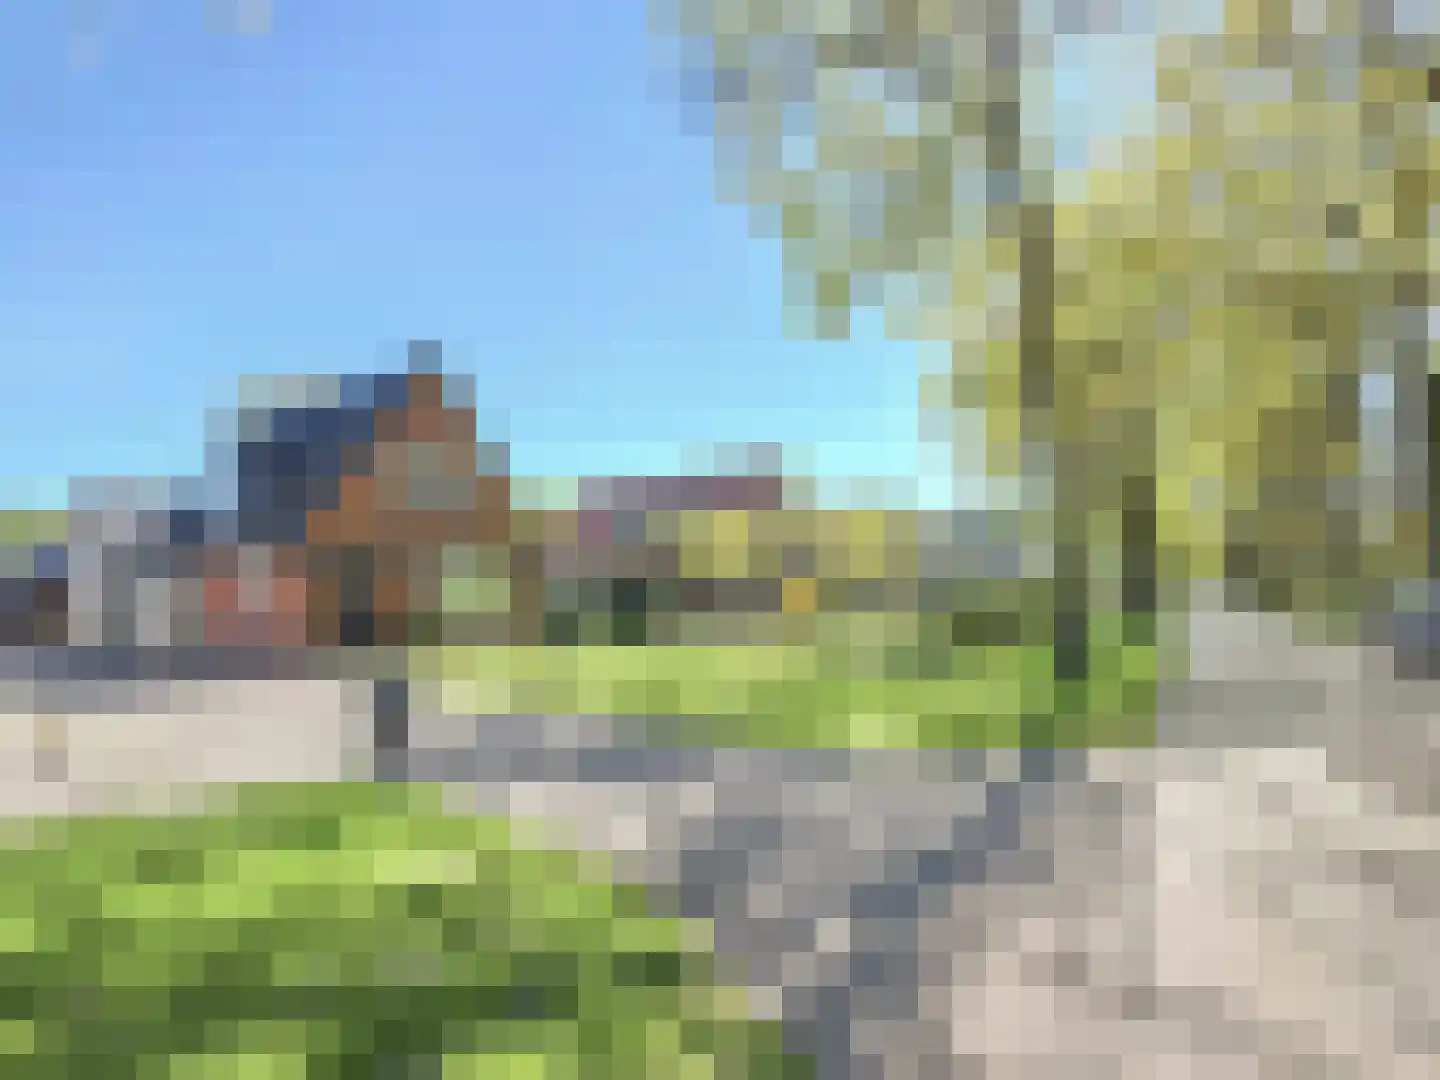
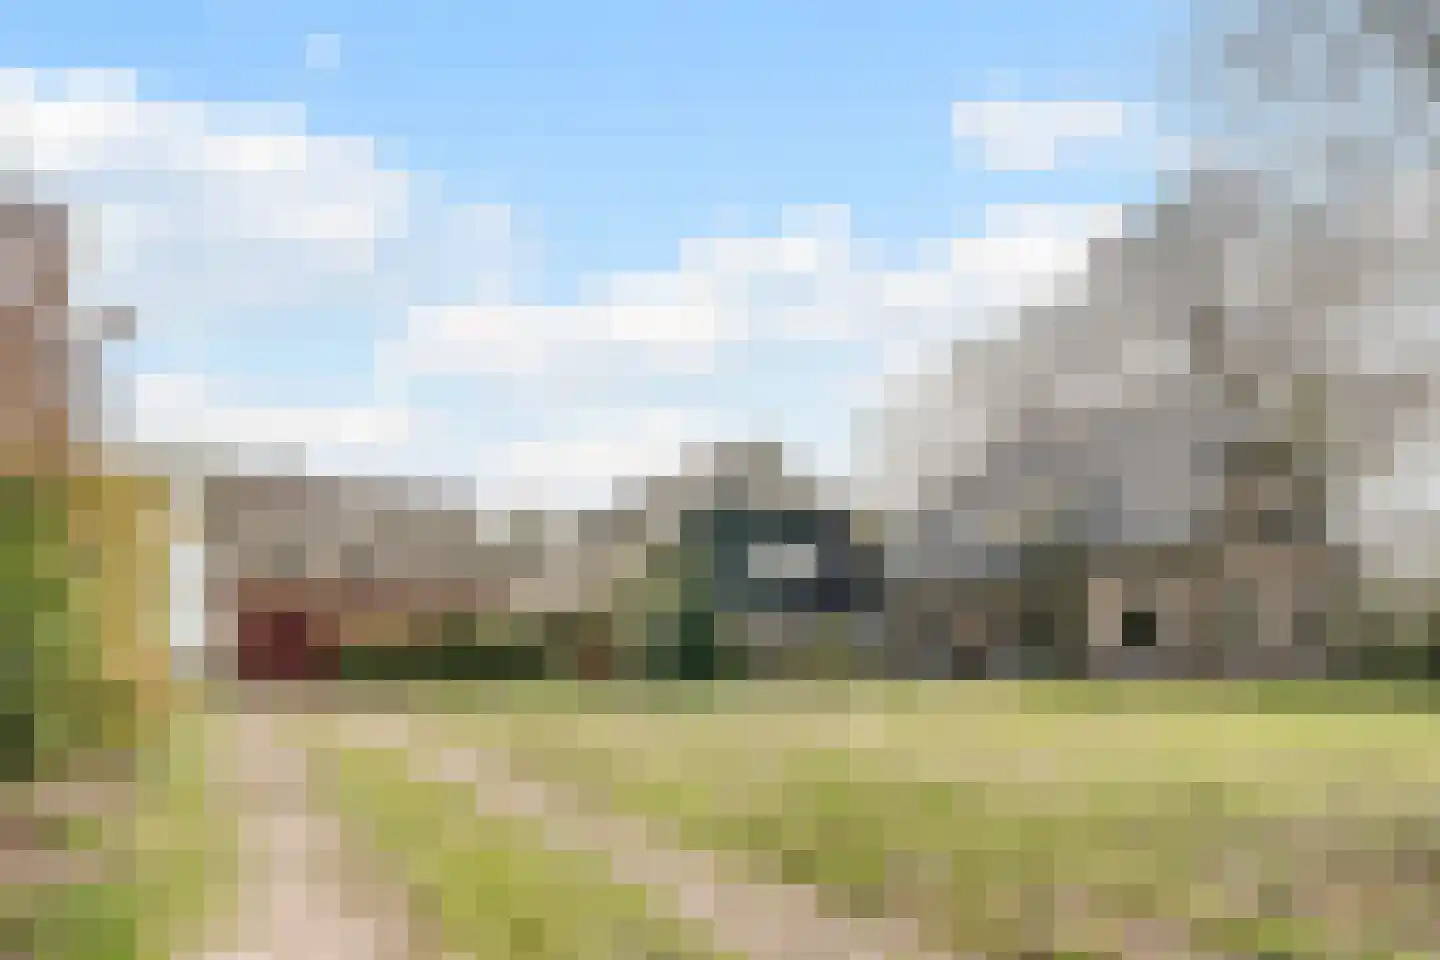
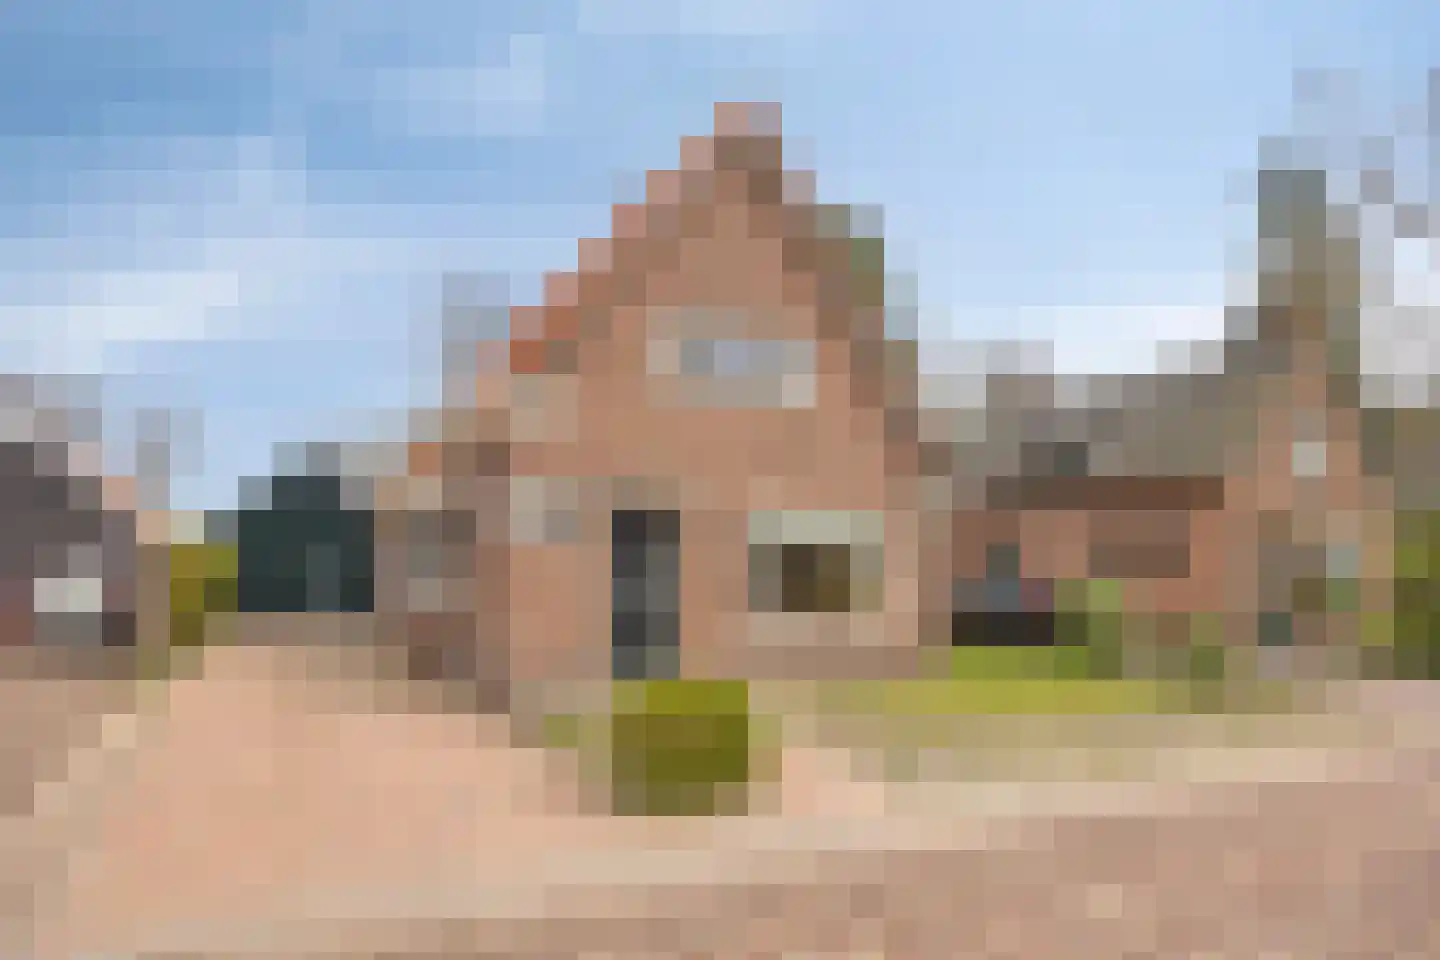
Op het mooiste deel van het Schuinpad gelegen sfeervol vrijstaand woonhuis met garage, stalgebouw met vier paardenboxen en weiland op totaal 8.690 m² eigen grond. Op het Schuinpad is het karakteristieke dorpse karakter van Oldeberkoop nog goed voelbaar. Hier staat dit sfeervolle vrijstaande woonhuis (bouwjaar 1990) met vrijstaande stenen garage en stenen stalgebouw. Een prachtige plek met volop ruimte, privacy en groen, terwijl voorzieningen van het dorp toch dichtbij zijn. De woning is bovendien levensloopbestendig dankzij een slaap- en badkamer op de begane grond. Op de eerste verdieping bevinden zich nog eens drie slaapkamers en een tweede (eenvoudige) badkamer. Daarmee is dit een ideaal huis voor zowel gezinnen als voor wie gelijkvloers wil wonen. Het royale perceel van maar liefst 8.690 m² biedt volop mogelijkheden voor tuinliefhebbers en dierenliefhebbers. De tuin is fraai aangelegd met een grote variatie aan bloemen en planten en biedt een prachtige mogelijkheid om in alle privacy van het buitenleven te genieten. HET WOONHUIS Indeling begane grond: entree met ruime hal. Toiletruimte met gastenfonteintje, lichte woonkamer (ca. 40m²) die aan de achterzijde van het woonhuis is gesitueerd. De woonkamer is voorzien van veel raampartijen en openslaande deuren die toegang tot het terras/de achtertuin bieden. Nette keuken (ca. 14m²) die is voorzien van inbouwapparatuur. Vanuit de keuken is er toegang tot de beknopte kelderruimte. Aangrenzende bijkeuken waar de wasmachine en droger kunnen worden opgesteld. Vanuit de bijkeuken is eveneens de tuin toegankelijk. Schaduwrijke slaapkamer (ca. 13m²) met vaste kast en toegang tot de aangrenzende badkamer. De moderne badkamer is voorzien van een inloopdouche, wastafelmeubel en een wandcloset. Indeling eerste etage: overloop met kast en vlizotrap naar de zolderruimte. Royale slaapkamer aan de voorzijde (ca. 23m²) die is voorzien van een kast waar de c.v.-ketel in is opgesteld. Deze slaapkamer is eenvoudig in twee slaapkamers te transformeren. Wasruimte (vml. tweede badkamer) met aansluitingen voor een toilet, wastafel en douche. Twee slaapkamers aan de achterzijde van respectievelijk ca. 15m² en 13m² die beiden zijn voorzien van een dakkapel en kastruimte in de knieschotten. DE BIJGEBOUWEN Op het erf zijn verder nog de navolgende bijgebouwen gerealiseerd: - garage met toegang tot overkapping (voormalig solarium ten behoeve van het hobbymatig paardenhouden) - steen gemetseld stalgebouw met vier paardenboxen - overkapping ten behoeve van opslag - vrijstaande houten tuinschuur met een veranda BUITEN Voor het huis ligt de met natuurlijke planten prachtig aangelegde siertuin met grote vijverpartij. De naastgelegen oprit biedt ruimte aan het stallen van meerdere voertuigen en vanaf hier is het achterliggende weiland te bereiken. De zijtuin (toegankelijk vanuit de bijkeuken) is grotendeels bestraat. De achtertuin is voorzien van een zonneterras (zuid georiënteerd), een gazon met een natuurlijke parasol van platanen (heerlijk koel op warme dagen) en een moestuin met compost opslag. Aan de achtertuin grenzen de voormalige springtuin en het eigen weiland van ca. 6.300m² groot. Het weiland is omzoomd met een houten hekwerk. Voor de aankoop van weiland bedraagt het overdrachtsbelastingstarief 10,4%. Het naastgelegen perceel tuin/weiland met ontsluiting naar de achtergelegen Bovenweg wordt al jaren gehuurd door de huidige bewoners. De eigenaar van dit perceel heeft aangegeven het desgewenst weer te willen verhuren. De grootte van dit perceel bedraagt 3.275m². DE OMGEVING Niet voor niets wordt 'ons' dorp De Parel van de Stellingwerven genoemd. Het historische dorpscentrum is beschermd en kent als hoogtepunt de Bonifatiuskerk (één van de oudste kerken in zuidoost Friesland). Verder kent het dorp nog een basisschool, huisartsenpraktijk en gezellige dorpswinkels waar men de tijd voor elkaar neemt. In de zomer wordt het dorp getransformeerd tot een toeristische trekpleister vanwege de boerenmarkten met streekproducten en de kunstroute waarbij galeries, boerderijen en schuren de meest uiteenlopende internationale kunstwerken tentoonstellen. Het dorp is rijk aan diverse sportaccommodaties waaronder een voetbalvereniging, tennisvereniging en een multifunctioneel centrum met een volwaardige sporthal. Oldeberkoop ligt centraal tussen de Nationale Parken De Weerribben, de Aldefeanen en het Drents Friese Wold. Hierdoor treft u hier de meest diverse, adembenemende natuurgebieden waaronder de Delleboersterheide, de Diakonievene, Kiekenberg, Linde- en Tjongervallei en het Landgoed Boschoord. Een grote diversiteit aan wandel- fiets en ruiterpaden bieden ruim voldoende recreatiemogelijkheden. De rijksnelwegen zijn snel en gemakkelijk bereikbaar waardoor Amsterdam, Utrecht en Den Haag goed bereikbaar zijn. In de koopovereenkomst zullen zoals gebruikelijk bij oudere woningen de ouderdoms- en asbestclausule worden opgenomen. Neem voor het inplannen van een bezichtiging contact op met het kantoor van BUITEN Landelijk Wonen (onderdeel van SNOEK makelaars) in Oosterwolde, wij leiden u graag persoonlijk rond. Neem desgewenst uw eigen NVM-aankoopmakelaar mee voor persoonlijk advies!
€ 785.000
Cost of copper (estimated): € 17.550
2% transfer tax (€ 15.700) + notary (€ 1.150) + valuation (€ 700)
Total purchase (incl. p.p.): € 802.550
3,26%
Yearly
€ 39.250
Direct available
Estimated mortgage
Indicative gross monthly cost
Based on annuity and 30 year term
Indicative net monthly cost
iDisclaimer: this mortgage calculation is a simplified indication based on general assumptions. No rights can be derived from the results shown. Calculated with 10-annual interest (zonder NHG), automatically determined based on the price limit € 470.000. Source: 10-jaars rente uit mortgage_rates (12-06-2026 03:45). For non-NHG, an 80% mortgage of the market value has been used in this indication.
Inloopdouche, 2 toiletten, wastafelmeubel, en douche
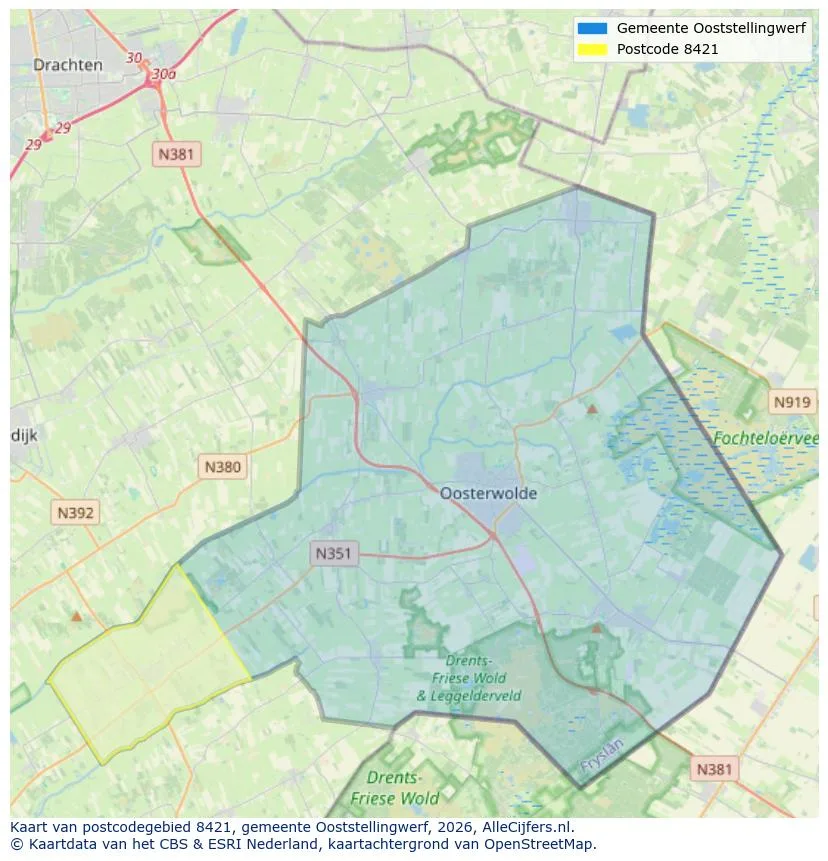
View the location and discover the brokers in this region
View current location data on residents, WOZ development, housing stock, energy consumption, business activity and safety in Oldeberkoop. In 2026 were there 1.511 residents. The average WOZ value in 2025 is EUR 358.000.
Residents
1.511
Last year: 2026
Average WOZ
EUR 358.000
Last year: 2025
Average income per person.
EUR 30.900
Source: AllNumbers
Crimes (current year)
24
Total registered
| Year | Residents |
|---|---|
| 2021 | 1.575 |
| 2022 | 1.555 |
| 2023 | 1.535 |
| 2024 | 1.500 |
| 2025 | 1.490 |
| 2026 | 1.511 |
| Year | Average WOZ |
|---|---|
| 2021 | EUR 279.000 |
| 2022 | EUR 310.000 |
| 2023 | EUR 356.000 |
| 2024 | EUR 357.000 |
| 2025 | EUR 358.000 |
Hoger
310
Praktisch
310
Middelbaar
460
Europa
65
Nederland
1.390
Buiten Europa
40
Label C
137
Label G
136
Label B
115
Label D
110
Label A
94
Label F
67
Label E
32
Label A+
6
Label A++
2
Label A++++
1
Label A+++
0
Label A+++++
0
| Year | Gas (m3) | Electricity (kWh) |
|---|---|---|
| 2020 | 1.600 | 2.960 |
| 2021 | 1.800 | 2.980 |
| 2022 | 1.380 | 2.840 |
| 2023 | 1.130 | 2.720 |
| 2024 | 1.110 | 2.810 |
Hoekwoning
Gas: 900 • Electricity: 1.870
Huurwoning
Gas: 940 • Electricity: 1.830
Koopwoning
Gas: 1.190 • Electricity: 3.000
Appartement
Gas: 740 • Electricity: 1.700
Tussenwoning
Gas: 840 • Electricity: 1.520
Vrijstaande woning
Gas: 1.270 • Electricity: 3.150
Twee-onder-één-kap woning
Gas: 930 • Electricity: 2.270
Total number of company establishments: 235
| Period | Crimes |
|---|---|
| jan 2026 | 0 |
| jul 2025 | 2 |
| jun 2025 | 3 |
| mei 2025 | 2 |
| mrt 2025 | 1 |
| mrt 2026 | 4 |
| nov 2024 | 2 |
| nov 2025 | 1 |
| okt 2024 | 2 |
| okt 2025 | 0 |
| sep 2024 | 4 |
| sep 2025 | 1 |
These figures give an indicative picture of safety trends in the living environment of Oldeberkoop.
Short answers based on current local statistics, handy for a quick comparison of the living environment.
Oldeberkoop telt in 2026 ongeveer 1.511 inwoners.
De gemiddelde WOZ-waarde in Oldeberkoop is in 2025 circa € 358.000.
Het gemiddelde inkomen per inwoner in Oldeberkoop ligt rond € 30.900 per jaar.
Voor het huidige jaar gaat het om ongeveer 24 geregistreerde misdrijven. Gebruik deze cijfers als indicatie en vergelijk trends per periode.
In Oldeberkoop komt vooral "Vrijstaande woningen" veel voor, met ongeveer 418 woningen.
View more homes in this location.

8421DD Oldeberkoop
€ 319.000 k.k.
8421RM Oldeberkoop
€ 585.000 k.k.
€ 3.545/m²
8421SE Oldeberkoop
€ 415.000 k.k.
€ 3.192/m²
8421RZ Oldeberkoop
€ 389.000 k.k.
8421PJ Oldeberkoop
€ 1.750.000 k.k.
€ 4.958/m²
8421PC Oldeberkoop
€ 475.000 k.k.
€ 4.524/m²
8421PS Oldeberkoop
€ 750.000 k.k.
€ 4.808/m²
8421PH Oldeberkoop
€ 495.000 k.k.
€ 3.960/m²
