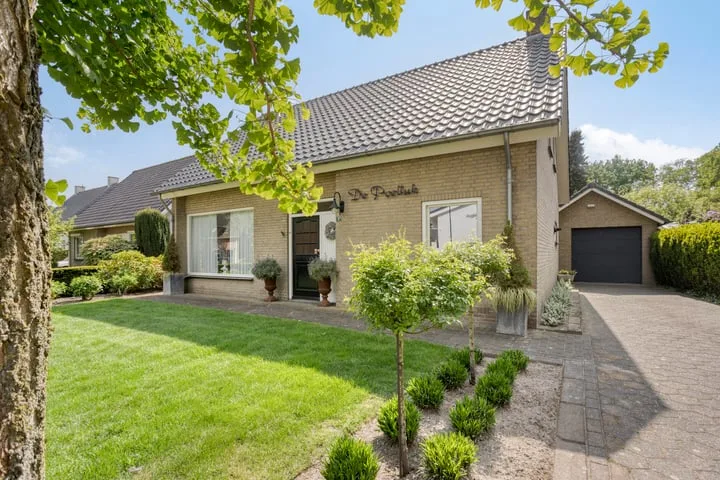
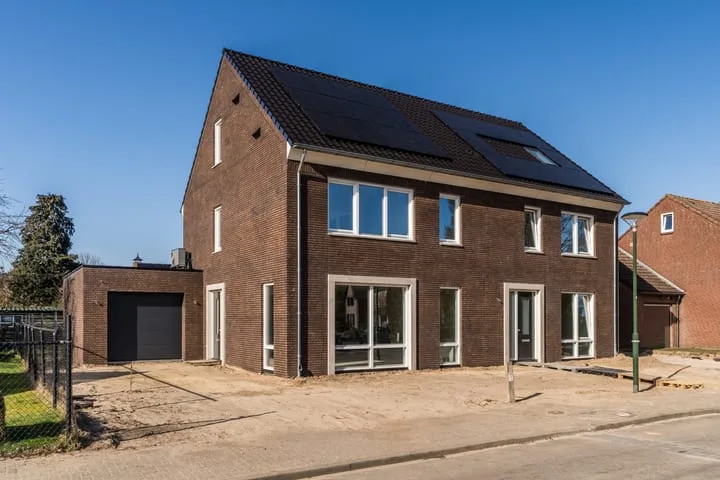
Houses sold in Ommel

View 11 sold houses in Ommel

Connected to: Vastgoed Nederland NVM Makelaars

On this page you will find recently sold homes in Ommel. Use this overview to better estimate selling prices, popular neighborhoods, and the local housing supply before you choose a real estate agent. Also view the current housing supply with 11 houses in Ommel.

Selection

Search and filter homes

Set your preferences and discover homes that suit you.

Total supply 241.450
Filters

Set price, area and other characteristics. Adjust a filter or click on Show homes. Location changes directly above.

Reset filters

You search for

  • Place Ommel
  • Status Sold

Huis verkopen in Ommel? Vergelijk verkoopmakelaars

Bekijk recente verkopen en ontvang gratis offertes van lokale verkoopmakelaars in Ommel.

Free request a quote

  • Quotes in Ommel
  • Non-binding
  • Personal
  • Gratis tarieven vergelijken

Zelf je woning verkopen in Ommel? Vergelijk verkoopmakelaars in Ommel of bekijk de beste verkoopmakelaars in Ommel als referentie bij jouw keuze.

Vergelijk meerdere offertes

Makelaars maken scherpere voorstellen als ze weten dat je vergelijkt — vraag offertes aan voor verkoop of aankoop.

Frequently asked questions about sold homes in Ommel

Short answers about housing prices, sold homes and comparing real estate agents in Ommel.

Residential and neighborhood statistics in Ommel

View current location data on residents, WOZ development, housing stock, energy consumption, business activity and safety in Ommel. In 2025 were there 1.005 residents. The average WOZ value in 2025 is EUR 505.650.

These figures help to better assess and compare the housing stock in Ommel with recent sold homes. Orient yourself then on suitable top real estate agents in Ommel for sales advice in this region.

Residents

1.005

Last year: 2025

Average WOZ

EUR 505.650

Last year: 2025

Average income per person.

EUR 31.105

Source: AllNumbers

Crimes (current year)

44

Total registered

Demographics and WOZ development

Inhabitants per year

Inhabitants per year in Ommel
Year Residents
2021 1.085
2022 1.050
2023 1.045
2024 1.035
2025 1.005

Annual WOZ value

WOZ value per year in Ommel
Year Average WOZ
2021 EUR 391.933
2022 EUR 430.359
2023 EUR 477.607
2024 EUR 480.063
2025 EUR 505.650

Composition of residents

Age build-up

65+: 200 0-15: 140 15-25: 125 25-45: 240 45-65: 290

Education level

Hoger

220

Praktisch

150

Middelbaar

380

Origin of residents (2025)

Europa

95

Nederland

885

Buiten Europa

20

Housing stock and construction periods

Types of homes

Hoekwoningen 39
Appartementen 12
Tussenwoningen 34
Vrijstaande woningen 185
Twee-onder-één-kap woningen 92

Construction period of buildings

Voor 1700 0
1700 tot 1900 19
1900 tot 1925 19
1925 tot 1950 31
1950 tot 1970 81
1970 tot 1980 49
1980 tot 1990 59
1990 tot 2000 29
2000 tot 2010 26
2010 tot 2020 36
2020 en later 35

Energy and sustainability

Energy label distribution

Label C

82

Label A

61

Label B

58

Label F

43

Label G

36

Label D

28

Label A+++

19

Label E

7

Label A++++

5

Label A+

3

Label A++

0

Label A+++++

0

Average energy consumption per year

Average energy consumption per year in Ommel
Year Gas (m3) Electricity (kWh)
2020 1.723 4.205
2021 1.940 4.313
2022 1.526 3.998
2023 1.266 3.897
2024 1.146 3.937

Consumption per house type

Hoekwoning

Gas: 985 • Electricity: 3.141

Huurwoning

Gas: 1.428 • Electricity: 2.994

Koopwoning

Gas: 1.201 • Electricity: 3.969

Appartement

Gas: 1.526 • Electricity: 3.575

Tussenwoning

Gas: 768 • Electricity: 2.846

Vrijstaande woning

Gas: 1.375 • Electricity: 4.429

Twee-onder-één-kap woning

Gas: 1.260 • Electricity: 3.328

Business activity in Ommel (2025)

Handel en HORECA 20
Nijverheid en energie 35
Zakelijke dienstverlening 20
Overheid, onderwijs en zorg 15
Landbouw, bosbouw en visserij 25
Vervoer, informatie en communicatie 5
Financiele diensten en onroerendgoed 10
Cultuur, recreatie en overige diensten 15

Total number of company establishments: 150

Recent crime statistics

Recent crime statistics in Ommel
Period Crimes
jan 2025 1
jan 2026 3
jul 2025 3
jun 2025 6
mei 2025 2
mrt 2025 5
nov 2024 3
nov 2025 5
okt 2024 5
okt 2025 3
sep 2024 6
sep 2025 3

These figures give an indicative picture of safety trends in the living environment of Ommel.

Frequently asked questions about living in Ommel

Short answers based on current local statistics, handy for a quick comparison of the living environment.

Hoeveel inwoners heeft Ommel?

Ommel telt in 2025 ongeveer 1.005 inwoners.

Wat is de gemiddelde WOZ-waarde in Ommel?

De gemiddelde WOZ-waarde in Ommel is in 2025 circa € 505.650.

Wat is het gemiddelde inkomen per inwoner in Ommel?

Het gemiddelde inkomen per inwoner in Ommel ligt rond € 31.105 per jaar.

Hoe veilig is wonen in Ommel?

Voor het huidige jaar gaat het om ongeveer 44 geregistreerde misdrijven. Gebruik deze cijfers als indicatie en vergelijk trends per periode.

Welke woningtypen komen het meest voor in Ommel?

In Ommel komt vooral "Vrijstaande woningen" veel voor, met ongeveer 185 woningen.

Gratis vrijblijvende offertes ontvangen

Vergelijk meerdere makelaars en kies de beste match.