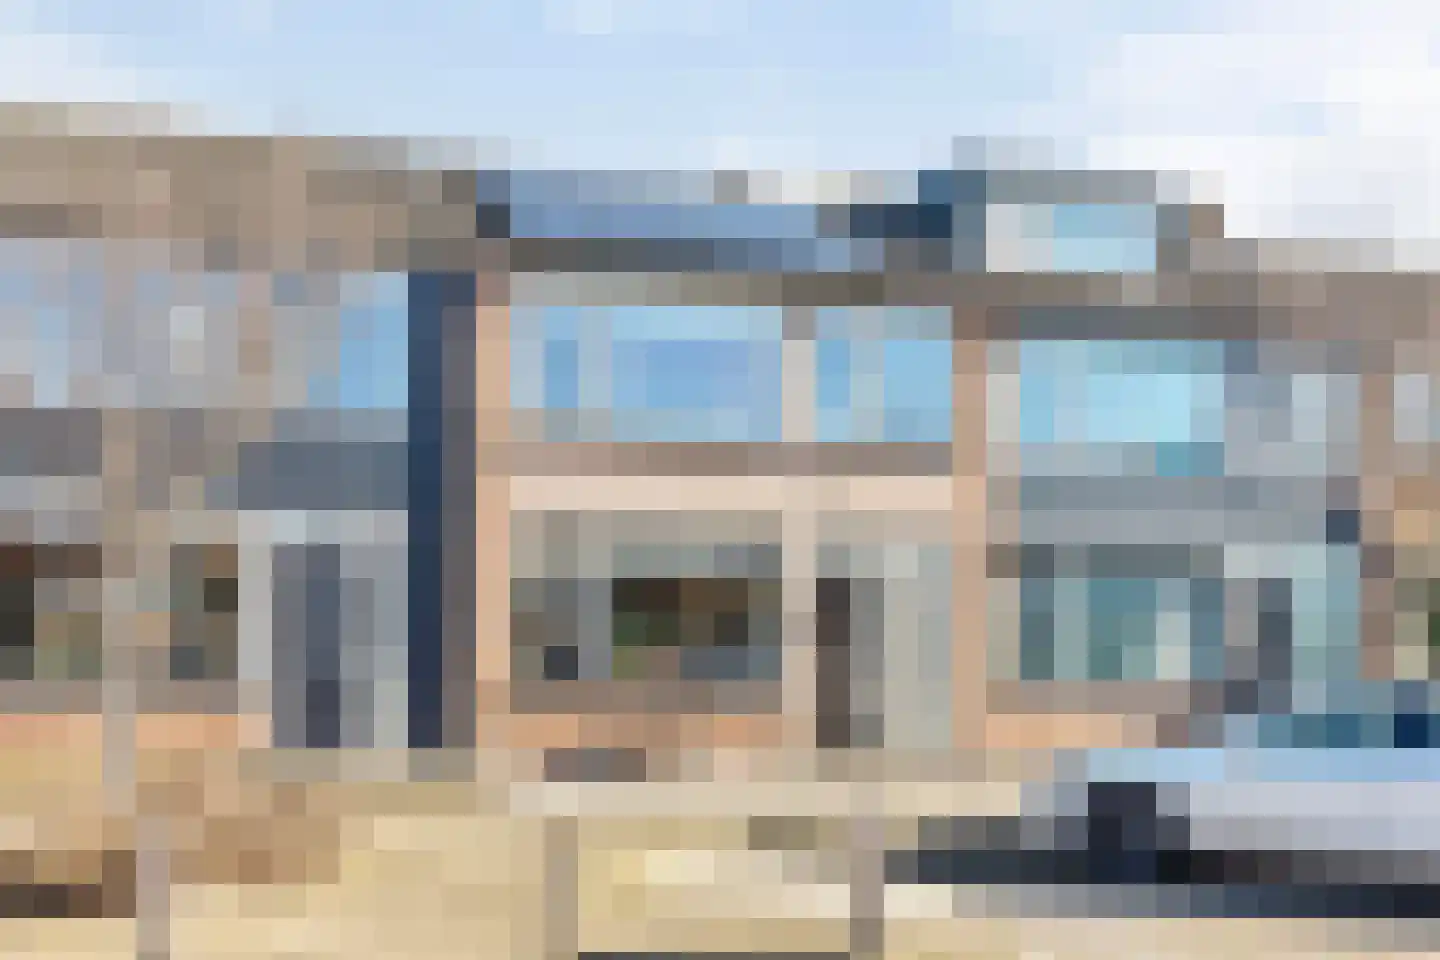
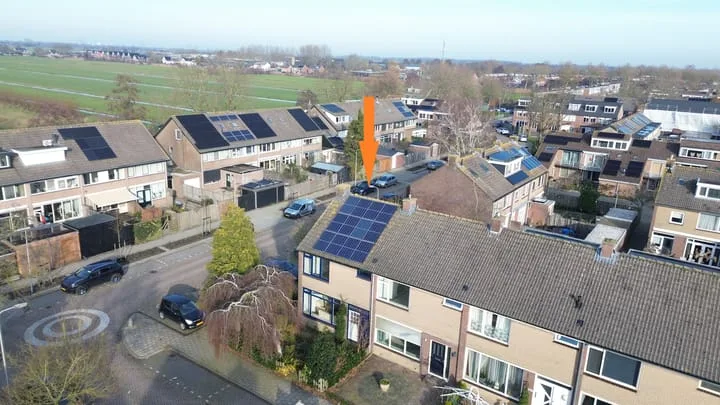
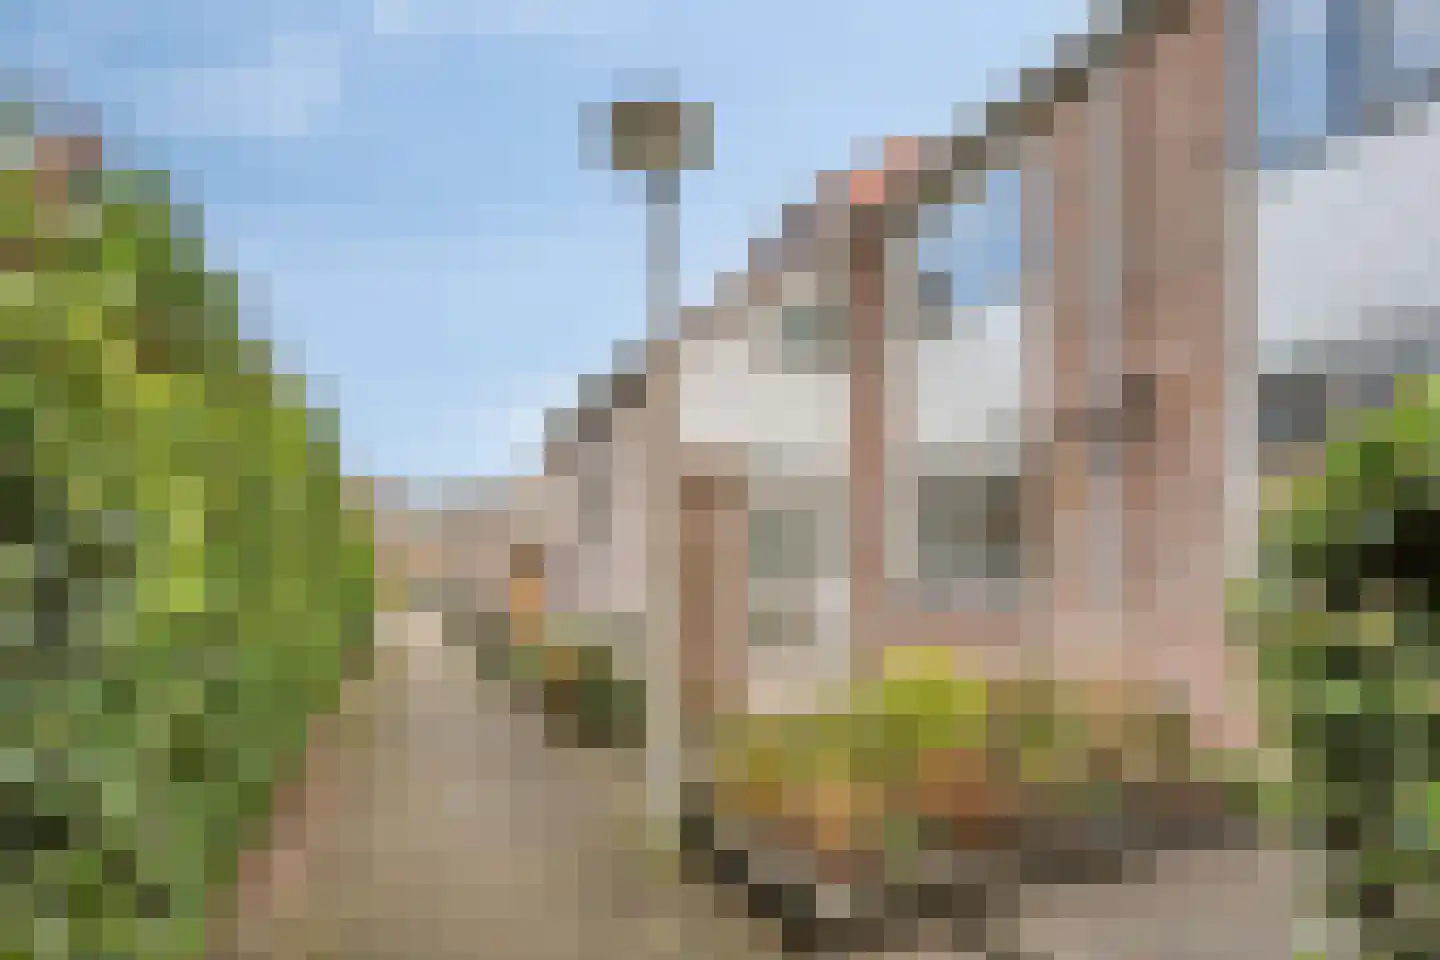
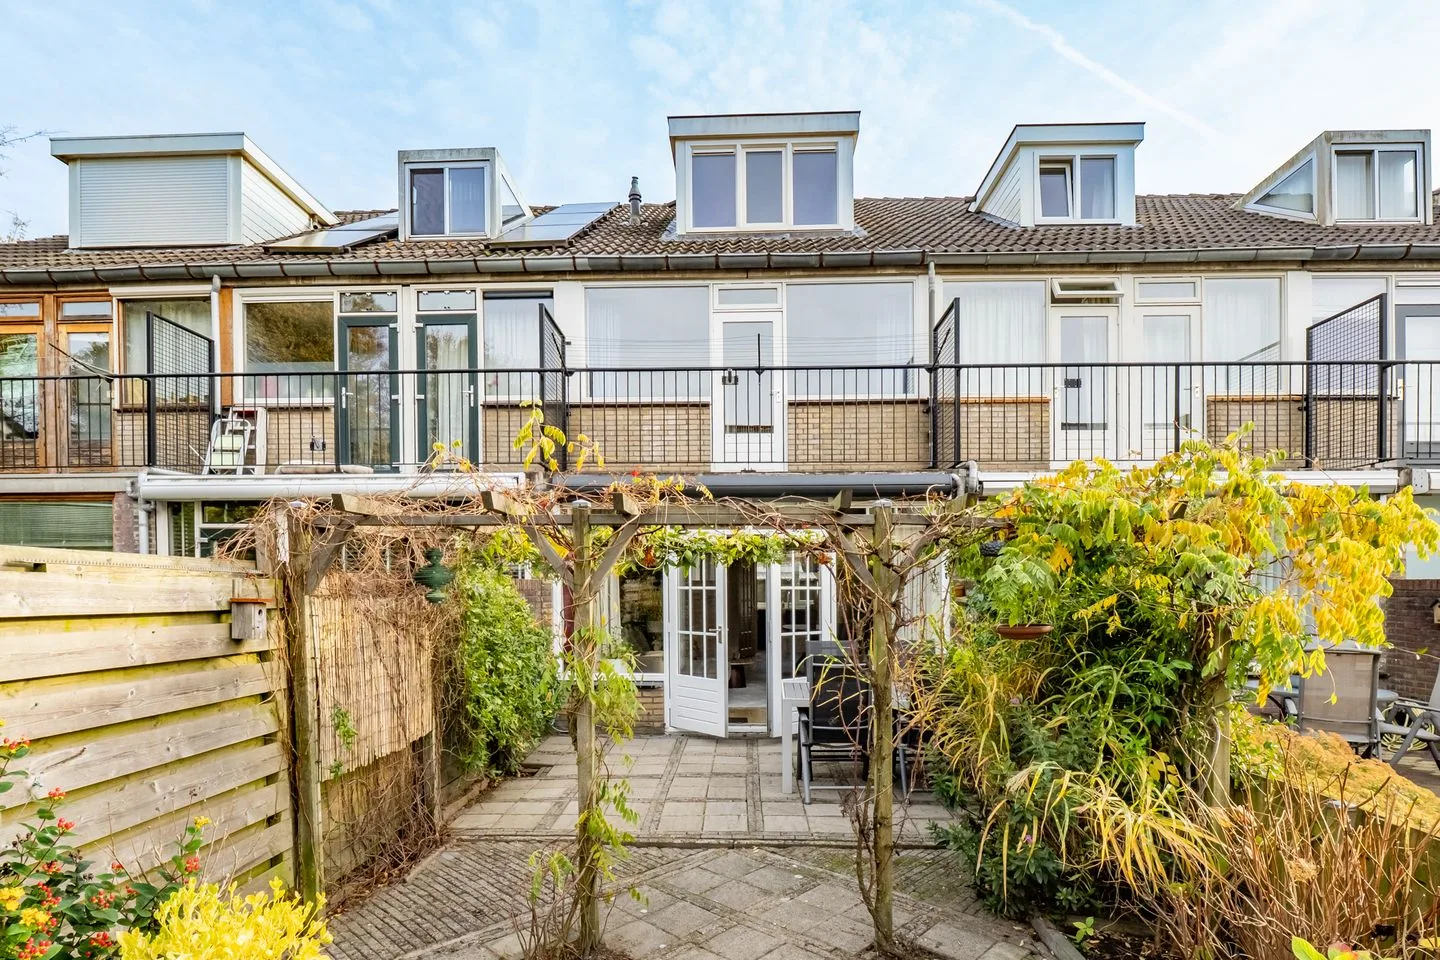
Houses sold in Oudewater

View 88 sold houses in Oudewater

Connected to: Vastgoed Nederland NVM Makelaars

On this page you will find recently sold homes in Oudewater. Use this overview to better estimate selling prices, popular neighborhoods, and the local housing supply before you choose a real estate agent. Also view the current housing supply with 117 houses in Oudewater.

Selection

Search and filter homes

Set your preferences and discover homes that suit you.

Total supply 243.386
Filters

Set price, area and other characteristics. Adjust a filter or click on Show homes. Location changes directly above.

Reset filters

You search for

  • Place Oudewater
  • Status Sold

Sell your house in Oudewater? Compare real estate agents

Bekijk recente verkopen en ontvang gratis offertes van lokale makelaars. Vergelijk meer dan 38 makelaars in Oudewater.

Free request a quote

  • Quotes in Oudewater
  • Non-binding
  • Personal
  • Compare free rates

Selling your own home in Oudewater? Compare real estate agents in Oudewater or view the best real estate agents in Oudewater as a reference for your choice.

Compare multiple quotes

Real estate agents make sharper offers when they know you're comparing — ask for quotes for sale or purchase.

Frequently asked questions about sold homes in Oudewater

Short answers about housing prices, sold homes and comparing real estate agents in Oudewater.

Residential and neighborhood statistics in Oudewater

View current location data on residents, WOZ development, housing stock, energy consumption, business activity and safety in Oudewater. In 2025 were there 8.500 residents. The average WOZ value in 2025 is EUR 415.000.

These figures help to better assess and compare the housing stock in Oudewater with recent sold homes. Orient yourself then on suitable top real estate agents in Oudewater for sales advice in this region.

Residents

8.500

Last year: 2025

Average WOZ

EUR 415.000

Last year: 2025

Average income per person.

EUR 35.200

Source: AllNumbers

Crimes (current year)

207

Total registered

Demographics and WOZ development

Inhabitants per year

Inhabitants per year in Oudewater
Year Residents
2021 8.245
2022 8.265
2023 8.340
2024 8.370
2025 8.500

Annual WOZ value

WOZ value per year in Oudewater
Year Average WOZ
2021 EUR 322.000
2022 EUR 345.000
2023 EUR 390.000
2024 EUR 394.000
2025 EUR 415.000

Composition of residents

Age build-up

65+: 1.975 0-15: 1.340 15-25: 915 25-45: 1.975 45-65: 2.285

Education level

Hoger

1.640

Praktisch

1.560

Middelbaar

2.900

Origin of residents (2025)

Europa

425

Nederland

7.385

Buiten Europa

690

Housing stock and construction periods

Types of homes

Hoekwoningen 685
Appartementen 980
Tussenwoningen 1.610
Vrijstaande woningen 408
Twee-onder-één-kap woningen 269

Construction period of buildings

Voor 1700 61
1700 tot 1900 365
1900 tot 1925 181
1925 tot 1950 219
1950 tot 1970 734
1970 tot 1980 700
1980 tot 1990 334
1990 tot 2000 335
2000 tot 2010 246
2010 tot 2020 192
2020 en later 100

Energy and sustainability

Energy label distribution

Label C

1.098

Label A

795

Label B

499

Label D

408

Label G

343

Label F

262

Label E

211

Label A+++

201

Label A+

79

Label A++

36

Label A++++

19

Label A+++++

1

Average energy consumption per year

Average energy consumption per year in Oudewater
Year Gas (m3) Electricity (kWh)
2020 1.210 2.990
2021 1.370 3.050
2022 1.060 2.820
2023 900 2.610
2024 860 2.650

Consumption per house type

Hoekwoning

Gas: 950 • Electricity: 2.640

Huurwoning

Gas: 730 • Electricity: 2.020

Koopwoning

Gas: 980 • Electricity: 2.890

Appartement

Gas: 600 • Electricity: 1.880

Tussenwoning

Gas: 860 • Electricity: 2.510

Vrijstaande woning

Gas: 1.380 • Electricity: 4.090

Twee-onder-één-kap woning

Gas: 1.240 • Electricity: 3.270

Business activity in Oudewater (2025)

Handel en HORECA 225
Nijverheid en energie 265
Zakelijke dienstverlening 345
Overheid, onderwijs en zorg 150
Landbouw, bosbouw en visserij 60
Vervoer, informatie en communicatie 80
Financiele diensten en onroerendgoed 110
Cultuur, recreatie en overige diensten 125

Total number of company establishments: 1.360

Recent crime statistics

Recent crime statistics in Oudewater
Period Crimes
jan 2025 9
jan 2026 3
jul 2025 20
jun 2025 16
mei 2025 13
mrt 2025 41
nov 2024 17
nov 2025 13
okt 2024 12
okt 2025 15
sep 2024 8
sep 2025 15

These figures give an indicative picture of safety trends in the living environment of Oudewater.

Frequently asked questions about living in Oudewater

Short answers based on current local statistics, handy for a quick comparison of the living environment.

Hoeveel inwoners heeft Oudewater?

Oudewater telt in 2025 ongeveer 8.500 inwoners.

Wat is de gemiddelde WOZ-waarde in Oudewater?

De gemiddelde WOZ-waarde in Oudewater is in 2025 circa € 415.000.

Wat is het gemiddelde inkomen per inwoner in Oudewater?

Het gemiddelde inkomen per inwoner in Oudewater ligt rond € 35.200 per jaar.

Hoe veilig is wonen in Oudewater?

Voor het huidige jaar gaat het om ongeveer 207 geregistreerde misdrijven. Gebruik deze cijfers als indicatie en vergelijk trends per periode.

Welke woningtypen komen het meest voor in Oudewater?

In Oudewater komt vooral "Tussenwoningen" veel voor, met ongeveer 1.610 woningen.

Receive free, non-binding quotes

Compare multiple real estate agents and choose the best match.