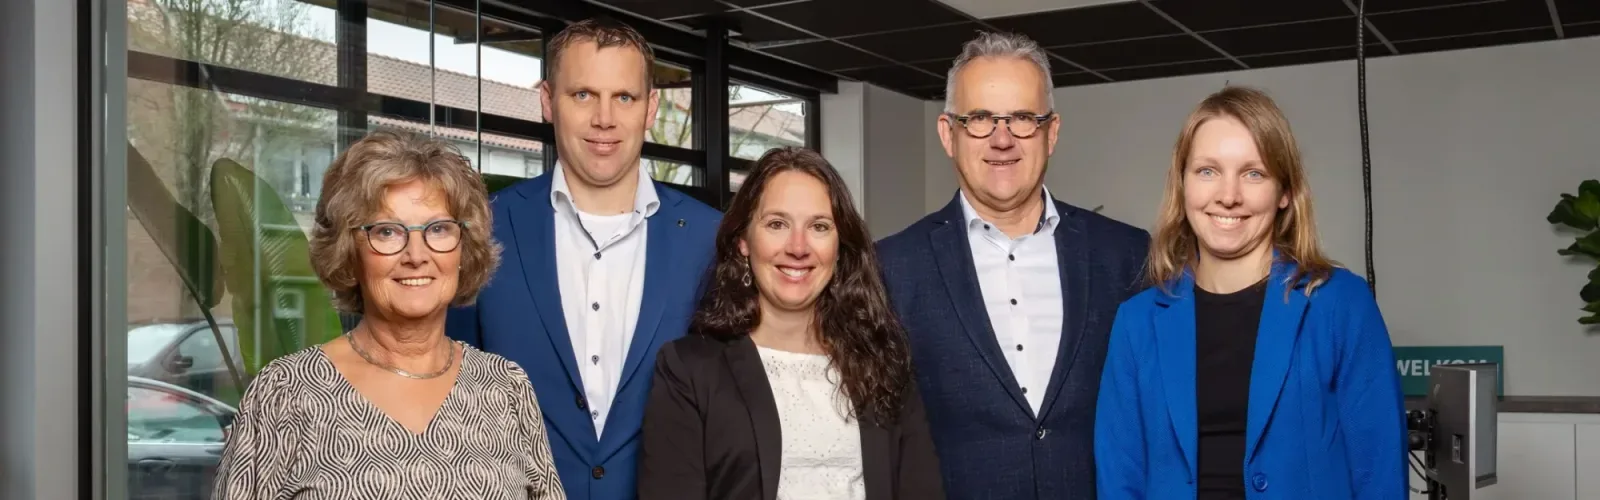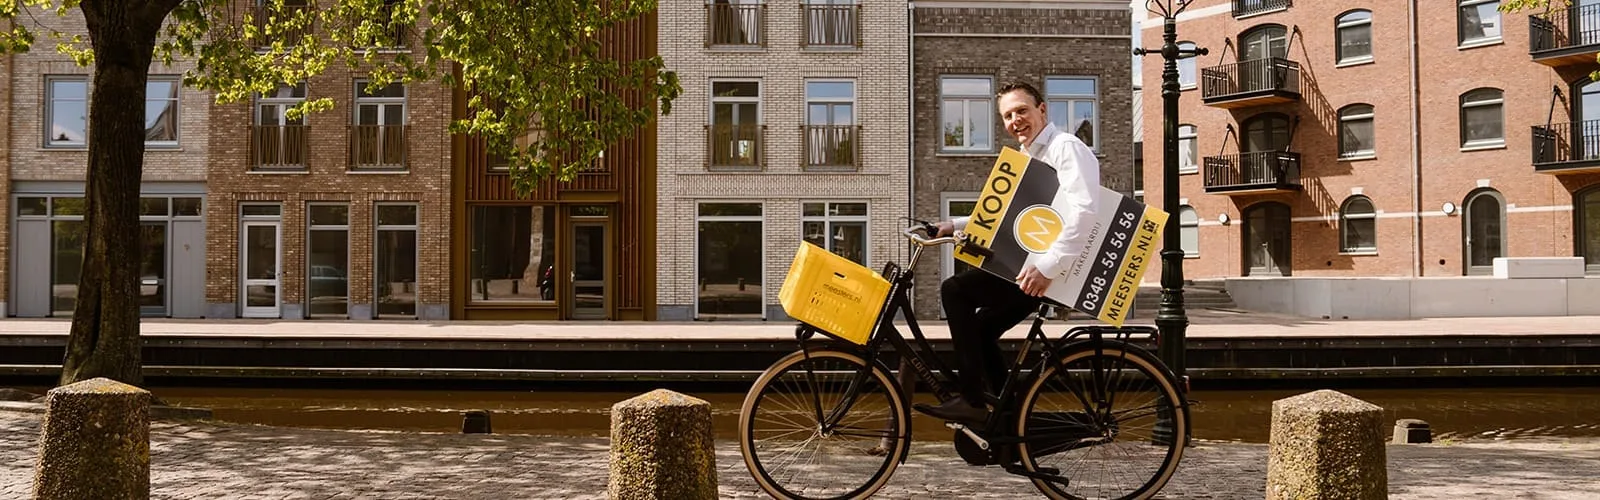

Meesters Makelaardij staat al bijna 75 jaar voor in de regio Oudewater en kent de omgeving als geen ander. Van Lopik tot Woerden en Gouda is de lokale kennis van ons team een waardevol onderdeel bij elke transactie. Of het nu gaat om de aankoop, verkoop of verhuur van een woning of bedrijfspand – wij zorgen voor persoonlijke en gedetailleerde begeleiding. Ons team is betrokken, professioneel en denkt mee met de klant. Wij geven elke tra...
Current housing stock
-

- Available
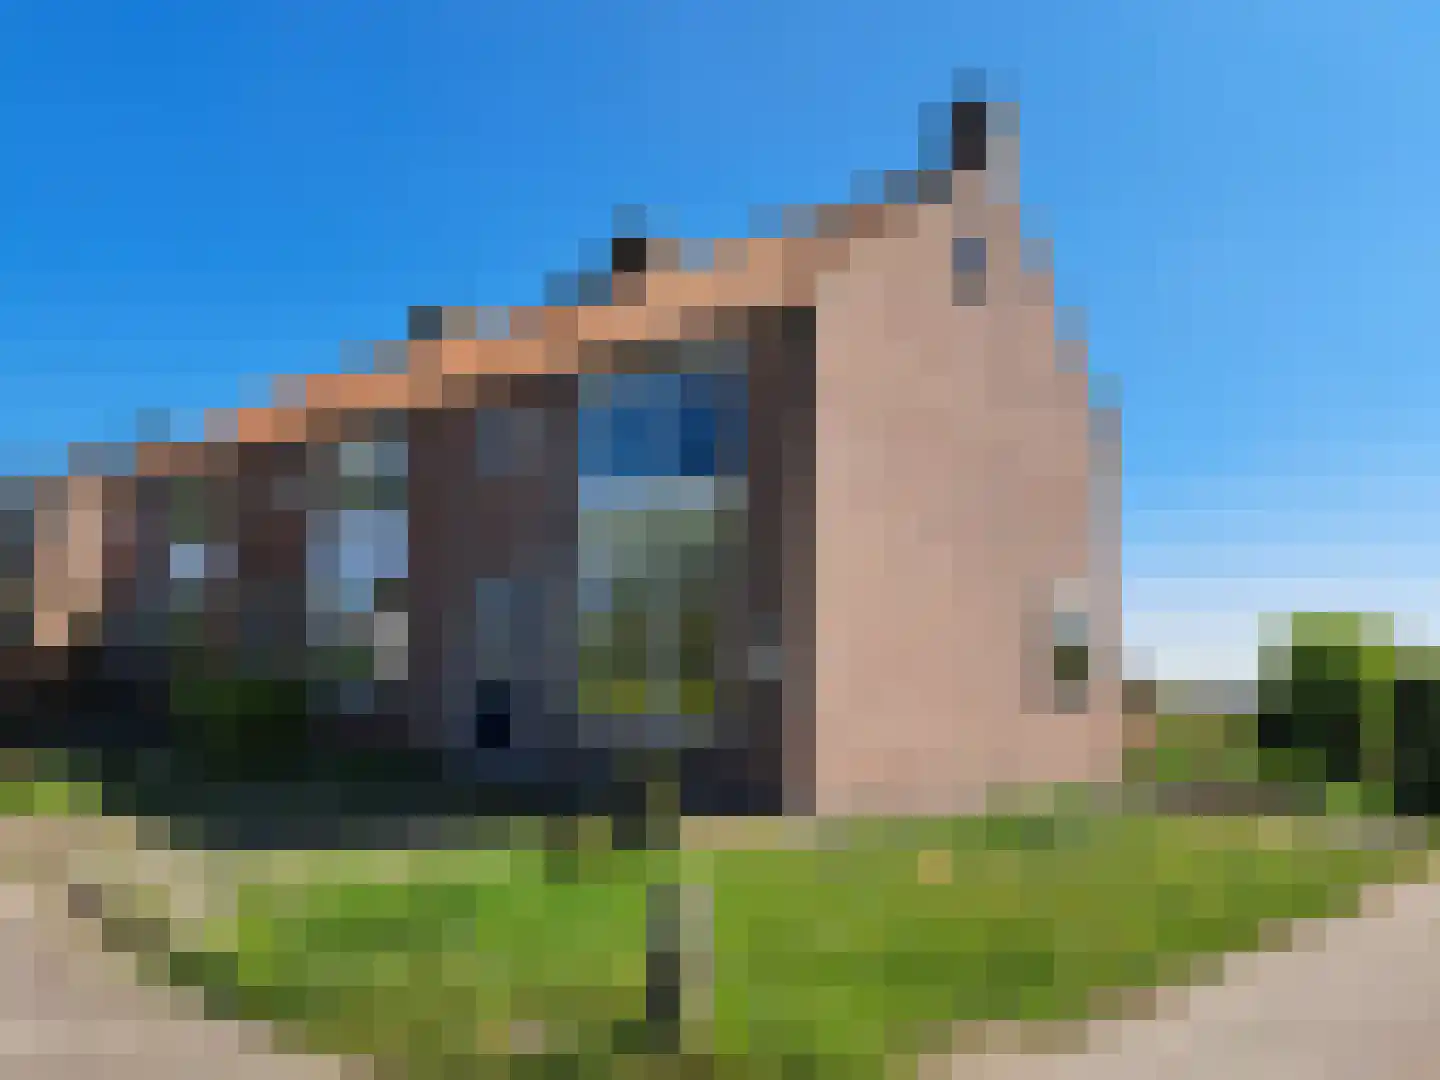
Utrechtse straatweg 5
3421GL Oudewater
€ 495.000 k.k.
ASave as favorite- Living area
- 119 m²
- Land area
- 75 m²
- Bedrooms
- 4
-

- Available
Westsingel 24
3421TJ Oudewater
€ 645.000 k.k.
€ 3.449/m²
ESave as favorite- Living area
- 187 m²
- Land area
- 346 m²
- Bedrooms
- 6
-

- Available
Goudse straatweg 9
3421GG Oudewater
€ 785.000 k.k.
CSave as favorite- Living area
- 142 m²
- Land area
- 460 m²
- Bedrooms
- 3
-

- Available
Provincialeweg Oost 56
2851AG Haastrecht
€ 895.000 k.k.
€ 5.173/m²
ESave as favorite- Living area
- 173 m²
- Land area
- 4576 m²
- Bedrooms
- 4
-

- Available
Esdoornstraat 9
2851TJ Haastrecht
€ 485.000 k.k.
€ 4.292/m²
ASave as favorite- Living area
- 113 m²
- Land area
- 143 m²
- Bedrooms
- 5
-
- Available
Strengen 67
3421JS Oudewater
€ 465.000 k.k.
€ 4.844/m²
ASave as favorite- Living area
- 96 m²
- Land area
- 107 m²
- Bedrooms
- 3
Reviews (82)
Review platforms
BronscoresTotal score
82 total reviews

Funda
42 reviews on Funda

40 reviews on Google
-
Twijnen 25
10Meesters Makelaardij heeft mij op een fijne aandachtvolle manier begeleidt bij de verkoop van mijn huis. Onder moeilijke omstandigheden heeft met name Daniël z'n uiterste best gedaan om mij ter wille te zijn. Ik beveel je dan ook Meesters Makelaardij van harte aan. Een mooi servicegericht team van mensen!
-
Alwin Beukers
10Bedankt Daniël en de rest van het team, niet alleen voor het uiteindelijke resultaat maar ook voor de uitstekende en vooral persoonlijke begeleiding en ondersteuning gedurende het gehele verkooptraject.
-
Lange Burchwal 47
8Volledig naar tevredenheid. De belofte van ontzorgen is helemaal nagekomen. Geen aanmerkingen. Top!
-
Peter Bronswijk, van
10Een zeer prettig en deskundig contact. Korte lijntjes en goed bereikbaar. We konden altijd met onze vragen terecht en kregen ook altijd snel antwoord. Een makelaar die we zeker zouden aanbevelen. Een makelaar met kennis, prettig in omgang. Met een bevlogen en betrokken team op de achtergrond met kennis en inhoud van het dossier. Ook voor de via de makelaar mede betrokken partijen in de voorbereiding op verkoop, zoals fotograaf en adviseur energielabel niets anders als lof.
-
Westerwal 21
10Het contact en de communicatie was erg professioneel. Daarnaast is de prijs zeer marktconform. Zou het zeker aanraden.
-
Papenhoeflaan 61
10Een zeer prettig en deskundig contact. Korte lijntjes en goed bereikbaar. We konden altijd met onze vragen terecht en kregen ook altijd snel antwoord. Een makelaar die we zeker zouden aanbevelen. Een makelaar met kennis, prettig in omgang. Met een bevlogen en betrokken team op de achtergrond met kennis en inhoud van het dossier. Ook voor de via de makelaar mede betrokken partijen in de voorbereiding op verkoop, zoals fotograaf en adviseur energielabel niets anders als lof. …
-
Henri Melis
10Bedankt voor de goede adviezen en deskundige begeleiding bij de verkoop van ons huis.
-
G.R. van Kinschotstraat 5
10Goede begeleiding en adviezen. Wij, wat ouder koppel, zijn zeer tevreden over de begeleiding in het proces en de deskundige (digitale) ondersteuning die we hebben gekregen.
-
Goudse straatweg 69 A
9Alles is snel en naar wens verlopen. Zeer goede communicatie met Daniël En zijn vriendelijke medewerkers. Is toch 'n hele stap na 50 jaar je huis verkopen.
-
Paardenhoeve 100
10Ongedwongen deskundig, super klantvriendelijk En natuurlijk transparant! Zowel op kantoor, als de makelaar Daniel.
-
Casa Wils
10Translated by AIMeesters Makelaardij is a nice and reliable real estate agency! All appointments were well followed up and also perfect communication. Thank you for the quick sale! With kind regards Rob Wils
-
Schakenbosdreef 6
10Translated by AIThe real estate agent has guided me everywhere and I can always turn to him with all my questions and he is open and honest.
-
Laura Stigter
10Translated by AIFine communication and everything sorted quickly!
-
Hidde P
10Translated by AIDaniel and his team are very friendly. Well assisted and advised with the buying/selling of our house.
-
R. Snellius van Rooijenstraat 3
10Translated by AIVery good contact with the real estate agent. Every day we received an update, which worked very well for us. For further questions, we also got quick responses.
-
Joostenplein 8
9Translated by AIEverything has gone smoothly and as desired. The agreements have been fulfilled and we have the impression that the real estate agent has contributed to a good yield.
-
Ro
10Translated by AIVery nice experience with this real estate agent! The sale of my house went quickly and smoothly. Everything was clearly explained, there was good contact and they really thought along. I also received valuable advice about the house's interior for the sale. Absolutely a recommendation!
-
Peperstraat 8
10Translated by AIAfter every viewing, properly and quickly followed up, very good communication and expert advice, I am very satisfied with the way things are going!
-
Ambachtsdreef 13
10Translated by AIThe contact is good with the real estate agent and the entire handling during the sale was prime. we are very satisfied.
-
J Severs
10