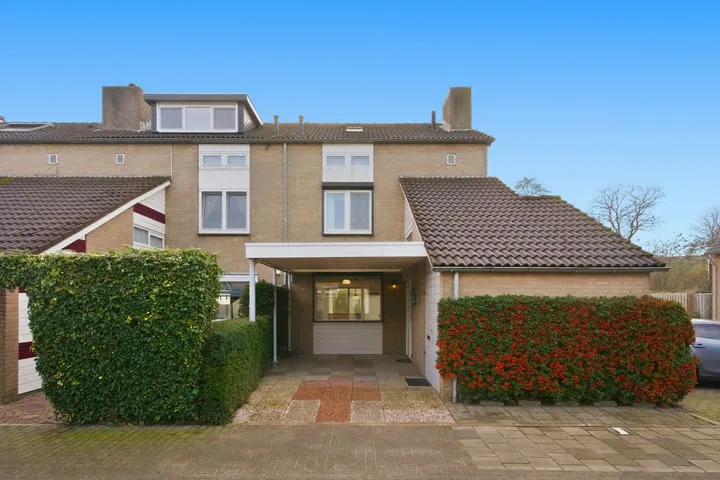
Houses sold in Ravenstein

View 23 sold houses in Ravenstein

Connected to: Vastgoed Nederland NVM Makelaars

On this page you will find recently sold homes in Ravenstein. Use this overview to better estimate selling prices, popular neighborhoods, and the local housing supply before you choose a real estate agent. Also view the current housing supply with 35 houses in Ravenstein.

Selection

Search and filter homes

Set your preferences and discover homes that suit you.

Total supply 241.131
Filters

Set price, area and other characteristics. Adjust a filter or click on Show homes. Location changes directly above.

Reset filters

You search for

  • Place Ravenstein
  • Status Sold

Sell your house in Ravenstein? Compare real estate agents

View recent sales and receive free quotes from local real estate agents. Compare more than 34 real estate agents in Ravenstein.

Free request a quote

  • Quotes in Ravenstein
  • Non-binding
  • Personal
  • Compare free rates

Selling your own home in Ravenstein? Compare real estate agents in Ravenstein or view the best real estate agents in Ravenstein as a reference for your choice.

Compare multiple quotes

Real estate agents make sharper offers when they know you're comparing — ask for quotes for sale or purchase.

Frequently asked questions about sold homes in Ravenstein

Short answers about housing prices, sold homes and comparing real estate agents in Ravenstein.

Residential and neighborhood statistics in Ravenstein

View current location data on residents, WOZ development, housing stock, energy consumption, business activity and safety in Ravenstein. In 2025 were there 3.200 residents. The average WOZ value in 2025 is EUR 384.338.

These figures help to better assess and compare the housing stock in Ravenstein with recent sold homes. Orient yourself then on suitable top real estate agents in Ravenstein for sales advice in this region.

Residents

3.200

Last year: 2025

Average WOZ

EUR 384.338

Last year: 2025

Average income per person.

EUR 31.566

Source: AllNumbers

Crimes (current year)

131

Total registered

Demographics and WOZ development

Inhabitants per year

Inhabitants per year in Ravenstein
Year Residents
2021 3.065
2022 3.130
2023 3.175
2024 3.155
2025 3.200

Annual WOZ value

WOZ value per year in Ravenstein
Year Average WOZ
2021 EUR 267.710
2022 EUR 300.154
2023 EUR 341.099
2024 EUR 364.966
2025 EUR 384.338

Composition of residents

Age build-up

65+: 830 0-15: 415 15-25: 355 25-45: 710 45-65: 875

Education level

Hoger

790

Praktisch

550

Middelbaar

1.060

Origin of residents (2025)

Europa

215

Nederland

2.675

Buiten Europa

310

Housing stock and construction periods

Types of homes

Hoekwoningen 364
Appartementen 322
Tussenwoningen 574
Vrijstaande woningen 197
Twee-onder-één-kap woningen 188

Construction period of buildings

Voor 1700 30
1700 tot 1900 65
1900 tot 1925 41
1925 tot 1950 62
1950 tot 1970 436
1970 tot 1980 283
1980 tot 1990 227
1990 tot 2000 133
2000 tot 2010 101
2010 tot 2020 20
2020 en later 95

Energy and sustainability

Energy label distribution

Label C

510

Label B

281

Label A

269

Label D

129

Label F

98

Label G

81

Label E

77

Label A+++

69

Label A++

25

Label A+

21

Label A++++

6

Label A+++++

0

Average energy consumption per year

Average energy consumption per year in Ravenstein
Year Gas (m3) Electricity (kWh)
2020 1.343 3.014
2021 1.547 3.018
2022 1.189 2.768
2023 984 2.626
2024 963 2.675

Consumption per house type

Hoekwoning

Gas: 967 • Electricity: 2.506

Huurwoning

Gas: 759 • Electricity: 2.041

Koopwoning

Gas: 1.120 • Electricity: 2.958

Appartement

Gas: 593 • Electricity: 1.966

Tussenwoning

Gas: 934 • Electricity: 2.546

Vrijstaande woning

Gas: 1.519 • Electricity: 3.590

Twee-onder-één-kap woning

Gas: 1.033 • Electricity: 2.687

Business activity in Ravenstein (2025)

Handel en HORECA 100
Nijverheid en energie 85
Zakelijke dienstverlening 145
Overheid, onderwijs en zorg 110
Landbouw, bosbouw en visserij 5
Vervoer, informatie en communicatie 25
Financiele diensten en onroerendgoed 25
Cultuur, recreatie en overige diensten 55

Total number of company establishments: 550

Recent crime statistics

Recent crime statistics in Ravenstein
Period Crimes
jan 2025 11
jan 2026 11
jul 2025 9
jun 2025 8
mei 2025 15
mrt 2025 10
nov 2024 13
nov 2025 19
okt 2024 17
okt 2025 6
sep 2024 17
sep 2025 14

These figures give an indicative picture of safety trends in the living environment of Ravenstein.

Frequently asked questions about living in Ravenstein

Short answers based on current local statistics, handy for a quick comparison of the living environment.

Hoeveel inwoners heeft Ravenstein?

Ravenstein telt in 2025 ongeveer 3.200 inwoners.

Wat is de gemiddelde WOZ-waarde in Ravenstein?

De gemiddelde WOZ-waarde in Ravenstein is in 2025 circa € 384.338.

Wat is het gemiddelde inkomen per inwoner in Ravenstein?

Het gemiddelde inkomen per inwoner in Ravenstein ligt rond € 31.566 per jaar.

Hoe veilig is wonen in Ravenstein?

Voor het huidige jaar gaat het om ongeveer 131 geregistreerde misdrijven. Gebruik deze cijfers als indicatie en vergelijk trends per periode.

Welke woningtypen komen het meest voor in Ravenstein?

In Ravenstein komt vooral "Tussenwoningen" veel voor, met ongeveer 574 woningen.

Receive free, non-binding quotes

Compare multiple real estate agents and choose the best match.