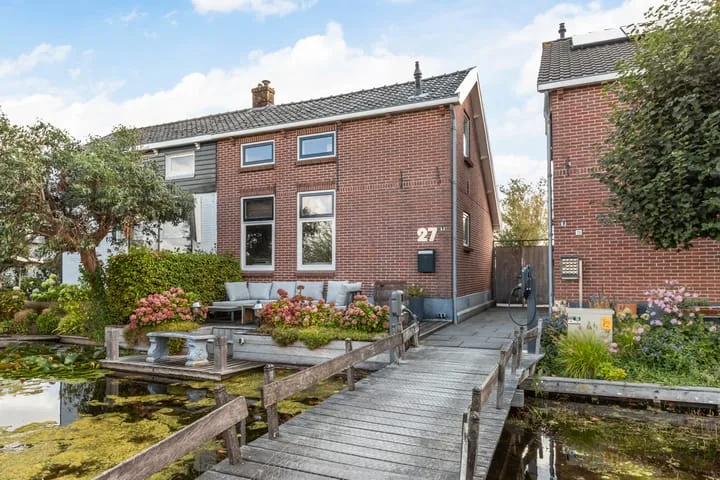
- Sold
De Jongstraat 6
2811KS Reeuwijk
€ 419.000 k.k.
€ 4.232/m²
- Living area
- 99 m²
- Land area
- 118 m²
- Bedrooms
- 4
View 84 sold houses in Reeuwijk
Type to search. Use arrow down and arrow up to navigate through results and press Enter to open.
Hidden search suggestions.
Compare sold homes in Reeuwijk or view the current offering in this location directly.
On this page you will find recently sold homes in Reeuwijk. Use this overview to better estimate selling prices, popular neighborhoods, and the local housing supply before you choose a real estate agent. Also view the current housing supply with 126 houses in Reeuwijk.
2811KS Reeuwijk
€ 419.000 k.k.
€ 4.232/m²
2811LJ Reeuwijk
€ 529.000 k.k.
€ 4.809/m²
2811SC Reeuwijk
€ 539.500 k.k.
€ 4.056/m²
2811GV Reeuwijk
€ 795.000 k.k.
€ 4.937/m²
2811EV Reeuwijk
€ 575.000 k.k.
€ 4.956/m²
2811GR Reeuwijk
€ 990.000 k.k.
€ 5.103/m²
2811LK Reeuwijk
€ 575.000 k.k.
€ 4.423/m²
2811SE Reeuwijk
€ 760.000 k.k.
€ 6.333/m²
2811AJ Reeuwijk
€ 585.000 k.k.
€ 4.500/m²
2811ES Reeuwijk
€ 1.085.000 k.k.
€ 7.483/m²
2811VZ Reeuwijk
€ 420.000 k.k.
€ 3.684/m²
2811LX Reeuwijk
€ 825.000 k.k.
€ 4.661/m²
2811WC Reeuwijk
€ 510.000 k.k.
€ 4.594/m²
2811EP Reeuwijk
€ 265.000 k.k.
€ 3.840/m²
2811GJ Reeuwijk
€ 1.450.000 k.k.
€ 9.354/m²
2811JC Reeuwijk
€ 500.000 k.k.
€ 4.545/m²
2811ES Reeuwijk
€ 1.000.000 k.k.
€ 6.451/m²
2811SV Reeuwijk
€ 550.000 k.k.
€ 5.140/m²
2811PV Reeuwijk
€ 395.000 k.k.
€ 5.064/m²
2811SL Reeuwijk
€ 315.000 k.k.
€ 4.632/m²
2811KL Reeuwijk
€ 599.000 k.k.
€ 5.759/m²
2811AM Reeuwijk
€ 450.000 k.k.
€ 3.461/m²
2811LL Reeuwijk
€ 689.000 k.k.
€ 4.445/m²
2811ES Reeuwijk
€ 425.000 k.k.
€ 7.083/m²
2811BE Reeuwijk
€ 639.000 k.k.
€ 0/m²
2811AL Reeuwijk
€ 575.000 k.k.
€ 0/m²
2811SE Reeuwijk
€ 750.000 k.k.
€ 7.281/m²
2811EV Reeuwijk
€ 485.000 k.k.
€ 6.643/m²
Bekijk recente verkopen en ontvang gratis offertes van lokale makelaars. Vergelijk meer dan 54 makelaars in Reeuwijk.
Recent verkocht in Reeuwijk? Lees de verkoopgerichte gids huis verkopen in Reeuwijk, vergelijk verkoopmakelaars in Reeuwijk of bekijk de beste verkoopmakelaars in Reeuwijk voor referentie bij jouw keuze.
Makelaars maken scherpere voorstellen als ze weten dat je vergelijkt — vraag offertes aan voor verkoop of aankoop.
Short answers about housing prices, sold homes and comparing real estate agents in Reeuwijk.
De kosten van een makelaar in Reeuwijk verschillen per kantoor, woningtype en verkoopaanpak. In Reeuwijk kun je 54 real estate agents vergelijken; bekijk daarom ook de makelaars in Reeuwijk om tarieven, presentatie en lokale ervaring beter naast elkaar te zetten.
On this page we currently show 84 sold houses in Reeuwijk from our selection. This helps you to better assess recent transactions and the local housing market.
Houses sold in Reeuwijk give insight into asking prices, house types and neighborhoods where recent transactions have taken place. Compare this also with the current housing stock in Reeuwijk to better understand the market.
Je kunt verkochte woningen gebruiken als eerste marktindicatie, maar een lokale makelaar kan beter rekening houden met afwerking, ligging, onderhoud en actuele vraag in Reeuwijk. Plan de volgende stap via de gids huis verkopen in Reeuwijk.
Vergelijk de 54 real estate agents in Reeuwijk op lokale verkoopervaring, reviews, verwachte opbrengst, courtage en marketingaanpak. Bekijk verkoopmakelaars in Reeuwijk of de top 10 makelaars in Reeuwijk om snel sterke kantoren te ontdekken.
View current location data on residents, WOZ development, housing stock, energy consumption, business activity and safety in Reeuwijk. In 2025 were there 11.285 residents. The average WOZ value in 2025 is EUR 560.971.
These figures help to better assess and compare the housing stock in Reeuwijk with recent sold homes. Orient yourself then on suitable top real estate agents in Reeuwijk for sales advice in this region.
Residents
11.285
Last year: 2025
Average WOZ
EUR 560.971
Last year: 2025
Average income per person.
EUR 32.326
Source: AllNumbers
Crimes (current year)
505
Total registered
| Year | Residents |
|---|---|
| 2021 | 10.555 |
| 2022 | 10.635 |
| 2023 | 10.980 |
| 2024 | 11.130 |
| 2025 | 11.285 |
| Year | Average WOZ |
|---|---|
| 2021 | EUR 420.361 |
| 2022 | EUR 454.211 |
| 2023 | EUR 514.279 |
| 2024 | EUR 536.561 |
| 2025 | EUR 560.971 |
Hoger
2.930
Praktisch
1.990
Middelbaar
3.170
Europa
1.015
Nederland
9.175
Buiten Europa
1.085
Label A
1.712
Label C
1.233
Label B
653
Label D
537
Label G
321
Label E
269
Label F
229
Label A+++
129
Label A+
61
Label A++
42
Label A++++
20
Label A+++++
1
| Year | Gas (m3) | Electricity (kWh) |
|---|---|---|
| 2020 | 1.330 | 3.168 |
| 2021 | 1.507 | 3.293 |
| 2022 | 1.114 | 3.067 |
| 2023 | 935 | 2.928 |
| 2024 | 915 | 3.001 |
Hoekwoning
Gas: 948 • Electricity: 2.970
Huurwoning
Gas: 740 • Electricity: 2.113
Koopwoning
Gas: 1.023 • Electricity: 3.231
Appartement
Gas: 656 • Electricity: 2.002
Tussenwoning
Gas: 827 • Electricity: 2.568
Vrijstaande woning
Gas: 1.307 • Electricity: 4.197
Twee-onder-één-kap woning
Gas: 1.114 • Electricity: 3.216
Total number of company establishments: 2.000
| Period | Crimes |
|---|---|
| jan 2025 | 46 |
| jan 2026 | 35 |
| jul 2025 | 41 |
| jun 2025 | 43 |
| mei 2025 | 47 |
| mrt 2025 | 33 |
| nov 2024 | 55 |
| nov 2025 | 66 |
| okt 2024 | 39 |
| okt 2025 | 39 |
| sep 2024 | 57 |
| sep 2025 | 27 |
These figures give an indicative picture of safety trends in the living environment of Reeuwijk.
Short answers based on current local statistics, handy for a quick comparison of the living environment.
Reeuwijk telt in 2025 ongeveer 11.285 inwoners.
De gemiddelde WOZ-waarde in Reeuwijk is in 2025 circa € 560.971.
Het gemiddelde inkomen per inwoner in Reeuwijk ligt rond € 32.326 per jaar.
Voor het huidige jaar gaat het om ongeveer 505 geregistreerde misdrijven. Gebruik deze cijfers als indicatie en vergelijk trends per periode.
In Reeuwijk komt vooral "Tussenwoningen" veel voor, met ongeveer 1.779 woningen.