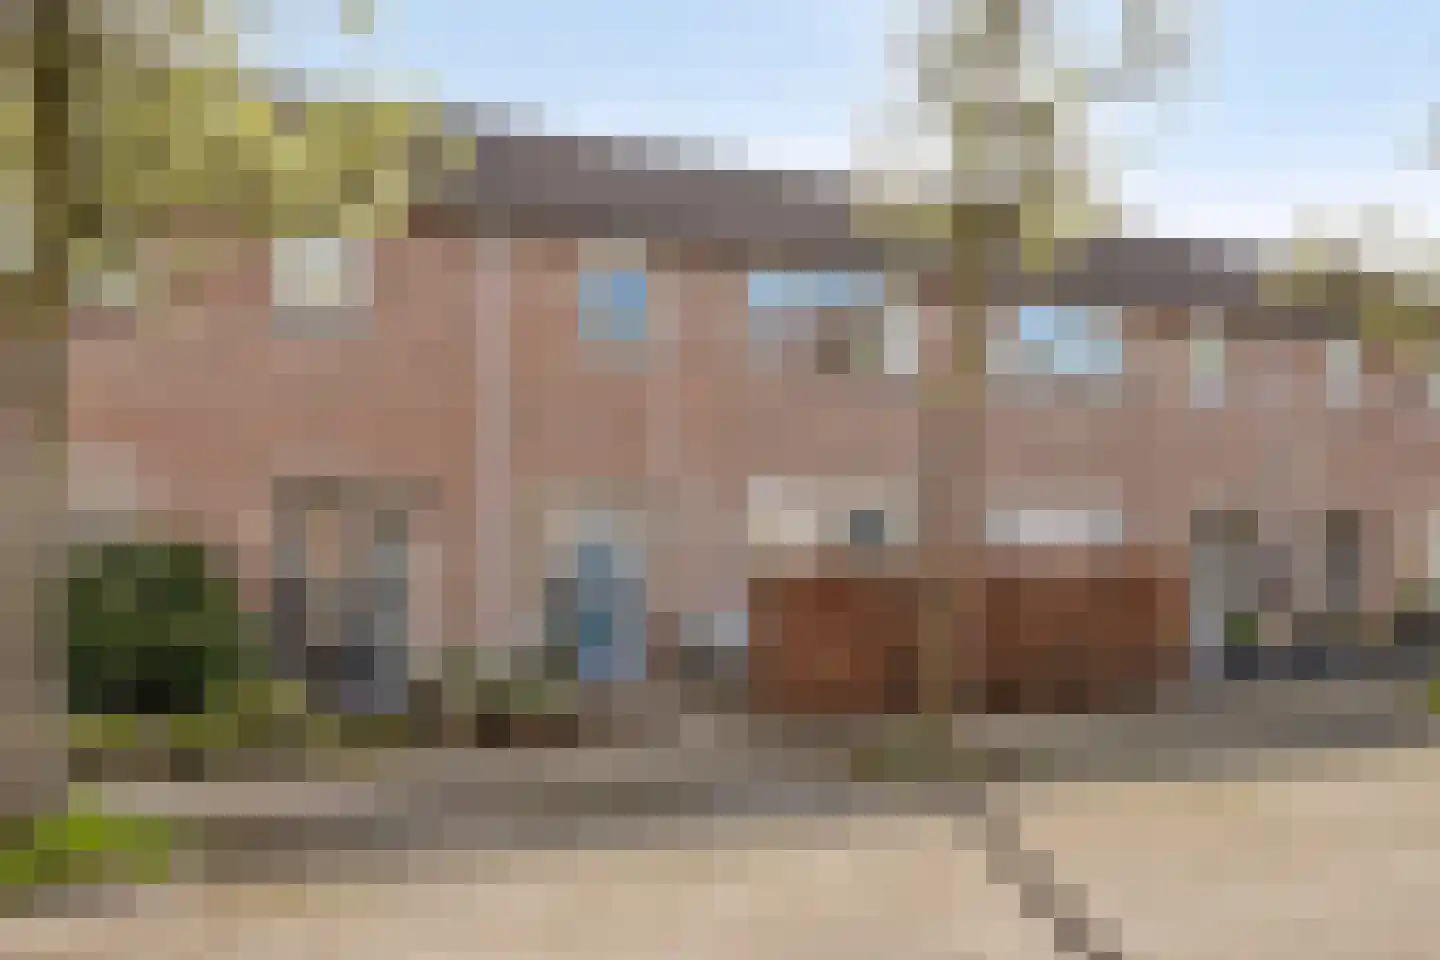
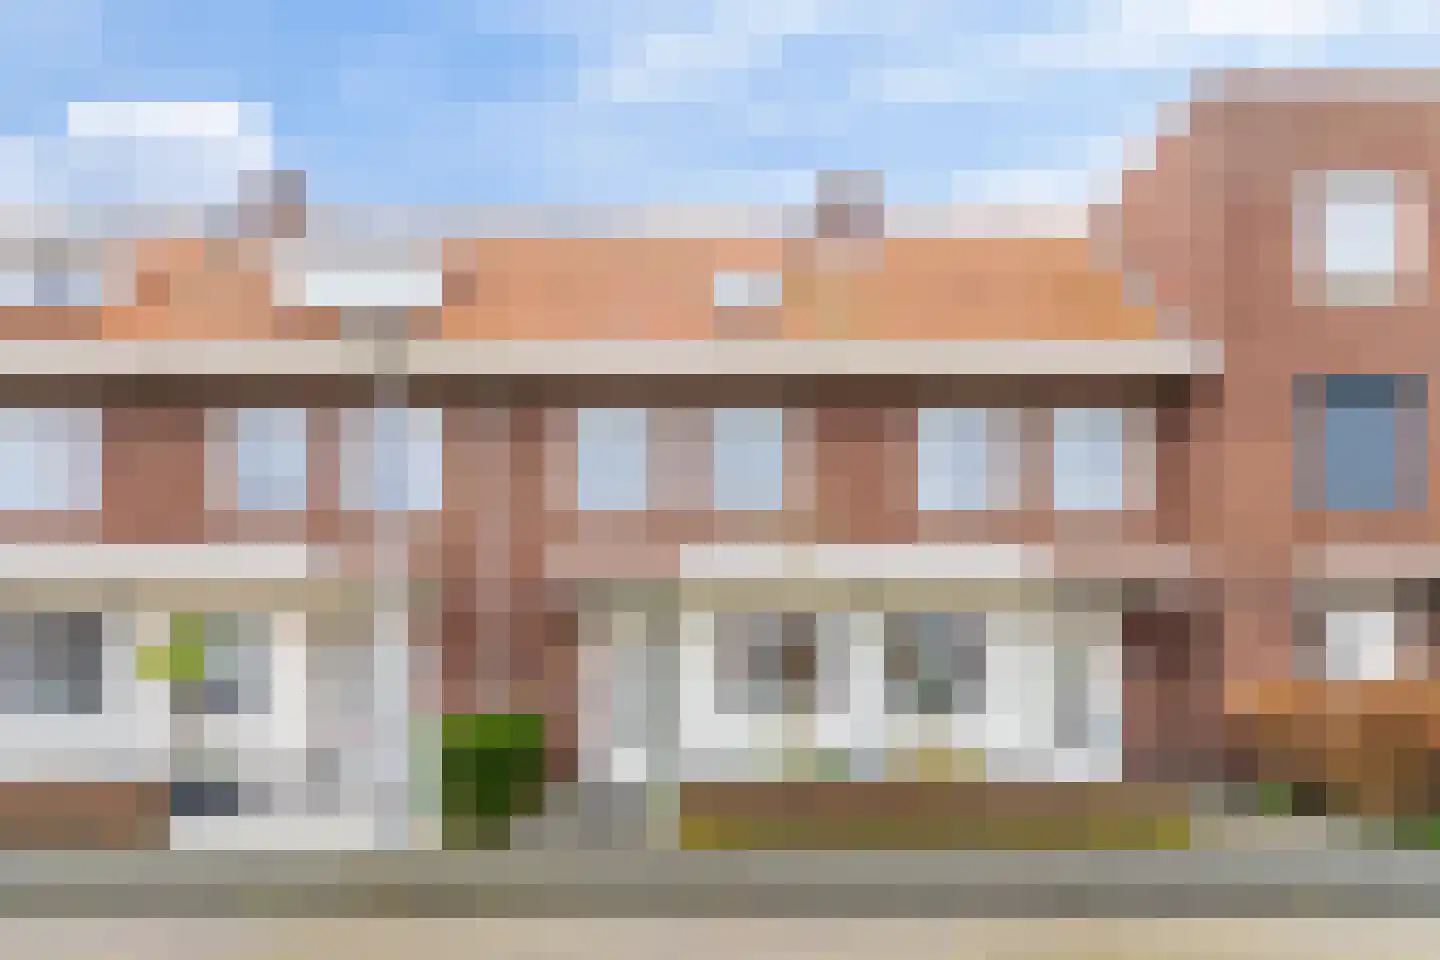
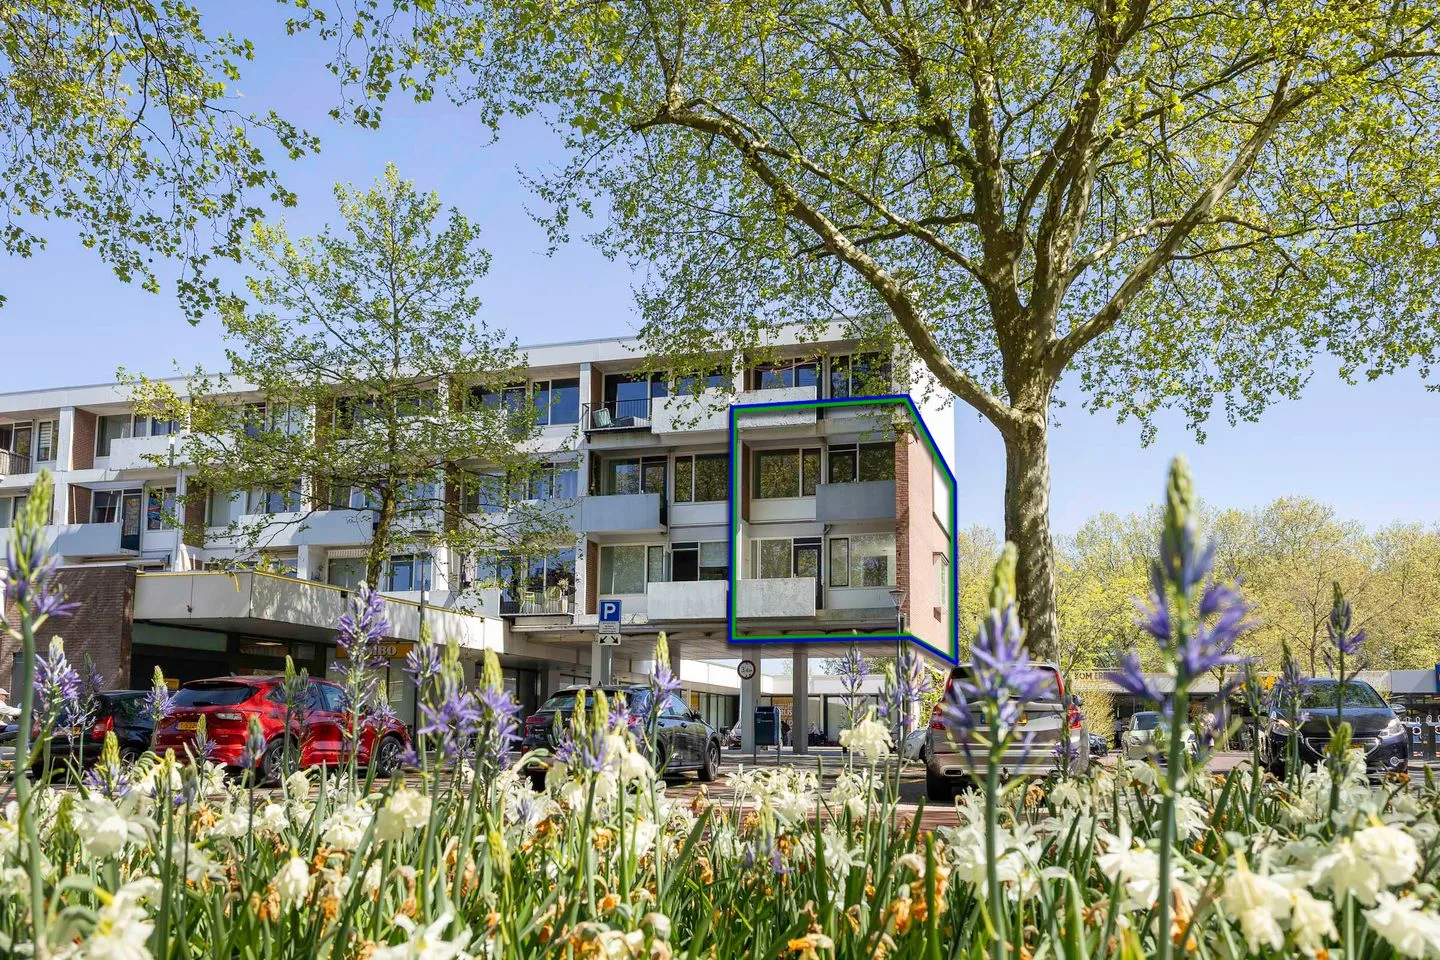
- Sold
Poelruitstraat 20
5247HS Rosmalen
€ 515.000 k.k.
€ 4.364/m²
- Living area
- 118 m²
- Land area
- 164 m²
- Bedrooms
- 4
Searching in 480 houses in Rosmalen
Type to search. Use arrow down and arrow up to navigate through results and press Enter to open.
Hidden search suggestions.
View current properties in Rosmalen or search targeted on street, postal code and property characteristics.
View the current housing stock in Rosmalen and quickly filter by price, living area, rooms and more. There are currently 480 houses in this place within our selection. View also 361 sold houses in Rosmalen for extra insight into the local housing market.
5247HS Rosmalen
€ 515.000 k.k.
€ 4.364/m²
5247SB Rosmalen
€ 425.000 k.k.
€ 5.312/m²
5246BT Rosmalen
€ 615.000 k.k.
€ 6.089/m²
5247MP Rosmalen
€ 569.000 k.k.
€ 4.589/m²
5247LA Rosmalen
€ 600.000 k.k.
€ 3.030/m²
5246EA Rosmalen
€ 32.500 k.k.
5246XD Rosmalen
€ 795.000 k.k.
€ 4.760/m²
5247MH Rosmalen
€ 675.000 k.k.
€ 4.688/m²
5246CC Rosmalen
€ 439.500 k.k.
€ 3.995/m²
5246GT Rosmalen
€ 425.000 k.k.
€ 3.899/m²
5246VP Rosmalen
€ 285.000 k.k.
€ 3.904/m²
5246EK Rosmalen
€ 425.000 k.k.
€ 3.632/m²
5243TD Rosmalen
€ 449.500 k.k.
€ 6.158/m²
5242CB Rosmalen
€ 449.000 k.k.
€ 4.677/m²
5247WP Rosmalen
€ 475.000 k.k.
€ 4.439/m²
5245AX Rosmalen
€ 449.000 k.k.
€ 4.880/m²
5246AG Rosmalen
€ 795.000 k.k.
€ 5.483/m²
5246EL Rosmalen
€ 559.000 k.k.
€ 3.516/m²
5247KT Rosmalen
€ 600.000 k.k.
€ 4.286/m²
5246ED Rosmalen
€ 450.000 k.k.
€ 4.688/m²
5246VB Rosmalen
€ 385.000 k.k.
€ 4.278/m²
5246AK Rosmalen
€ 925.000 k.k.
€ 5.000/m²
5245BA Rosmalen
€ 565.000 k.k.
€ 4.484/m²
5246RA Rosmalen
€ 575.000 k.k.
€ 4.600/m²
5242AT Rosmalen
€ 598.000 k.k.
€ 4.530/m²
5245AP Rosmalen
€ 895.000 k.k.
€ 4.890/m²
5247KG Rosmalen
€ 925.000 k.k.
€ 4.512/m²
5246XA Rosmalen
€ 819.000 k.k.
€ 5.978/m²
Get free quotes from real estate agents with local market knowledge. Compare more than 88 real estate agents in Rosmalen.
Selling a home in Rosmalen? View the sales-oriented guide sell a house in Rosmalen, compare all real estate agents in Rosmalen or view the top 10 real estate agents in Rosmalen for extra context to your choice.
Real estate agents make sharper offers when they know you're comparing — ask for quotes for sale or purchase.
Practical answers about housing supply, sales and comparing real estate agents in Rosmalen.
The costs of a real estate agent in Rosmalen depend on commission, setup costs, property presentation and the chosen service. Compare the 88 real estate agents in Rosmalen via the real estate agent page and request multiple quotes to compare rates and approach well.
Within our selection, we are currently showing 480 houses in Rosmalen. View also the sold houses in Rosmalen to compare the current offering with recent transactions.
Take into account not only price and living area but also maintenance, energy label, location, outdoor space and sales status. This way you compare houses in Rosmalen on more than just the asking price.
A local real estate agent knows the neighborhoods, recent transactions and demand in Rosmalen. By comparing 88 real estate agents in the region you get a better insight into prices, sales strategy and expected yield; the top 10 in Rosmalen provides a useful starting point.
Yes, when making a sales plan, a valuation in Rosmalen is wise. You gain insight into a realistic asking price and can then compare offers from real estate agents specifically.
View current location data on residents, WOZ development, housing stock, energy consumption, business activity and safety in Rosmalen. In 2025 were there 39.915 residents. The average WOZ value in 2025 is EUR 489.295.
These figures help to better assess and compare the housing stock in Rosmalen with recent sold homes. Orient yourself then on suitable top real estate agents in Rosmalen for sales advice in this region.
Residents
39.915
Last year: 2025
Average WOZ
EUR 489.295
Last year: 2025
Average income per person.
EUR 20.422
Source: AllNumbers
Crimes (current year)
1.342
Total registered
| Year | Residents |
|---|---|
| 2021 | 37.184 |
| 2022 | 37.569 |
| 2023 | 38.375 |
| 2024 | 39.237 |
| 2025 | 39.915 |
| Year | Average WOZ |
|---|---|
| 2021 | EUR 368.816 |
| 2022 | EUR 392.907 |
| 2023 | EUR 461.553 |
| 2024 | EUR 473.295 |
| 2025 | EUR 489.295 |
Hoger
11.790
Praktisch
5.950
Middelbaar
10.210
Europa
2.395
Nederland
33.185
Buiten Europa
4.345
Label A
5.212
Label C
4.654
Label B
2.540
Label D
1.375
Label A+++
1.024
Label F
702
Label A+
592
Label E
461
Label G
416
Label A++++
385
Label A++
272
Label A+++++
4
| Year | Gas (m3) | Electricity (kWh) |
|---|---|---|
| 2020 | 1.208 | 3.275 |
| 2021 | 1.370 | 3.329 |
| 2022 | 1.065 | 3.118 |
| 2023 | 887 | 2.950 |
| 2024 | 842 | 3.015 |
Hoekwoning
Gas: 917 • Electricity: 2.982
Huurwoning
Gas: 659 • Electricity: 2.156
Koopwoning
Gas: 972 • Electricity: 3.253
Appartement
Gas: 506 • Electricity: 1.807
Tussenwoning
Gas: 833 • Electricity: 2.770
Vrijstaande woning
Gas: 1.325 • Electricity: 4.302
Twee-onder-één-kap woning
Gas: 1.031 • Electricity: 3.312
Total number of company establishments: 5.720
| Period | Crimes |
|---|---|
| jan 2025 | 100 |
| jan 2026 | 83 |
| jul 2025 | 113 |
| jun 2025 | 104 |
| mei 2025 | 121 |
| mrt 2025 | 103 |
| nov 2024 | 114 |
| nov 2025 | 81 |
| okt 2024 | 123 |
| okt 2025 | 141 |
| sep 2024 | 97 |
| sep 2025 | 122 |
These figures give an indicative picture of safety trends in the living environment of Rosmalen.
Short answers based on current local statistics, handy for a quick comparison of the living environment.
Rosmalen telt in 2025 ongeveer 39.915 inwoners.
De gemiddelde WOZ-waarde in Rosmalen is in 2025 circa € 489.295.
Het gemiddelde inkomen per inwoner in Rosmalen ligt rond € 20.422 per jaar.
Voor het huidige jaar gaat het om ongeveer 1.342 geregistreerde misdrijven. Gebruik deze cijfers als indicatie en vergelijk trends per periode.
In Rosmalen komt vooral "Tussenwoningen" veel voor, met ongeveer 6.654 woningen.