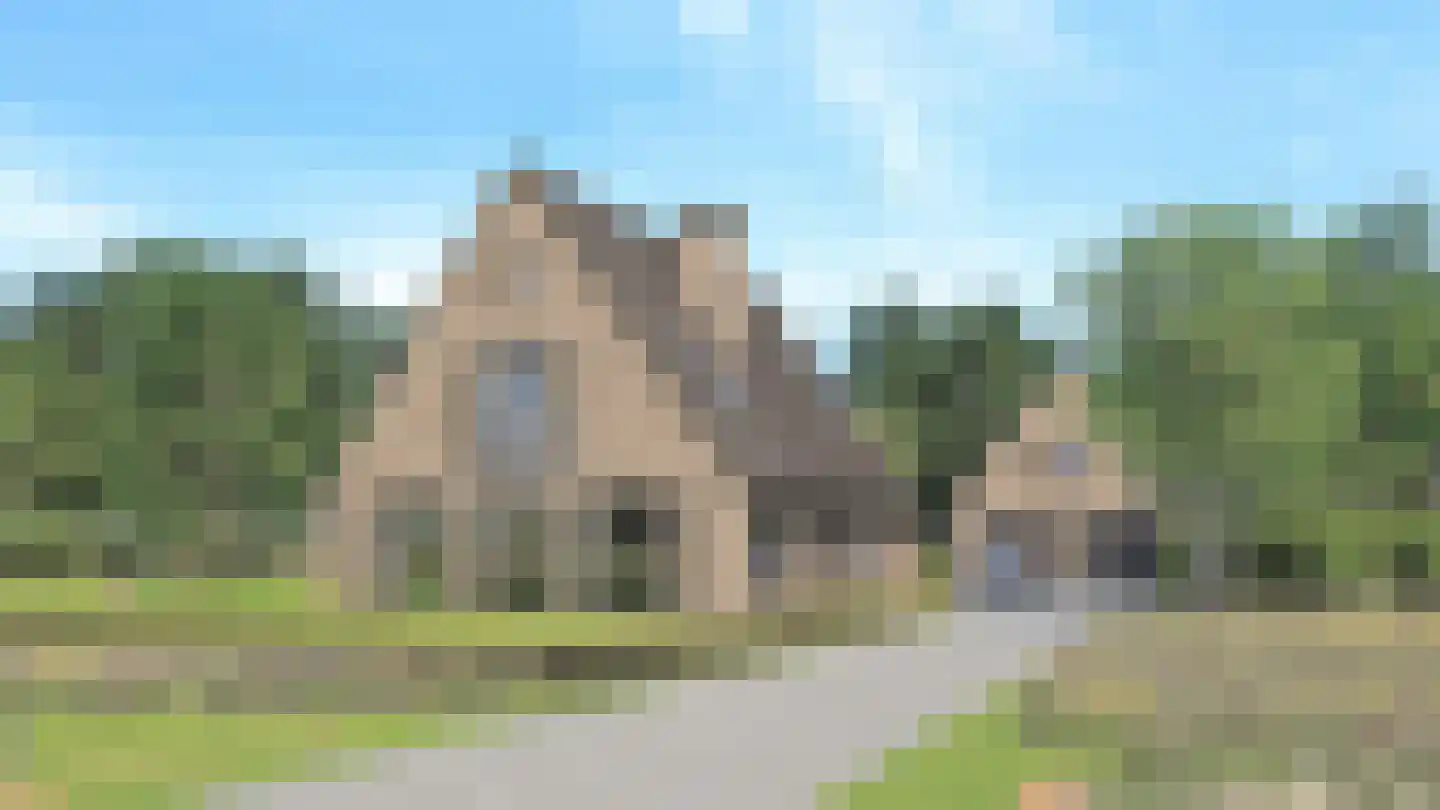
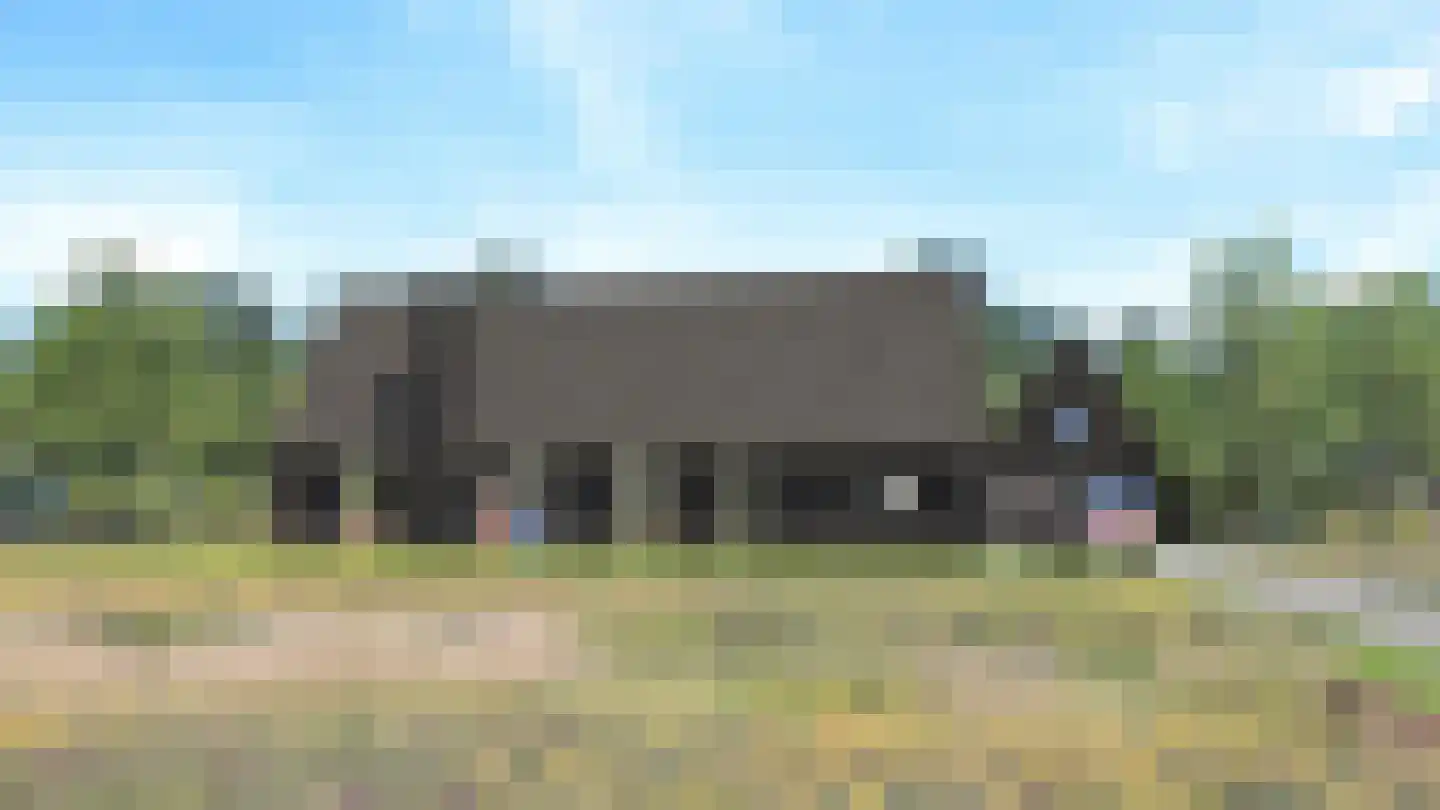
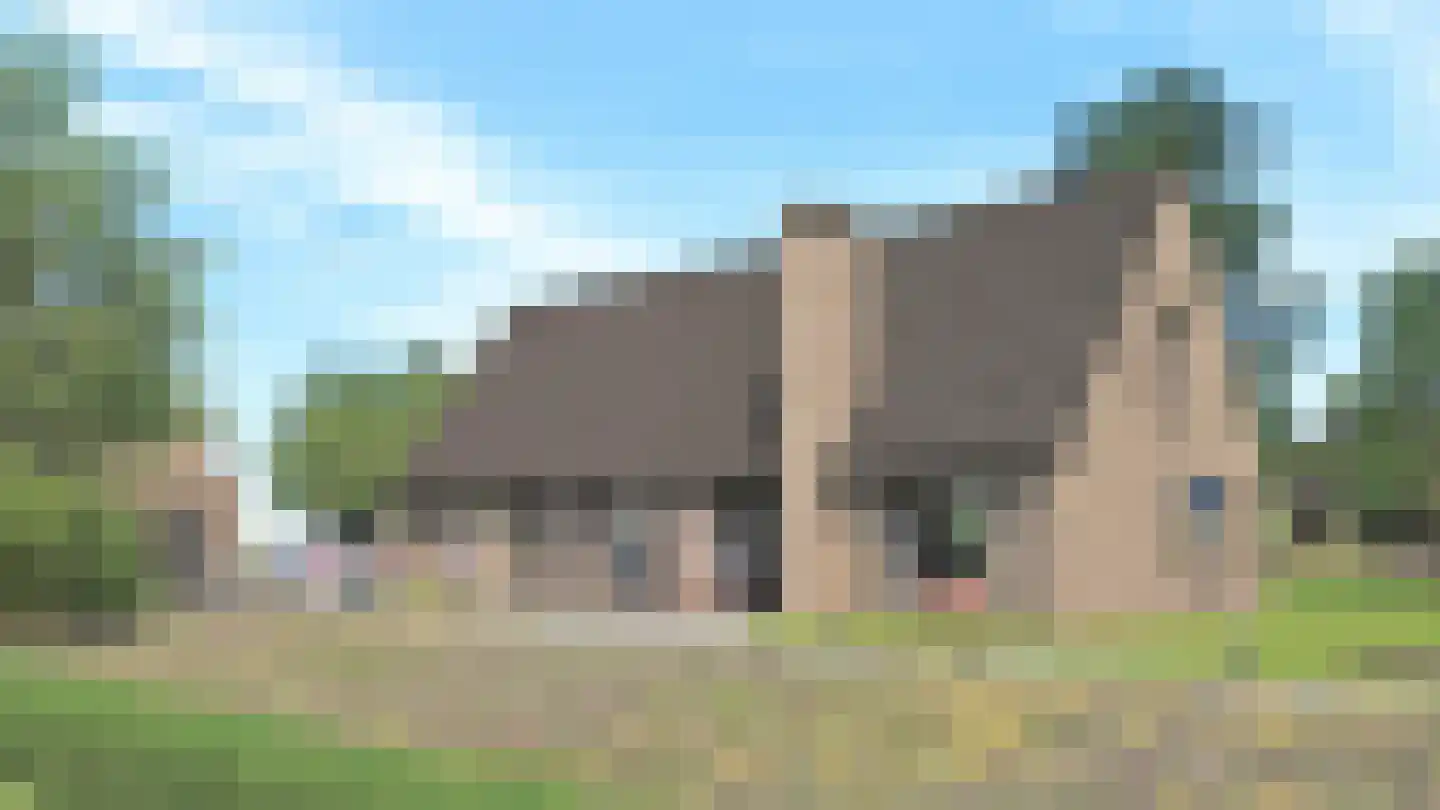
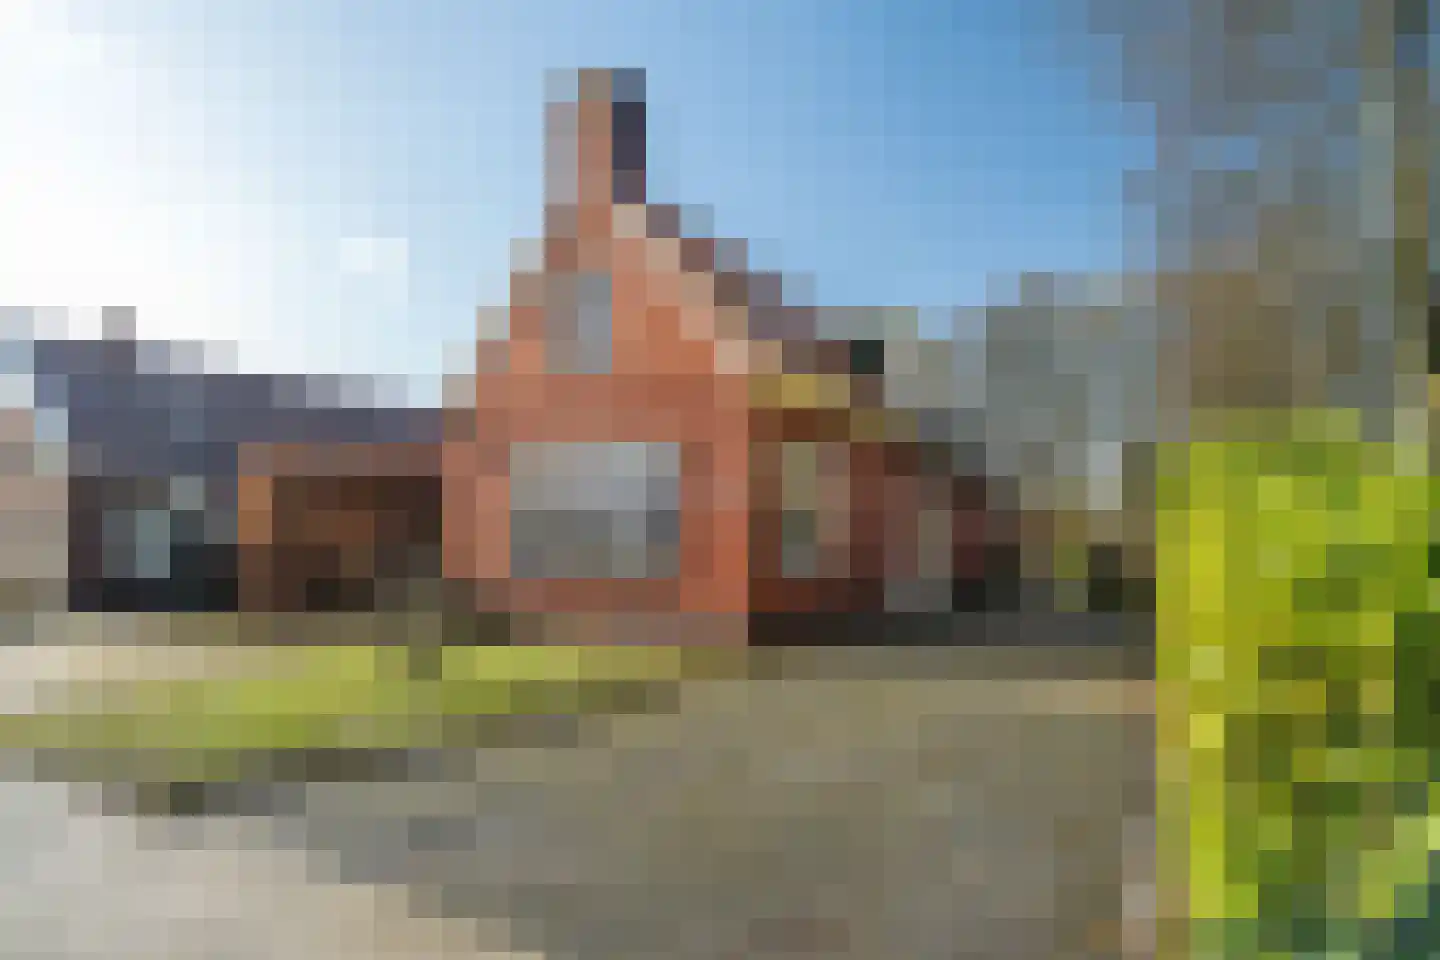
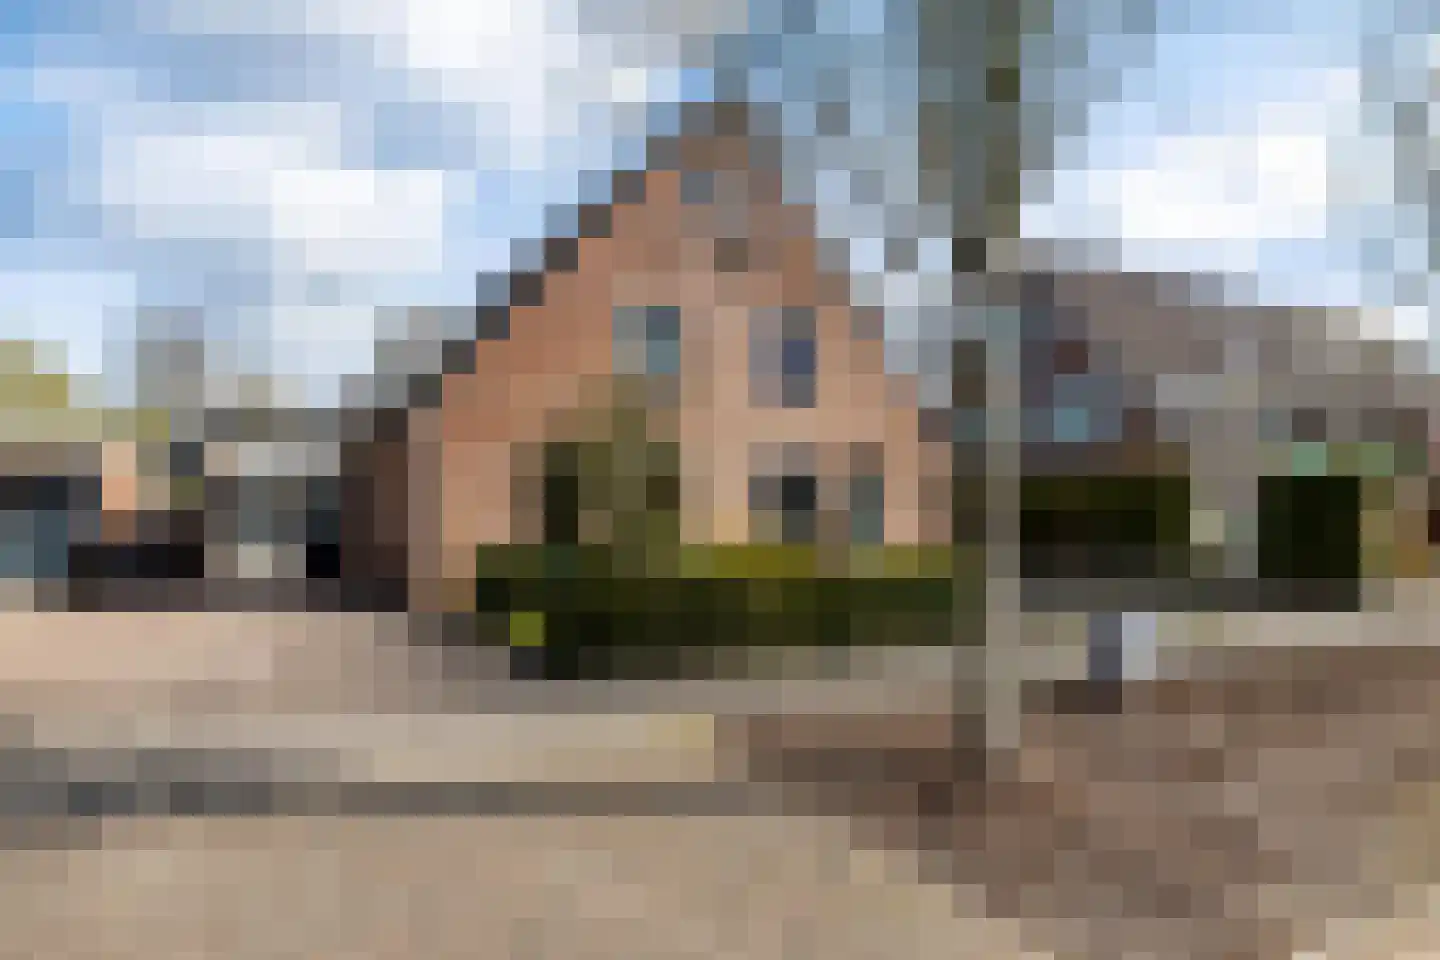
Housing offer in Schildwolde

Searching in 24 houses in Schildwolde

Connected to: Vastgoed Nederland NVM Makelaars

View the current housing stock in Schildwolde and quickly filter by price, living area, rooms and more. There are currently 24 houses in this place within our selection. View also 17 sold houses in Schildwolde for extra insight into the local housing market.

Selection

Search and filter homes

Set your preferences and discover homes that suit you.

Total supply 244.852
Filters

Set price, area and other characteristics. Adjust a filter or click on Show homes. Location changes directly above.

Reset filters

You search for

  • Place Schildwolde

Selling a home in Schildwolde? Compare realtor offers

Get free quotes from real estate agents with local market knowledge. Compare more than 19 real estate agents in Schildwolde.

Free request a quote

  • Quotes in Schildwolde
  • Non-binding
  • Personal
  • Compare free rates

Selling a home in Schildwolde? Compare all real estate agents in Schildwolde or view the top 10 real estate agents in Schildwolde for extra context for your choice.

Compare multiple quotes

Real estate agents make sharper offers when they know you're comparing — ask for quotes for sale or purchase.

Frequently asked questions about homes in Schildwolde

Practical answers about housing supply, sales and comparing real estate agents in Schildwolde.

Residential and neighborhood statistics in Schildwolde

View current location data on residents, WOZ development, housing stock, energy consumption, business activity and safety in Schildwolde. In 2025 were there 1.595 residents. The average WOZ value in 2025 is EUR 372.000.

These figures help to better assess and compare the housing stock in Schildwolde with recent sold homes. Orient yourself then on suitable top real estate agents in Schildwolde for sales advice in this region.

Residents

1.595

Last year: 2025

Average WOZ

EUR 372.000

Last year: 2025

Average income per person.

EUR 29.500

Source: AllNumbers

Crimes (current year)

13

Total registered

Demographics and WOZ development

Inhabitants per year

Inhabitants per year in Schildwolde
Year Residents
2021 1.685
2022 1.675
2023 1.665
2024 1.630
2025 1.595

Annual WOZ value

WOZ value per year in Schildwolde
Year Average WOZ
2021 EUR 234.000
2022 EUR 252.000
2023 EUR 289.000
2024 EUR 331.000
2025 EUR 372.000

Composition of residents

Age build-up

65+: 325 0-15: 225 15-25: 215 25-45: 310 45-65: 520

Education level

Hoger

370

Praktisch

280

Middelbaar

600

Origin of residents (2025)

Europa

45

Nederland

1.480

Buiten Europa

70

Housing stock and construction periods

Types of homes

Hoekwoningen 38
Appartementen 56
Tussenwoningen 37
Vrijstaande woningen 501
Twee-onder-één-kap woningen 89

Construction period of buildings

Voor 1700 2
1700 tot 1900 53
1900 tot 1925 97
1925 tot 1950 152
1950 tot 1970 50
1970 tot 1980 36
1980 tot 1990 31
1990 tot 2000 75
2000 tot 2010 111
2010 tot 2020 11
2020 en later 90

Energy and sustainability

Energy label distribution

Label G

212

Label A

158

Label B

81

Label C

77

Label D

44

Label F

43

Label E

18

Label A++

4

Label A+++

4

Label A+

1

Label A++++

1

Label A+++++

0

Average energy consumption per year

Average energy consumption per year in Schildwolde
Year Gas (m3) Electricity (kWh)
2020 1.640 3.090
2021 1.880 3.230
2022 1.450 3.050
2023 1.170 2.960
2024 1.110 3.130

Consumption per house type

Hoekwoning

Gas: 1.100 • Electricity: 2.380

Huurwoning

Gas: 1.030 • Electricity: 1.940

Koopwoning

Gas: 1.210 • Electricity: 3.230

Appartement

Gas: 750 • Electricity: 1.630

Tussenwoning

Gas: 960 • Electricity: 1.700

Vrijstaande woning

Gas: 1.280 • Electricity: 3.390

Twee-onder-één-kap woning

Gas: 970 • Electricity: 2.140

Business activity in Schildwolde (2025)

Handel en HORECA 30
Nijverheid en energie 50
Zakelijke dienstverlening 40
Overheid, onderwijs en zorg 25
Landbouw, bosbouw en visserij 30
Vervoer, informatie en communicatie 15
Financiele diensten en onroerendgoed 5
Cultuur, recreatie en overige diensten 15

Total number of company establishments: 205

Recent crime statistics

Recent crime statistics in Schildwolde
Period Crimes
jan 2025 5
jan 2026 3
jul 2025 1
jun 2025 1
mei 2025 2
mrt 2025 1
nov 2024 3
nov 2025 1
okt 2024 4
okt 2025 0
sep 2024 1
sep 2025 1

These figures give an indicative picture of safety trends in the living environment of Schildwolde.

Frequently asked questions about living in Schildwolde

Short answers based on current local statistics, handy for a quick comparison of the living environment.

Hoeveel inwoners heeft Schildwolde?

Schildwolde telt in 2025 ongeveer 1.595 inwoners.

Wat is de gemiddelde WOZ-waarde in Schildwolde?

De gemiddelde WOZ-waarde in Schildwolde is in 2025 circa € 372.000.

Wat is het gemiddelde inkomen per inwoner in Schildwolde?

Het gemiddelde inkomen per inwoner in Schildwolde ligt rond € 29.500 per jaar.

Hoe veilig is wonen in Schildwolde?

Voor het huidige jaar gaat het om ongeveer 13 geregistreerde misdrijven. Gebruik deze cijfers als indicatie en vergelijk trends per periode.

Welke woningtypen komen het meest voor in Schildwolde?

In Schildwolde komt vooral "Vrijstaande woningen" veel voor, met ongeveer 501 woningen.

Receive free, non-binding quotes

Compare multiple real estate agents and choose the best match.