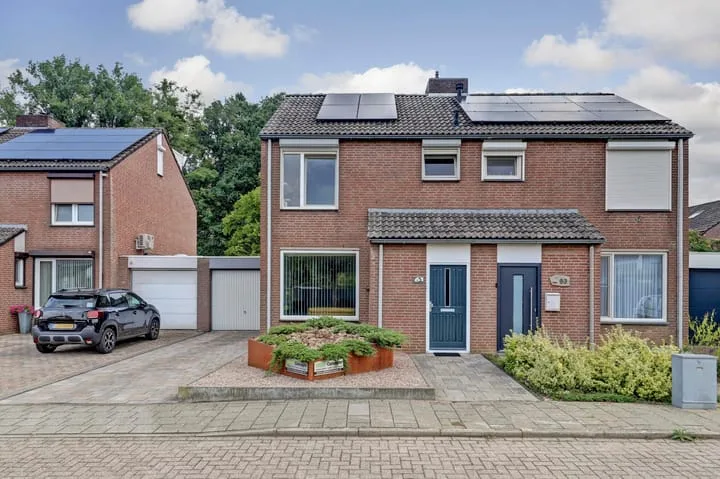
Houses sold in Schinnen

View 19 sold houses in Schinnen

Connected to: Vastgoed Nederland NVM Makelaars

On this page you will find recently sold homes in Schinnen. Use this overview to better estimate selling prices, popular neighborhoods, and the local housing supply before you choose a real estate agent. Also view the current housing supply with 34 houses in Schinnen.

Selection

Search and filter homes

Set your preferences and discover homes that suit you.

Total supply 241.451
Filters

Set price, area and other characteristics. Adjust a filter or click on Show homes. Location changes directly above.

Reset filters

You search for

  • Place Schinnen
  • Status Sold

Huis verkopen in Schinnen? Vergelijk verkoopmakelaars

Bekijk recente verkopen en ontvang gratis offertes van lokale verkoopmakelaars in Schinnen.

Free request a quote

  • Quotes in Schinnen
  • Non-binding
  • Personal
  • Gratis tarieven vergelijken

Zelf je woning verkopen in Schinnen? Vergelijk verkoopmakelaars in Schinnen of bekijk de beste verkoopmakelaars in Schinnen als referentie bij jouw keuze.

Vergelijk meerdere offertes

Makelaars maken scherpere voorstellen als ze weten dat je vergelijkt — vraag offertes aan voor verkoop of aankoop.

Frequently asked questions about sold homes in Schinnen

Short answers about housing prices, sold homes and comparing real estate agents in Schinnen.

Residential and neighborhood statistics in Schinnen

View current location data on residents, WOZ development, housing stock, energy consumption, business activity and safety in Schinnen. In 2026 were there 2.677 residents. The average WOZ value in 2025 is EUR 337.141.

These figures help to better assess and compare the housing stock in Schinnen with recent sold homes. Orient yourself then on suitable top real estate agents in Schinnen for sales advice in this region.

Residents

2.677

Last year: 2026

Average WOZ

EUR 337.141

Last year: 2025

Average income per person.

EUR 33.449

Source: AllNumbers

Crimes (current year)

93

Total registered

Demographics and WOZ development

Inhabitants per year

Inhabitants per year in Schinnen
Year Residents
2021 2.680
2022 2.665
2023 2.665
2024 2.670
2025 2.675
2026 2.677

Annual WOZ value

WOZ value per year in Schinnen
Year Average WOZ
2021 EUR 245.309
2022 EUR 267.190
2023 EUR 309.133
2024 EUR 311.634
2025 EUR 337.141

Composition of residents

Age build-up

65+: 835 0-15: 335 15-25: 240 25-45: 535 45-65: 730

Education level

Hoger

540

Praktisch

440

Middelbaar

860

Origin of residents (2025)

Europa

250

Nederland

2.210

Buiten Europa

210

Housing stock and construction periods

Types of homes

Hoekwoningen 168
Appartementen 266
Tussenwoningen 218
Vrijstaande woningen 378
Twee-onder-één-kap woningen 289

Construction period of buildings

Voor 1700 6
1700 tot 1900 72
1900 tot 1925 87
1925 tot 1950 123
1950 tot 1970 395
1970 tot 1980 232
1980 tot 1990 126
1990 tot 2000 53
2000 tot 2010 78
2010 tot 2020 75
2020 en later 21

Energy and sustainability

Energy label distribution

Label C

248

Label G

215

Label A

202

Label D

188

Label B

186

Label F

167

Label E

77

Label A+++

57

Label A+

36

Label A++

18

Label A++++

2

Label A+++++

0

Average energy consumption per year

Average energy consumption per year in Schinnen
Year Gas (m3) Electricity (kWh)
2020 1.474 3.149
2021 1.640 3.197
2022 1.284 3.011
2023 1.031 2.942
2024 972 3.002

Consumption per house type

Hoekwoning

Gas: 991 • Electricity: 2.896

Huurwoning

Gas: 803 • Electricity: 2.145

Koopwoning

Gas: 1.143 • Electricity: 3.339

Appartement

Gas: 883 • Electricity: 2.351

Tussenwoning

Gas: 795 • Electricity: 2.640

Vrijstaande woning

Gas: 1.373 • Electricity: 3.621

Twee-onder-één-kap woning

Gas: 1.051 • Electricity: 3.121

Business activity in Schinnen (2025)

Handel en HORECA 70
Nijverheid en energie 50
Zakelijke dienstverlening 95
Overheid, onderwijs en zorg 80
Landbouw, bosbouw en visserij 15
Vervoer, informatie en communicatie 20
Financiele diensten en onroerendgoed 10
Cultuur, recreatie en overige diensten 50

Total number of company establishments: 395

Recent crime statistics

Recent crime statistics in Schinnen
Period Crimes
jan 2026 7
jul 2025 8
jun 2025 5
mei 2025 15
mrt 2025 6
mrt 2026 16
nov 2024 7
nov 2025 12
okt 2024 10
okt 2025 8
sep 2024 13
sep 2025 8

These figures give an indicative picture of safety trends in the living environment of Schinnen.

Frequently asked questions about living in Schinnen

Short answers based on current local statistics, handy for a quick comparison of the living environment.

Hoeveel inwoners heeft Schinnen?

Schinnen telt in 2026 ongeveer 2.677 inwoners.

Wat is de gemiddelde WOZ-waarde in Schinnen?

De gemiddelde WOZ-waarde in Schinnen is in 2025 circa € 337.141.

Wat is het gemiddelde inkomen per inwoner in Schinnen?

Het gemiddelde inkomen per inwoner in Schinnen ligt rond € 33.449 per jaar.

Hoe veilig is wonen in Schinnen?

Voor het huidige jaar gaat het om ongeveer 93 geregistreerde misdrijven. Gebruik deze cijfers als indicatie en vergelijk trends per periode.

Welke woningtypen komen het meest voor in Schinnen?

In Schinnen komt vooral "Vrijstaande woningen" veel voor, met ongeveer 378 woningen.

Gratis vrijblijvende offertes ontvangen

Vergelijk meerdere makelaars en kies de beste match.