Residents
2.217
Last year: 2026
7841EL Sleen • Drenthe
€ 340.000 k.k.
Cost of copper (estimated): € 8.650
2% transfer tax (€ 6.800) + notary (€ 1.150) + valuation (€ 700)
Total incl. VAT: € 348.650
Purchase price /m²: € 3.009
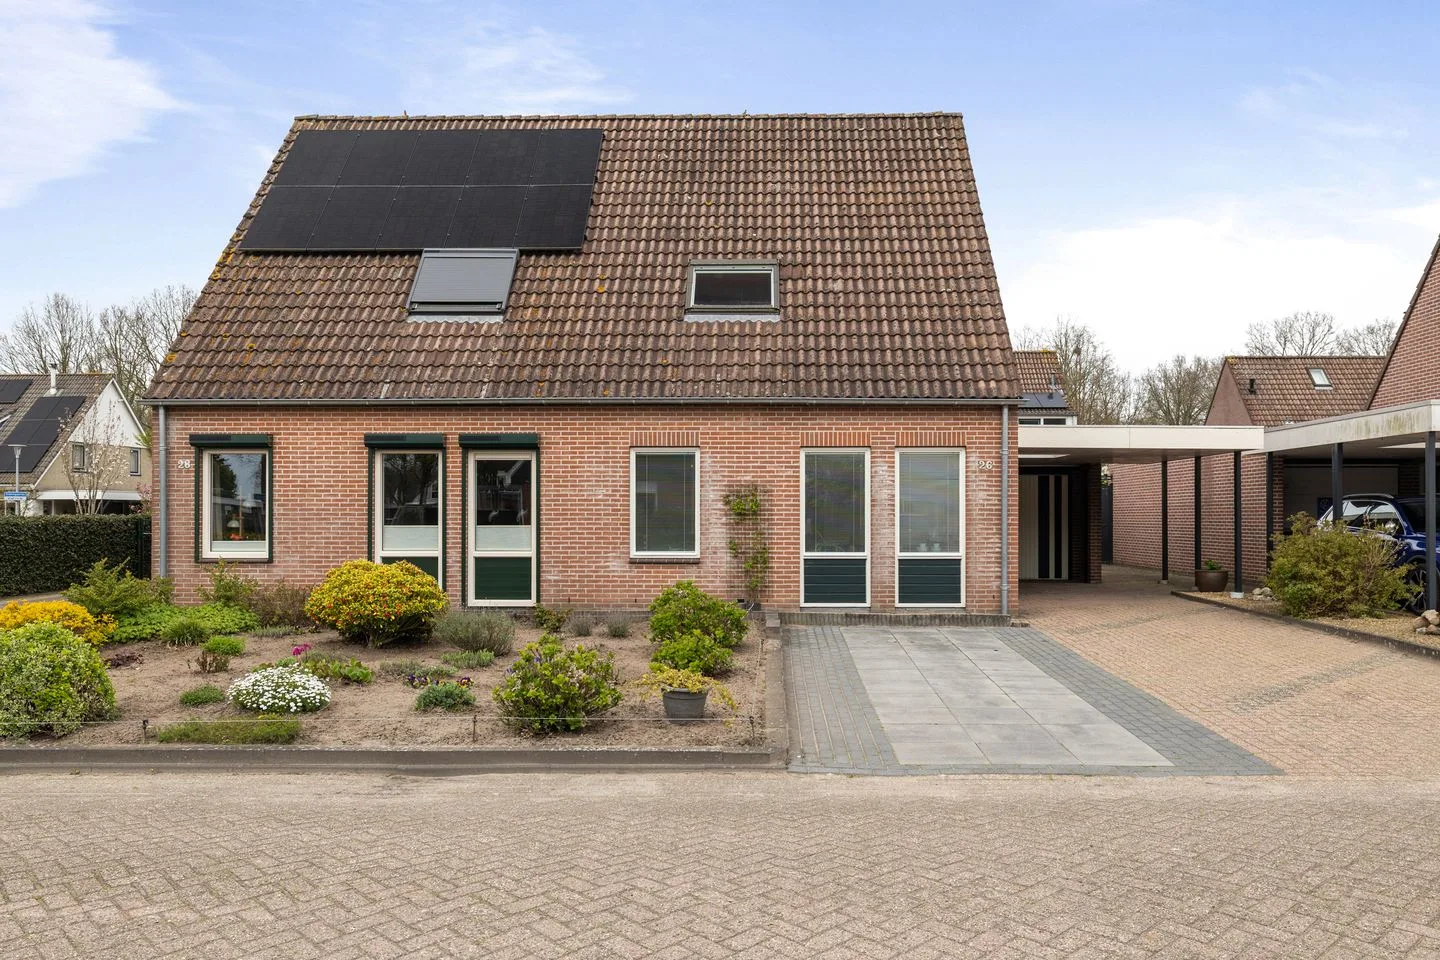
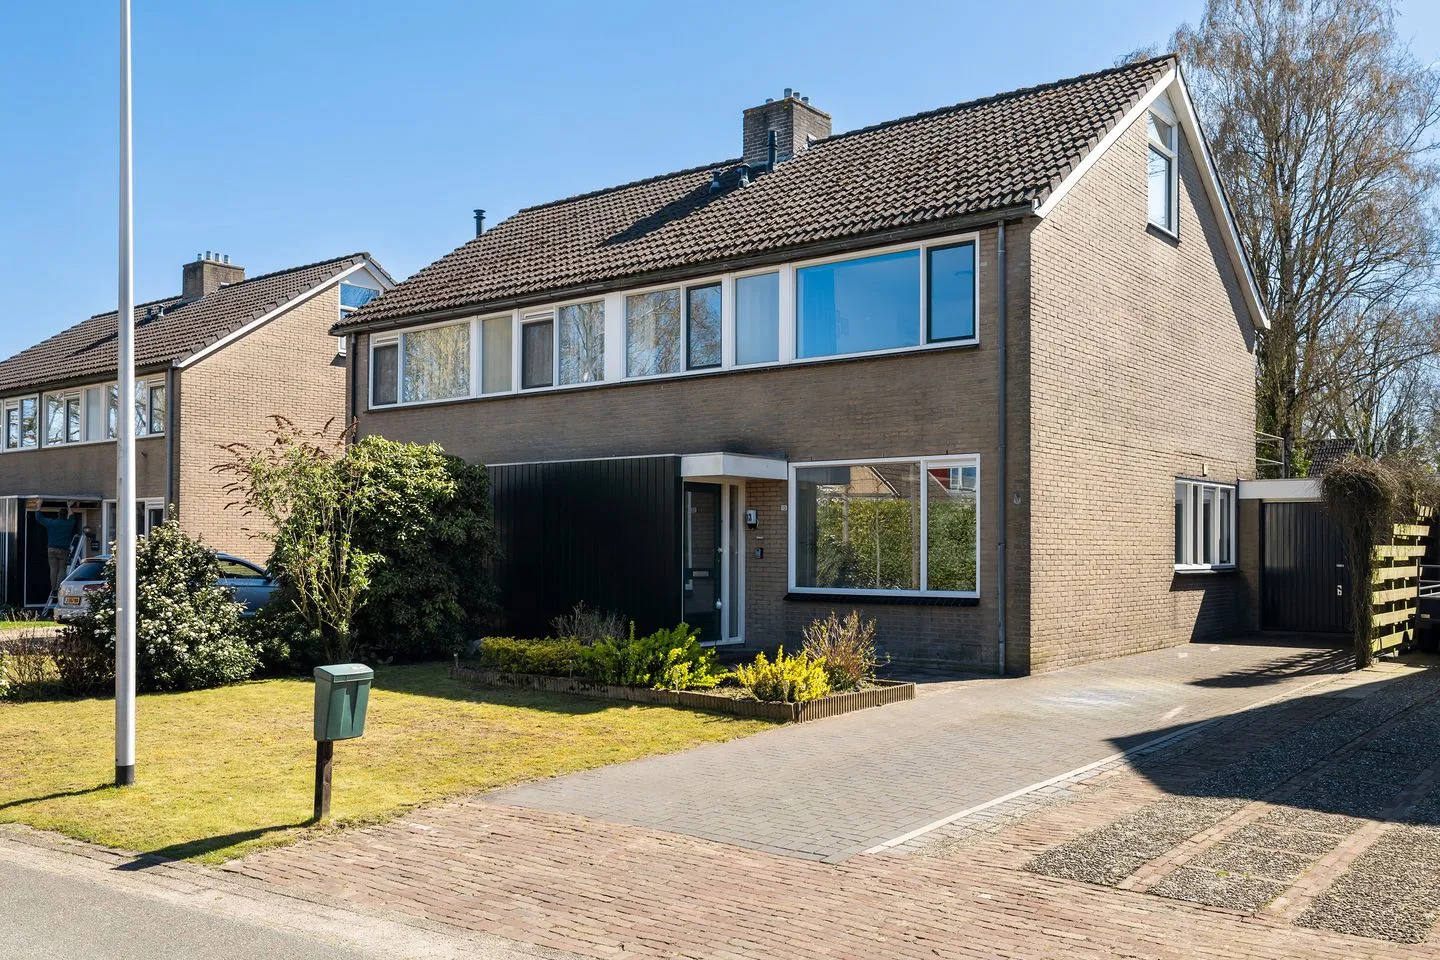
Oosterbroekstraat 26 Sleen (T)huis in Sleen Gelegen aan een verkeersluwe straat in ons prachtige dorp Sleen bieden wij deze comfortabele en keurig onderhouden twee-onder-een-kapwoning met carport aan. De ruime en lichte woning, gebouwd in 1986, is gelegen op een perceel van 275 m² eigen grond en is volledig geïsoleerd. Zou dit zomaar jouw nieuwe (t)huis kunnen zijn? Er zijn maar liefst vier slaapkamers, waarvan drie op de eerste verdieping en één op de zolder. De zolder is bereikbaar via een vaste trap en is praktisch ingedeeld met een slaapkamer en extra bergruimte. Daarnaast zijn er twee badkamers aanwezig: één badkamer op de begane grond en een tweede badkamer op de eerste verdieping, voorzien van een tweede toilet. Tevens is er op de begane grond een separaat toilet aanwezig. De straatgerichte woonkamer kenmerkt zich door een prettige lichtinval dankzij de grote raampartijen, wat zorgt voor een aangename en ruimtelijke sfeer. De keuken is functioneel ingericht en staat in directe verbinding met de tuin. Vanuit de keuken is via de schuifpui toegang tot de achtertuin, wat zorgt voor een fijne overgang tussen binnen en buiten. De tuin is verzorgd en onderhoudsvriendelijk aangelegd en biedt een fijne plek om te ontspannen. Aan de voor- en zijkant van de woning is er bovendien volop ruimte aanwezig voor het parkeren van meerdere auto’s op eigen terrein. Daarnaast beschikt de woning over een carport, waardoor je auto droog en beschut kan staan. De woning is netjes onderhouden, maar op onderdelen gedateerd, wat kansen biedt om de woning geheel naar eigen smaak te moderniseren. Sleen is een sfeervol en levendig dorp met een compleet voorzieningenniveau. In het dorp zijn onder andere basisscholen, een supermarkt, een bakker, diverse winkels en horecagelegenheden aanwezig. Daarnaast beschikt Sleen over verschillende sportverenigingen, een bibliotheek en diverse zorgvoorzieningen zoals een huisarts, een tandarts en een fysiotherapeut. Het dorp kenmerkt zich door een actieve gemeenschap en een prettige woonomgeving. Voor een uitgebreider aanbod aan voorzieningen, zoals middelbare scholen, een ziekenhuis, uitgebreide winkelcentra en diverse recreatiemogelijkheden, zijn de steden Emmen, Coevorden en Nieuw-Amsterdam op korte afstand gelegen en goed bereikbaar. Bijzonderheden - De woning is volledig geïsoleerd (bouwjaar); - Houten kozijnen met dubbel glas en deels HR++ glas (2018); - Voorzien van een AWB cv-ketel (2023); - Glasvezelaansluiting aanwezig; - Het schilderwerk heeft hier en daar wat aandacht nodig. Aanvaarding in overleg. Meer informatie over de woning en de (leef)omgeving vindt je op oosterbroekstraat26.nl. Wil je graag in Sleen (blijven) wonen? Kom dan langs bij deze comfortabele woning. Proclaimer Zwanenburg Makelaardij is verantwoordelijk voor de inhoud van deze informatie en doet er alles aan deze actueel en juist te houden. Je kunt ervan uitgaan dat de teksten, kenmerken en maatvoeringen met de grootste zorgvuldigheid zijn opgesteld en berekend. Kom je desondanks toch iets tegen dat niet correct of verouderd is, dan stellen wij jouw reactie bijzonder op prijs.
€ 340.000
Cost of copper (estimated): € 8.650
2% transfer tax (€ 6.800) + notary (€ 1.150) + valuation (€ 700)
Total purchase (incl. p.p.): € 348.650
3,02%
Yearly
€ 17.000
Direct available
Estimated mortgage
Indicative gross monthly cost
Based on annuity and 30 year term
Indicative net monthly cost
iDisclaimer: this mortgage calculation is a simplified indication based on general assumptions. No rights can be derived from the results shown. Calculated with 10-annual interest (met NHG), automatically determined based on the price limit € 470.000. Source: 10-jaars rente uit mortgage_rates (08-06-2026 03:45).
2 douches, 2 wastafels, en toilet
Stromend water
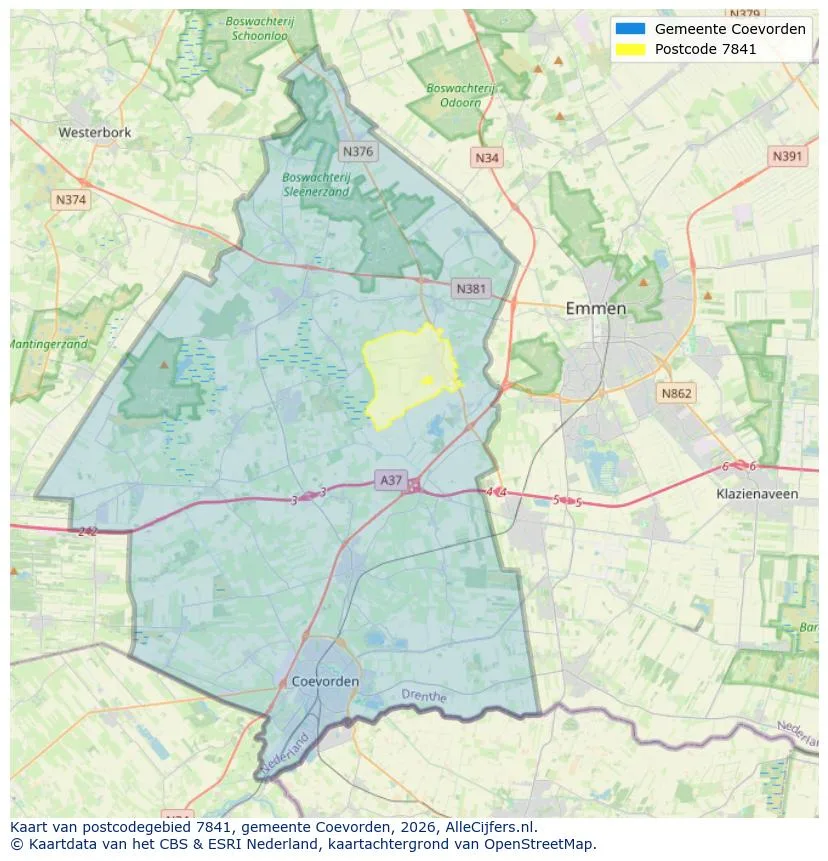
Geographic orientation and real estate agent density in Sleen
View current location data on residents, WOZ development, housing stock, energy consumption, business activity and safety in Sleen. In 2026 were there 2.217 residents. The average WOZ value in 2025 is EUR 345.000.
Residents
2.217
Last year: 2026
Average WOZ
EUR 345.000
Last year: 2025
Average income per person.
EUR 31.100
Source: AllNumbers
Crimes (current year)
38
Total registered
| Year | Residents |
|---|---|
| 2021 | 2.195 |
| 2022 | 2.190 |
| 2023 | 2.205 |
| 2024 | 2.215 |
| 2025 | 2.220 |
| 2026 | 2.217 |
| Year | Average WOZ |
|---|---|
| 2021 | EUR 239.000 |
| 2022 | EUR 272.000 |
| 2023 | EUR 311.000 |
| 2024 | EUR 326.000 |
| 2025 | EUR 345.000 |
Hoger
490
Praktisch
310
Middelbaar
740
Europa
90
Nederland
2.025
Buiten Europa
110
Label C
290
Label A
237
Label B
228
Label D
115
Label F
55
Label G
54
Label E
19
Label A+++
19
Label A++++
18
Label A++
15
Label A+
6
Label A+++++
0
| Year | Gas (m3) | Electricity (kWh) |
|---|---|---|
| 2020 | 1.550 | 2.930 |
| 2021 | 1.720 | 2.970 |
| 2022 | 1.360 | 2.780 |
| 2023 | 1.120 | 2.700 |
| 2024 | 1.040 | 2.900 |
Hoekwoning
Gas: 980 • Electricity: 2.300
Huurwoning
Gas: 880 • Electricity: 1.960
Koopwoning
Gas: 1.200 • Electricity: 2.970
Appartement
Gas: 750 • Electricity: 1.850
Tussenwoning
Gas: 950 • Electricity: 1.840
Vrijstaande woning
Gas: 1.360 • Electricity: 3.350
Twee-onder-één-kap woning
Gas: 980 • Electricity: 2.450
Total number of company establishments: 240
| Period | Crimes |
|---|---|
| jan 2026 | 2 |
| jul 2025 | 3 |
| jun 2025 | 3 |
| mei 2025 | 7 |
| mrt 2025 | 1 |
| mrt 2026 | 2 |
| nov 2024 | 6 |
| nov 2025 | 2 |
| okt 2024 | 4 |
| okt 2025 | 5 |
| sep 2024 | 7 |
| sep 2025 | 1 |
These figures give an indicative picture of safety trends in the living environment of Sleen.
Short answers based on current local statistics, handy for a quick comparison of the living environment.
Sleen telt in 2026 ongeveer 2.217 inwoners.
De gemiddelde WOZ-waarde in Sleen is in 2025 circa € 345.000.
Het gemiddelde inkomen per inwoner in Sleen ligt rond € 31.100 per jaar.
Voor het huidige jaar gaat het om ongeveer 38 geregistreerde misdrijven. Gebruik deze cijfers als indicatie en vergelijk trends per periode.
In Sleen komt vooral "Vrijstaande woningen" veel voor, met ongeveer 430 woningen.
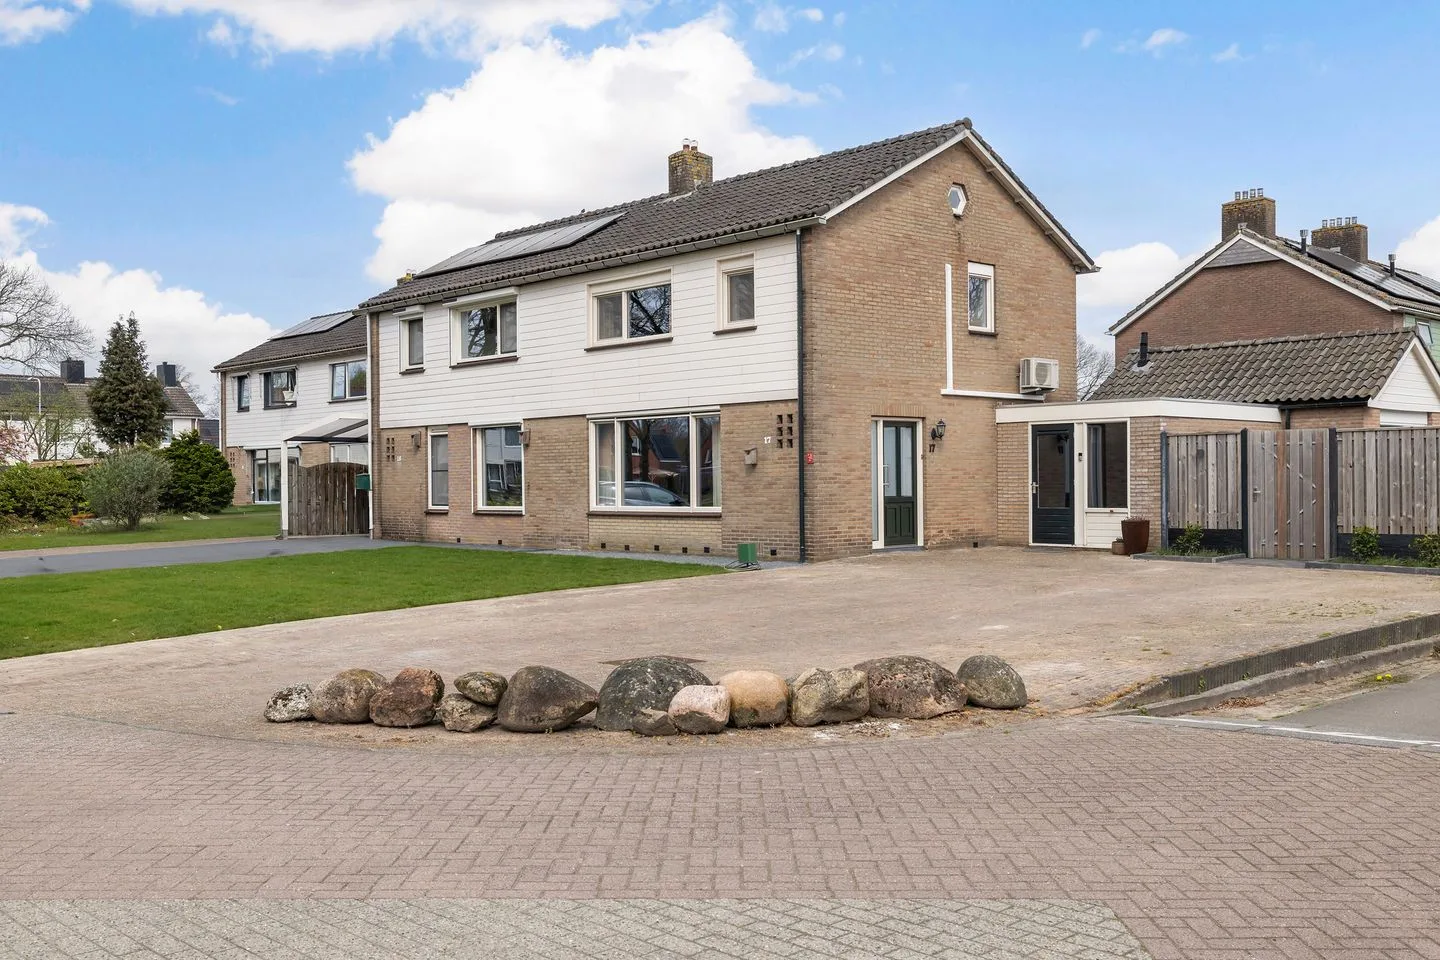
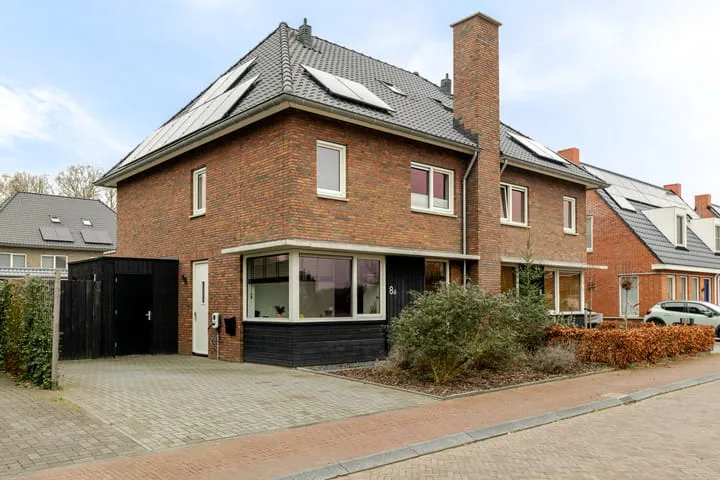
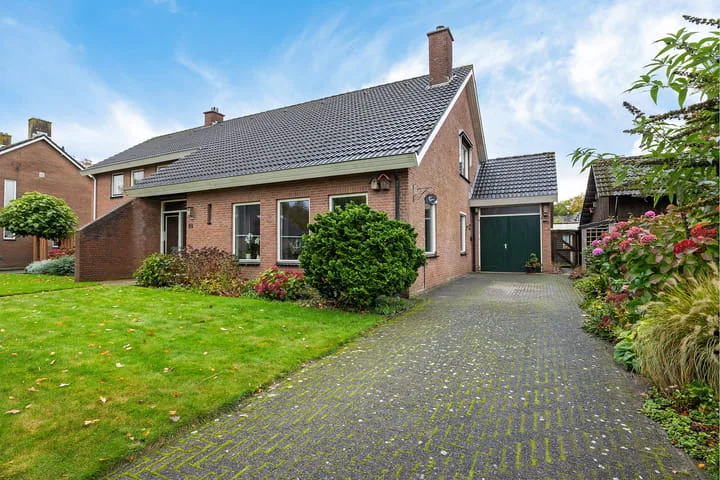
View more homes in this location.
7841AH Sleen
€ 490.000 k.k.
€ 4.336/m²
7841AK Sleen
€ 369.000 k.k.
€ 3.101/m²

7841GK Sleen
€ 425.000 k.k.
€ 2.707/m²
7841AL Sleen
€ 360.000 k.k.
€ 2.483/m²
7841AH Sleen
€ 515.000 k.k.
€ 3.480/m²

7841BR Sleen
€ 695.000 k.k.
€ 3.582/m²
7841KA Sleen
€ 475.000 k.k.
€ 3.518/m²
7841CK Sleen
€ 445.000 k.k.
€ 2.367/m²
