- Available
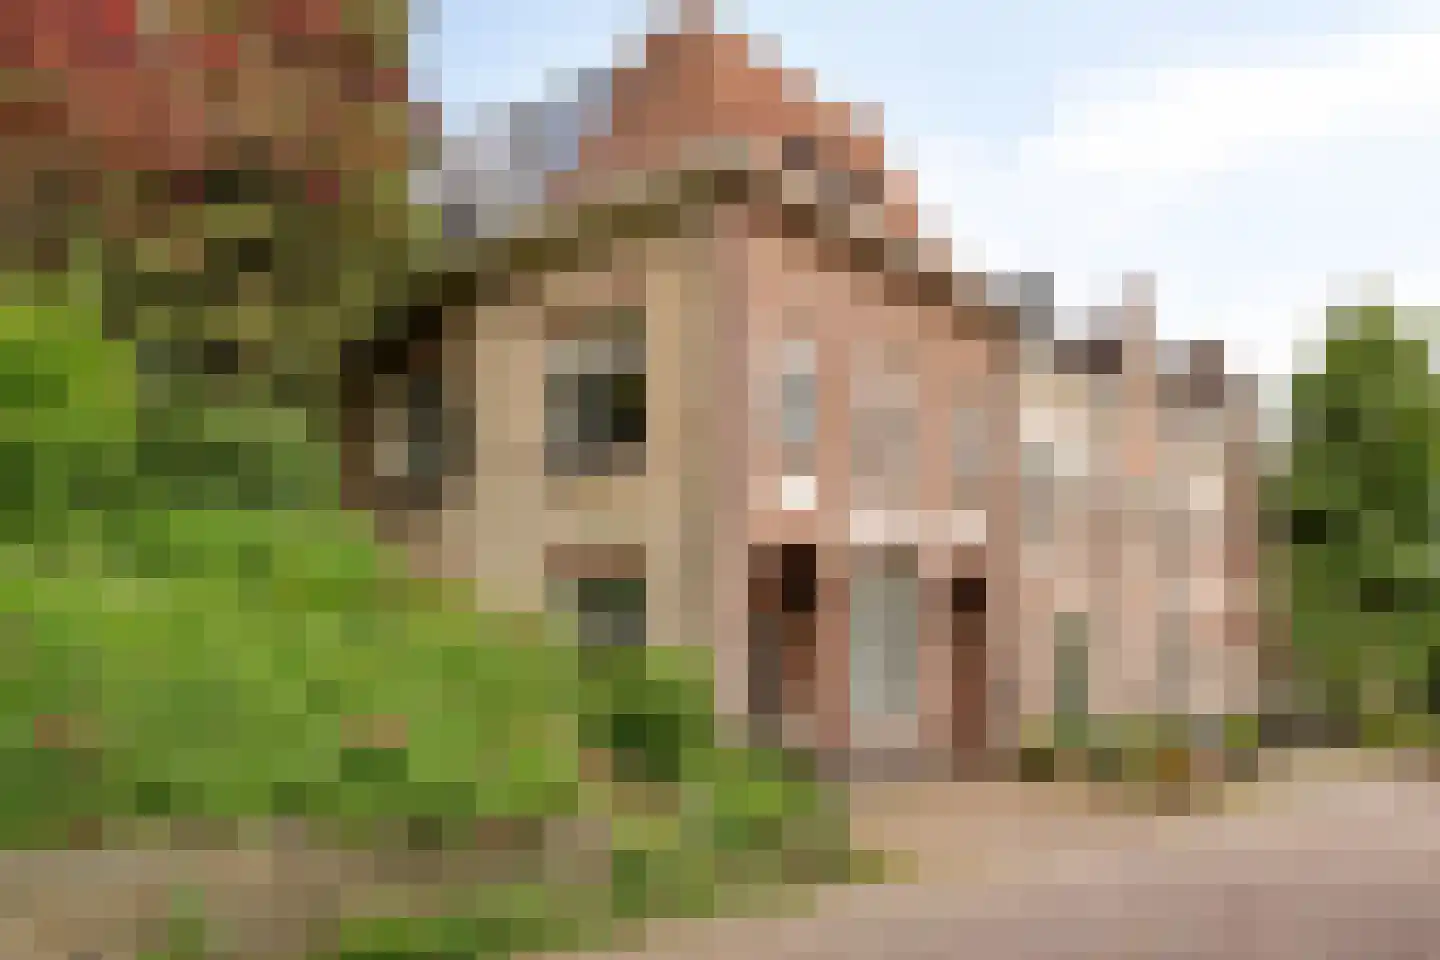
Ubbergse Holleweg 20
6574AS Ubbergen
€ 1.085.000 k.k.
€ 4.173/m²
- Living area
- 260 m²
- Land area
- 790 m²
- Bedrooms
- 5
Searching in 7 houses in Ubbergen
Type to search. Use arrow down and arrow up to navigate through results and press Enter to open.
Hidden search suggestions.
View current properties in Ubbergen or search targeted on street, postal code and property characteristics.
View the current housing stock in Ubbergen and quickly filter by price, living area, rooms and more. There are currently 7 houses in this place within our selection.
6574AS Ubbergen
€ 1.085.000 k.k.
€ 4.173/m²
6574AR Ubbergen
€ 2.700.000 k.k.
€ 5.510/m²
6574AS Ubbergen
€ 895.000 k.k.
€ 6.130/m²
6574AR Ubbergen
€ 1.525.000 k.k.
€ 6.224/m²
6574AL Ubbergen
€ 725.000 k.k.
€ 4.190/m²
6574AP Ubbergen
€ 395.000 k.k.
€ 6.371/m²
6574AS Ubbergen
€ 995.000 k.k.
€ 6.218/m²
Get free quotes from real estate agents with local market knowledge. Compare more than 82 real estate agents in Ubbergen.
Selling a home in Ubbergen? Compare all real estate agents in Ubbergen or view the top 10 real estate agents in Ubbergen for extra context for your choice.
Real estate agents make sharper offers when they know you're comparing — ask for quotes for sale or purchase.
Practical answers about housing supply, sales and comparing real estate agents in Ubbergen.
The costs of a real estate agent in Ubbergen depend on commission, setup costs, property presentation and the chosen service. Compare the 82 real estate agents in Ubbergen via the real estate agent page and request multiple quotes to compare rates and approach well.
Within our selection, we are currently showing 7 houses in Ubbergen. View also the sold houses in Ubbergen to compare the current offering with recent transactions.
Take into account not only price and living area but also maintenance, energy label, location, outdoor space and sales status. This way you compare houses in Ubbergen on more than just the asking price.
A local real estate agent knows the neighborhoods, recent transactions and demand in Ubbergen. By comparing 82 real estate agents in the region you get a better insight into prices, sales strategy and expected yield; the top 10 in Ubbergen provides a useful starting point.
Yes, when making a sales plan, a valuation in Ubbergen is wise. You gain insight into a realistic asking price and can then compare offers from real estate agents specifically.
View current location data on residents, WOZ development, housing stock, energy consumption, business activity and safety in Ubbergen. In 2026 were there 489 residents. The average WOZ value in 2018 is EUR 328.000.
These figures help to better assess and compare the housing stock in Ubbergen with recent sold homes. Orient yourself then on suitable top real estate agents in Ubbergen for sales advice in this region.
Residents
489
Last year: 2026
Average WOZ
EUR 328.000
Last year: 2018
Average income per person.
EUR 38.600
Source: AllNumbers
Crimes (current year)
18
Total registered
| Year | Residents |
|---|---|
| 2021 | 470 |
| 2022 | 475 |
| 2023 | 475 |
| 2024 | 480 |
| 2025 | 475 |
| 2026 | 489 |
| Year | Average WOZ |
|---|---|
| 2014 | EUR 243.000 |
| 2015 | EUR 232.000 |
| 2016 | EUR 304.000 |
| 2017 | EUR 306.000 |
| 2018 | EUR 328.000 |
Hoger
220
Praktisch
50
Middelbaar
110
Europa
60
Nederland
360
Buiten Europa
50
Label G
124
Label C
43
Label D
28
Label A
13
Label F
12
Label E
11
Label A+
9
Label B
7
Label A++
0
Label A+++
0
Label A++++
0
Label A+++++
0
| Year | Gas (m3) | Electricity (kWh) |
|---|---|---|
| 2020 | 1.610 | 3.000 |
| 2021 | 1.810 | 2.840 |
| 2022 | 1.450 | 2.740 |
| 2023 | 1.180 | 2.560 |
| 2024 | 1.140 | 2.640 |
Hoekwoning
Gas: 810 • Electricity: 2.250
Huurwoning
Gas: 750 • Electricity: 1.760
Koopwoning
Gas: 1.650 • Electricity: 3.410
Appartement
Gas: 740 • Electricity: 1.530
Tussenwoning
Gas: 860 • Electricity: 2.810
Vrijstaande woning
Gas: 2.010 • Electricity: 4.120
Twee-onder-één-kap woning
Gas: 1.380 • Electricity: 3.120
Total number of company establishments: 125
| Period | Crimes |
|---|---|
| jan 2026 | 1 |
| jul 2025 | 0 |
| jun 2025 | 2 |
| mei 2025 | 2 |
| mrt 2025 | 2 |
| mrt 2026 | 2 |
| nov 2024 | 1 |
| nov 2025 | 0 |
| okt 2024 | 1 |
| okt 2025 | 2 |
| sep 2024 | 0 |
| sep 2025 | 2 |
These figures give an indicative picture of safety trends in the living environment of Ubbergen.
Short answers based on current local statistics, handy for a quick comparison of the living environment.
Ubbergen telt in 2026 ongeveer 489 inwoners.
De gemiddelde WOZ-waarde in Ubbergen is in 2018 circa € 328.000.
Het gemiddelde inkomen per inwoner in Ubbergen ligt rond € 38.600 per jaar.
Voor het huidige jaar gaat het om ongeveer 18 geregistreerde misdrijven. Gebruik deze cijfers als indicatie en vergelijk trends per periode.
In Ubbergen komt vooral "Appartementen" veel voor, met ongeveer 122 woningen.