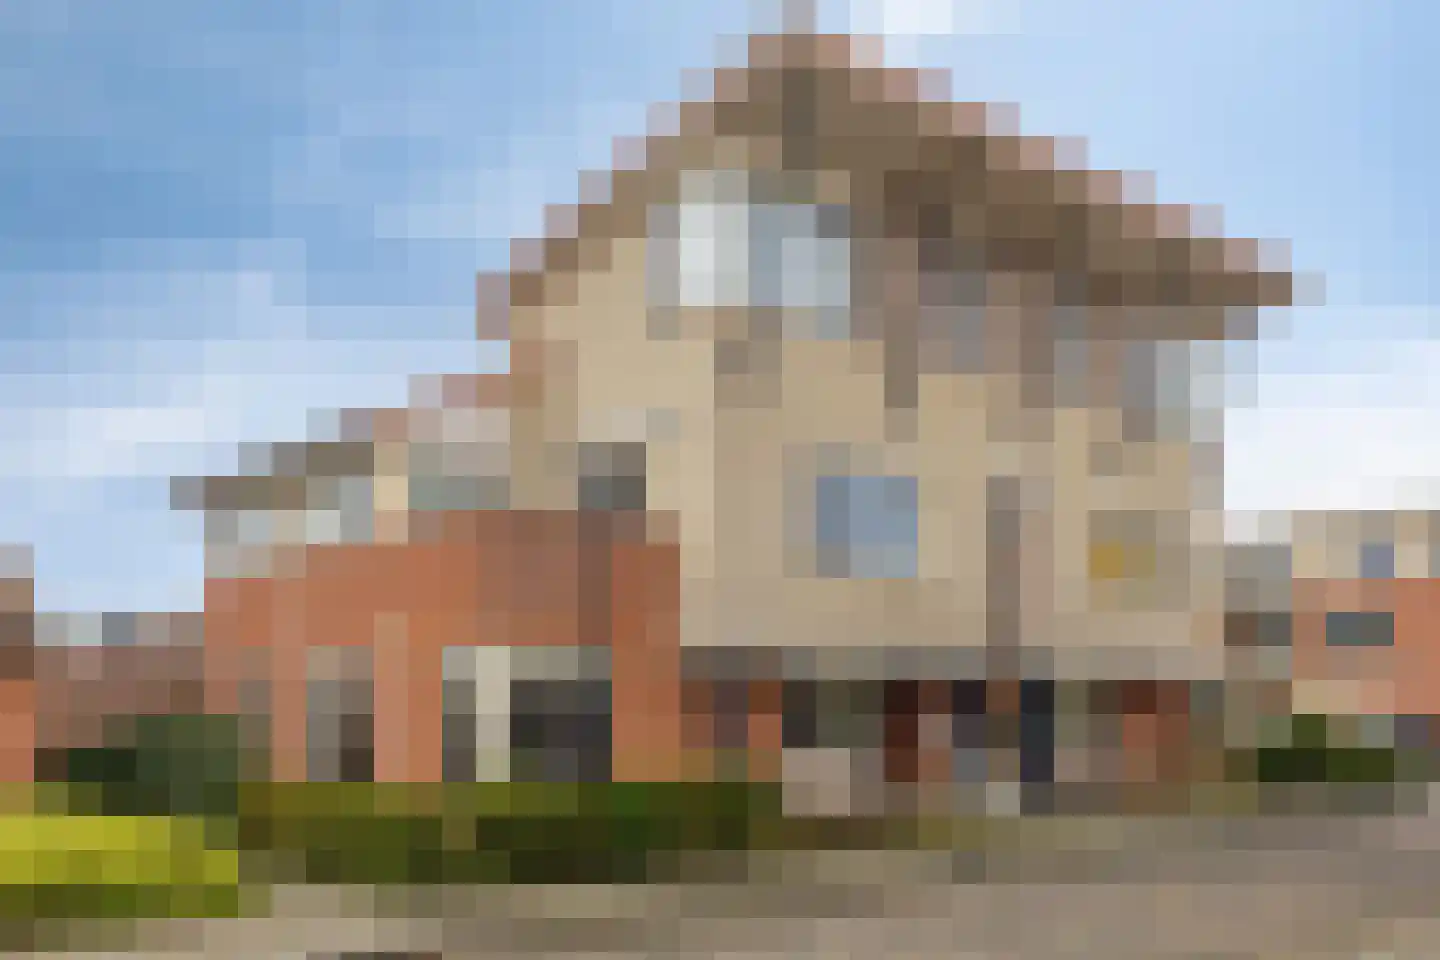
- Sold
Waterstraat 3
7071BX Ulft
€ 350.000 k.k.
€ 4.118/m²
- Living area
- 85 m²
- Land area
- 511 m²
- Bedrooms
- 2
View 78 sold houses in Ulft
Type to search. Use arrow down and arrow up to navigate through results and press Enter to open.
Hidden search suggestions.
Compare sold homes in Ulft or view the current offering in this location directly.
On this page you will find recently sold homes in Ulft. Use this overview to better estimate selling prices, popular neighborhoods, and the local housing supply before you choose a real estate agent. Also view the current housing supply with 113 houses in Ulft.
7071BX Ulft
€ 350.000 k.k.
€ 4.118/m²
7071LA Ulft
€ 299.000 k.k.
€ 4.600/m²
7071PK Ulft
Price upon request
7071KB Ulft
€ 450.000 k.k.
€ 3.309/m²
7071JB Ulft
€ 399.000 k.k.
€ 3.439/m²
7071NB Ulft
€ 550.000 k.k.
€ 4.400/m²
7071EB Ulft
€ 550.000 k.k.
€ 4.135/m²
7071ZT Ulft
€ 250.000 k.k.
€ 3.125/m²
7071MB Ulft
€ 265.000 k.k.
€ 5.196/m²
7071LA Ulft
€ 300.000 k.k.
€ 4.225/m²
7071AS Ulft
€ 400.000 k.k.
€ 3.448/m²
7071JP Ulft
€ 319.000 k.k.
€ 2.773/m²
7071WX Ulft
€ 280.000 k.k.
€ 2.978/m²
7071ZL Ulft
€ 280.000 k.k.
€ 2.641/m²
7071JP Ulft
€ 310.000 k.k.
€ 2.583/m²
7071VK Ulft
€ 395.000 k.k.
€ 3.872/m²
7071ZV Ulft
€ 389.000 k.k.
€ 3.473/m²
7071DC Ulft
€ 550.000 k.k.
€ 4.365/m²
7071WX Ulft
€ 425.000 k.k.
€ 3.400/m²
7071GR Ulft
€ 550.000 k.k.
€ 3.642/m²
7071XW Ulft
€ 300.000 k.k.
€ 3.296/m²
7071TE Ulft
€ 375.000 k.k.
€ 3.472/m²
7071WH Ulft
€ 285.000 k.k.
€ 3.166/m²
7071LB Ulft
€ 325.000 k.k.
€ 3.494/m²
7071JP Ulft
€ 295.000 k.k.
€ 2.458/m²
7071EA Ulft
€ 600.000 k.k.
€ 3.314/m²
7071CP Ulft
€ 700.000 k.k.
€ 3.500/m²
7071PN Ulft
€ 400.000 k.k.
€ 3.305/m²
View recent sales and receive free quotes from local real estate agents. Compare more than 15 real estate agents in Ulft.
Sold recently in Ulft? Read the sales-oriented guide sell your home in Ulft, compare sales agents in Ulft or view the top sales agents in Ulft for reference in your choice.
Real estate agents make sharper offers when they know you're comparing — ask for quotes for sale or purchase.
Short answers about housing prices, sold homes and comparing real estate agents in Ulft.
The costs of a real estate agent in Ulft vary per office, property type and sales approach. In Ulft you can compare 15 real estate agents; therefore also look at the real estate agents in Ulft to better compare fees, presentation and local experience.
On this page we currently show 78 sold houses in Ulft from our selection. This helps you to better assess recent transactions and the local housing market.
Houses sold in Ulft give insight into asking prices, house types and neighborhoods where recent transactions have taken place. Compare this also with the current housing stock in Ulft to better understand the market.
You can use sold homes as a first market indication, but a local real estate agent can better take into account finishing, location, maintenance and current demand in Ulft. Plan the next step via the guide selling a house in Ulft.
Compare the 15 real estate agents in Ulft on local sales experience, reviews, expected yield, commission and marketing approach. View real estate agents in Ulft or the top 10 agents in Ulft to quickly discover strong offices.
View current location data on residents, WOZ development, housing stock, energy consumption, business activity and safety in Ulft. In 2026 were there 10.541 residents. The average WOZ value in 2025 is EUR 310.425.
These figures help to better assess and compare the housing stock in Ulft with recent sold homes. Orient yourself then on suitable top real estate agents in Ulft for sales advice in this region.
Residents
10.541
Last year: 2026
Average WOZ
EUR 310.425
Last year: 2025
Average income per person.
EUR 23.796
Source: AllNumbers
Crimes (current year)
211
Total registered
| Year | Residents |
|---|---|
| 2021 | 10.455 |
| 2022 | 10.440 |
| 2023 | 10.570 |
| 2024 | 10.510 |
| 2025 | 10.570 |
| 2026 | 10.541 |
| Year | Average WOZ |
|---|---|
| 2021 | EUR 215.873 |
| 2022 | EUR 244.593 |
| 2023 | EUR 280.229 |
| 2024 | EUR 297.087 |
| 2025 | EUR 310.425 |
Hoger
1.430
Praktisch
2.560
Middelbaar
3.750
Europa
820
Nederland
8.575
Buiten Europa
1.180
Label C
1.385
Label A
1.043
Label B
829
Label G
389
Label D
332
Label F
331
Label E
274
Label A+
143
Label A+++
113
Label A++
99
Label A++++
83
Label A+++++
0
| Year | Gas (m3) | Electricity (kWh) |
|---|---|---|
| 2020 | 1.201 | 2.880 |
| 2021 | 1.332 | 2.916 |
| 2022 | 1.045 | 2.737 |
| 2023 | 835 | 2.667 |
| 2024 | 819 | 2.729 |
Hoekwoning
Gas: 816 • Electricity: 2.597
Huurwoning
Gas: 656 • Electricity: 2.100
Koopwoning
Gas: 956 • Electricity: 3.023
Appartement
Gas: 668 • Electricity: 2.120
Tussenwoning
Gas: 698 • Electricity: 2.465
Vrijstaande woning
Gas: 1.243 • Electricity: 3.658
Twee-onder-één-kap woning
Gas: 913 • Electricity: 2.808
Total number of company establishments: 1.165
| Period | Crimes |
|---|---|
| jan 2026 | 14 |
| jul 2025 | 26 |
| jun 2025 | 29 |
| mei 2025 | 22 |
| mrt 2025 | 14 |
| mrt 2026 | 22 |
| nov 2024 | 19 |
| nov 2025 | 14 |
| okt 2024 | 17 |
| okt 2025 | 18 |
| sep 2024 | 17 |
| sep 2025 | 14 |
These figures give an indicative picture of safety trends in the living environment of Ulft.
Short answers based on current local statistics, handy for a quick comparison of the living environment.
Ulft telt in 2026 ongeveer 10.541 inwoners.
De gemiddelde WOZ-waarde in Ulft is in 2025 circa € 310.425.
Het gemiddelde inkomen per inwoner in Ulft ligt rond € 23.796 per jaar.
Voor het huidige jaar gaat het om ongeveer 211 geregistreerde misdrijven. Gebruik deze cijfers als indicatie en vergelijk trends per periode.
In Ulft komt vooral "Tussenwoningen" veel voor, met ongeveer 1.333 woningen.