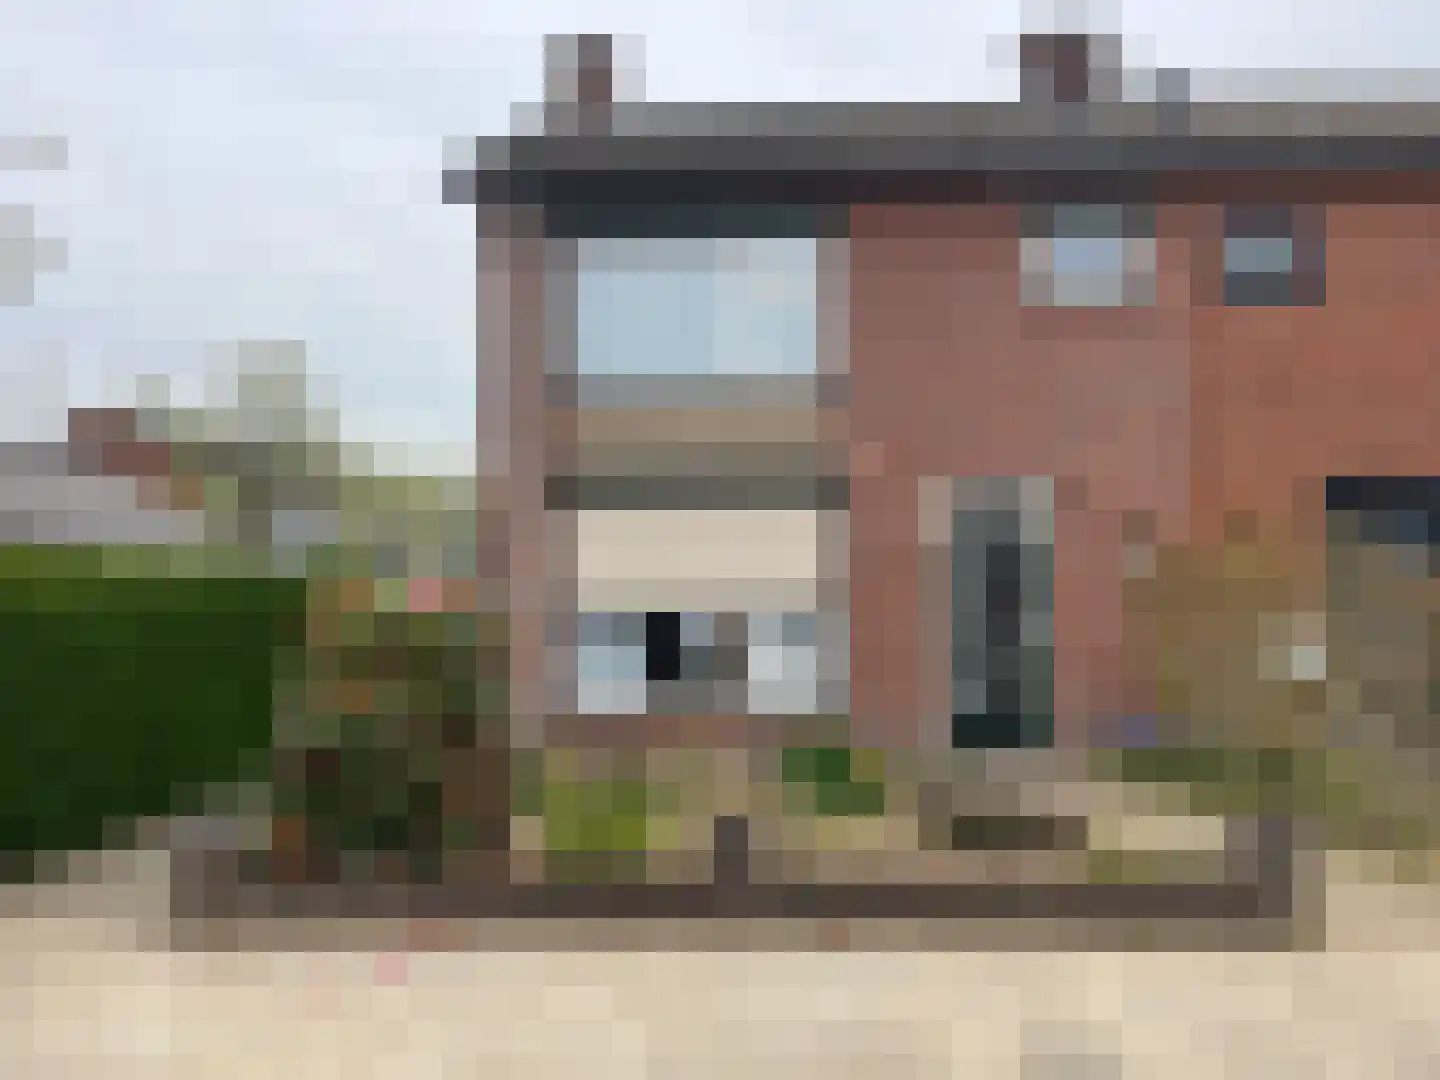
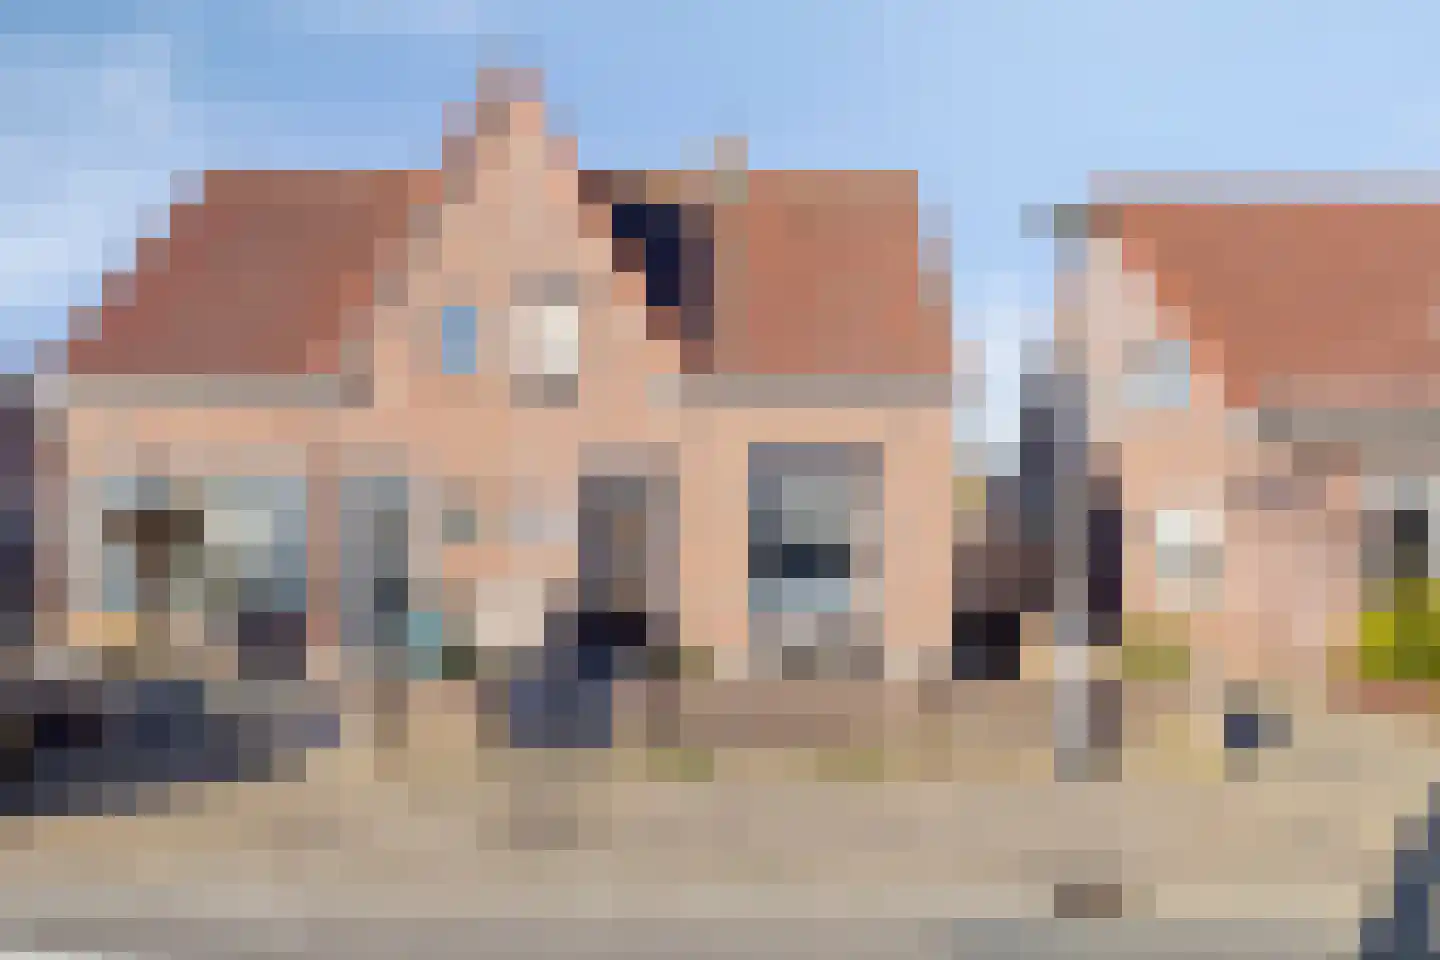
- Available
Oversluis 11
7071DA Ulft
€ 1.495.000 k.k.
€ 4.199/m²
- Living area
- 356 m²
- Land area
- 3615 m²
- Bedrooms
- 5
Searching in 111 houses in Ulft
Type to search. Use arrow down and arrow up to navigate through results and press Enter to open.
Hidden search suggestions.
View current properties in Ulft or search targeted on street, postal code and property characteristics.
View the current housing stock in Ulft and quickly filter by price, living area, rooms and more. There are currently 111 houses in this place within our selection. View also 76 sold houses in Ulft for extra insight into the local housing market.
7071DA Ulft
€ 1.495.000 k.k.
€ 4.199/m²
7071BP Ulft
€ 385.000 k.k.
€ 2.984/m²
7071KL Ulft
€ 399.000 k.k.
€ 3.117/m²
7071AZ Ulft
€ 535.000 k.k.
€ 3.223/m²
7071DD Ulft
€ 500.000 k.k.
€ 3.571/m²
7071HC Ulft
€ 239.000 k.k.
€ 3.025/m²
7071XP Ulft
€ 579.000 k.k.
€ 4.136/m²
7071XX Ulft
€ 280.000 k.k.
€ 3.373/m²
7071XN Ulft
€ 350.000 k.k.
7071KB Ulft
€ 550.000 k.k.
7071XV Ulft
€ 495.000 k.k.
7071XX Ulft
€ 325.000 k.k.
7071NA Ulft
€ 575.000 k.k.
€ 3.343/m²
7071TN Ulft
€ 450.000 k.k.
€ 3.516/m²
7071JR Ulft
€ 295.000 k.k.
7071DV Ulft
€ 425.000 k.k.
€ 3.373/m²
7071VN Ulft
€ 495.000 k.k.
€ 4.091/m²
7071HN Ulft
€ 300.000 k.k.
€ 4.225/m²
7071PJ Ulft
€ 289.000 k.k.
€ 2.125/m²
7071ZV Ulft
€ 589.000 k.k.
€ 4.602/m²
7071BP Ulft
€ 370.000 k.k.
€ 2.741/m²
7071ZB Ulft
€ 330.000 k.k.
€ 2.946/m²
7071TH Ulft
€ 699.000 k.k.
€ 3.266/m²
7071VN Ulft
€ 299.000 k.k.
€ 3.560/m²
7071SH Ulft
€ 399.000 k.k.
€ 4.113/m²
7071CE Ulft
€ 549.094 k.k.
€ 4.428/m²
7071WX Ulft
€ 300.000 k.k.
€ 2.970/m²
7071BS Ulft
€ 275.000 k.k.
€ 3.274/m²
Get free quotes from real estate agents with local market knowledge. Compare more than 15 real estate agents in Ulft.
Selling a home in Ulft? View the sales-oriented guide sell a house in Ulft, compare all real estate agents in Ulft or view the top 10 real estate agents in Ulft for extra context to your choice.
Real estate agents make sharper offers when they know you're comparing — ask for quotes for sale or purchase.
Practical answers about housing supply, sales and comparing real estate agents in Ulft.
The costs of a real estate agent in Ulft depend on commission, setup costs, property presentation and the chosen service. Compare the 15 real estate agents in Ulft via the real estate agent page and request multiple quotes to compare rates and approach well.
Within our selection, we are currently showing 111 houses in Ulft. View also the sold houses in Ulft to compare the current offering with recent transactions.
Take into account not only price and living area but also maintenance, energy label, location, outdoor space and sales status. This way you compare houses in Ulft on more than just the asking price.
A local real estate agent knows the neighborhoods, recent transactions and demand in Ulft. By comparing 15 real estate agents in the region you get a better insight into prices, sales strategy and expected yield; the top 10 in Ulft provides a useful starting point.
Yes, when making a sales plan, a valuation in Ulft is wise. You gain insight into a realistic asking price and can then compare offers from real estate agents specifically.
View current location data on residents, WOZ development, housing stock, energy consumption, business activity and safety in Ulft. In 2026 were there 10.541 residents. The average WOZ value in 2025 is EUR 310.425.
These figures help to better assess and compare the housing stock in Ulft with recent sold homes. Orient yourself then on suitable top real estate agents in Ulft for sales advice in this region.
Residents
10.541
Last year: 2026
Average WOZ
EUR 310.425
Last year: 2025
Average income per person.
EUR 23.796
Source: AllNumbers
Crimes (current year)
211
Total registered
| Year | Residents |
|---|---|
| 2021 | 10.455 |
| 2022 | 10.440 |
| 2023 | 10.570 |
| 2024 | 10.510 |
| 2025 | 10.570 |
| 2026 | 10.541 |
| Year | Average WOZ |
|---|---|
| 2021 | EUR 215.873 |
| 2022 | EUR 244.593 |
| 2023 | EUR 280.229 |
| 2024 | EUR 297.087 |
| 2025 | EUR 310.425 |
Hoger
1.430
Praktisch
2.560
Middelbaar
3.750
Europa
820
Nederland
8.575
Buiten Europa
1.180
Label C
1.385
Label A
1.043
Label B
829
Label G
389
Label D
332
Label F
331
Label E
274
Label A+
143
Label A+++
113
Label A++
99
Label A++++
83
Label A+++++
0
| Year | Gas (m3) | Electricity (kWh) |
|---|---|---|
| 2020 | 1.201 | 2.880 |
| 2021 | 1.332 | 2.916 |
| 2022 | 1.045 | 2.737 |
| 2023 | 835 | 2.667 |
| 2024 | 819 | 2.729 |
Hoekwoning
Gas: 816 • Electricity: 2.597
Huurwoning
Gas: 656 • Electricity: 2.100
Koopwoning
Gas: 956 • Electricity: 3.023
Appartement
Gas: 668 • Electricity: 2.120
Tussenwoning
Gas: 698 • Electricity: 2.465
Vrijstaande woning
Gas: 1.243 • Electricity: 3.658
Twee-onder-één-kap woning
Gas: 913 • Electricity: 2.808
Total number of company establishments: 1.165
| Period | Crimes |
|---|---|
| jan 2026 | 14 |
| jul 2025 | 26 |
| jun 2025 | 29 |
| mei 2025 | 22 |
| mrt 2025 | 14 |
| mrt 2026 | 22 |
| nov 2024 | 19 |
| nov 2025 | 14 |
| okt 2024 | 17 |
| okt 2025 | 18 |
| sep 2024 | 17 |
| sep 2025 | 14 |
These figures give an indicative picture of safety trends in the living environment of Ulft.
Short answers based on current local statistics, handy for a quick comparison of the living environment.
Ulft telt in 2026 ongeveer 10.541 inwoners.
De gemiddelde WOZ-waarde in Ulft is in 2025 circa € 310.425.
Het gemiddelde inkomen per inwoner in Ulft ligt rond € 23.796 per jaar.
Voor het huidige jaar gaat het om ongeveer 211 geregistreerde misdrijven. Gebruik deze cijfers als indicatie en vergelijk trends per periode.
In Ulft komt vooral "Tussenwoningen" veel voor, met ongeveer 1.333 woningen.