Residents
4.929
Last year: 2026
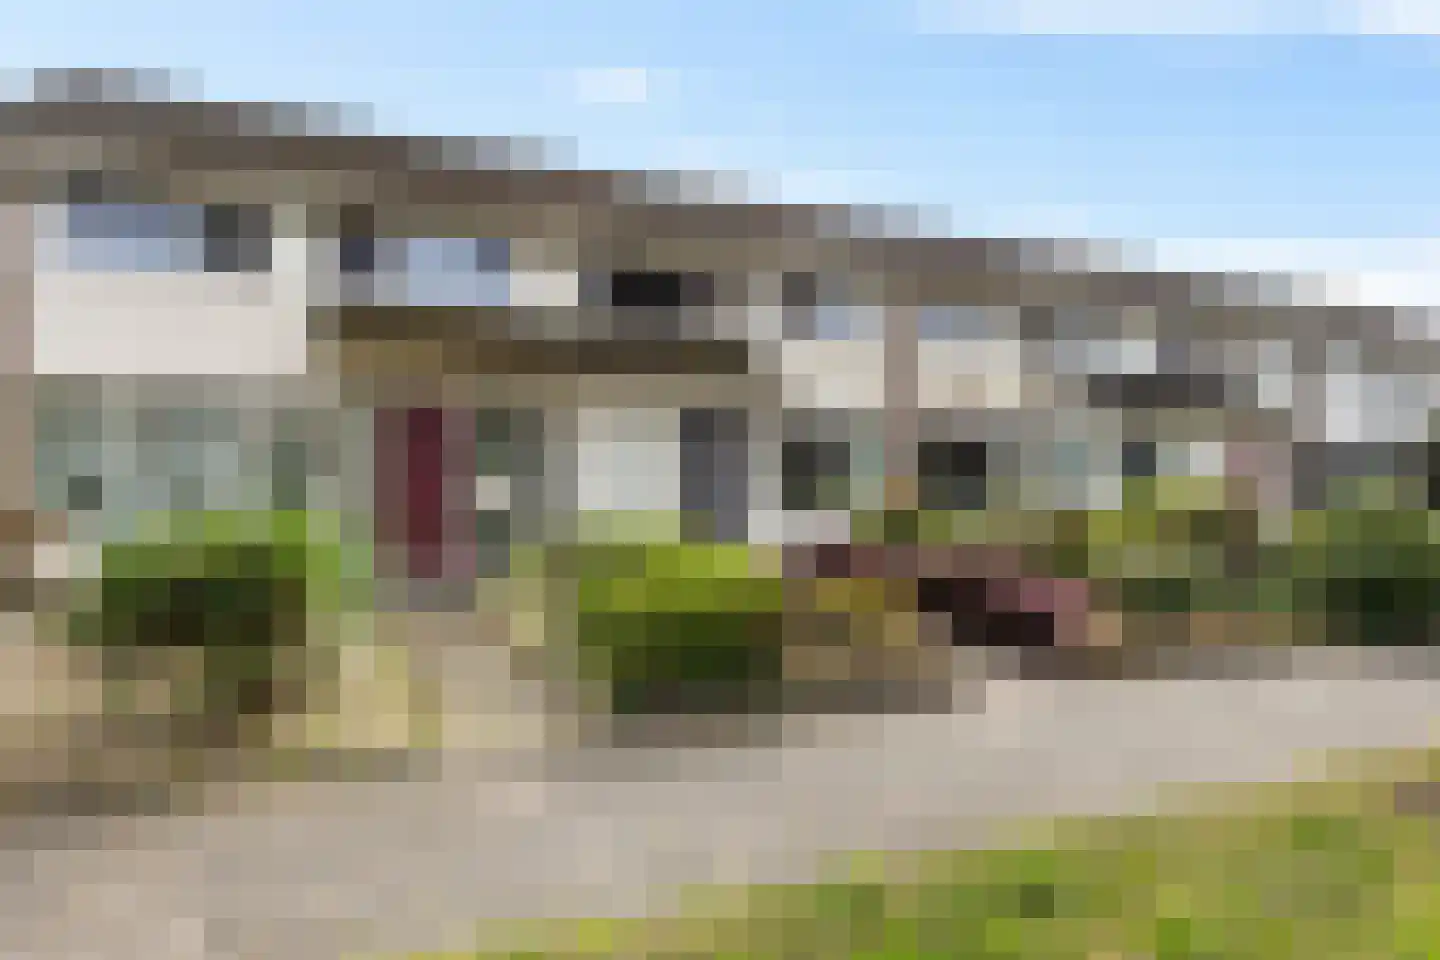
9247BJ Ureterp • Fryslân
€ 300.000 k.k.
Cost of copper (estimated): € 7.850
2% transfer tax (€ 6.000) + notary (€ 1.150) + valuation (€ 700)
Total incl. VAT: € 307.850
Purchase price /m²: € 3.125
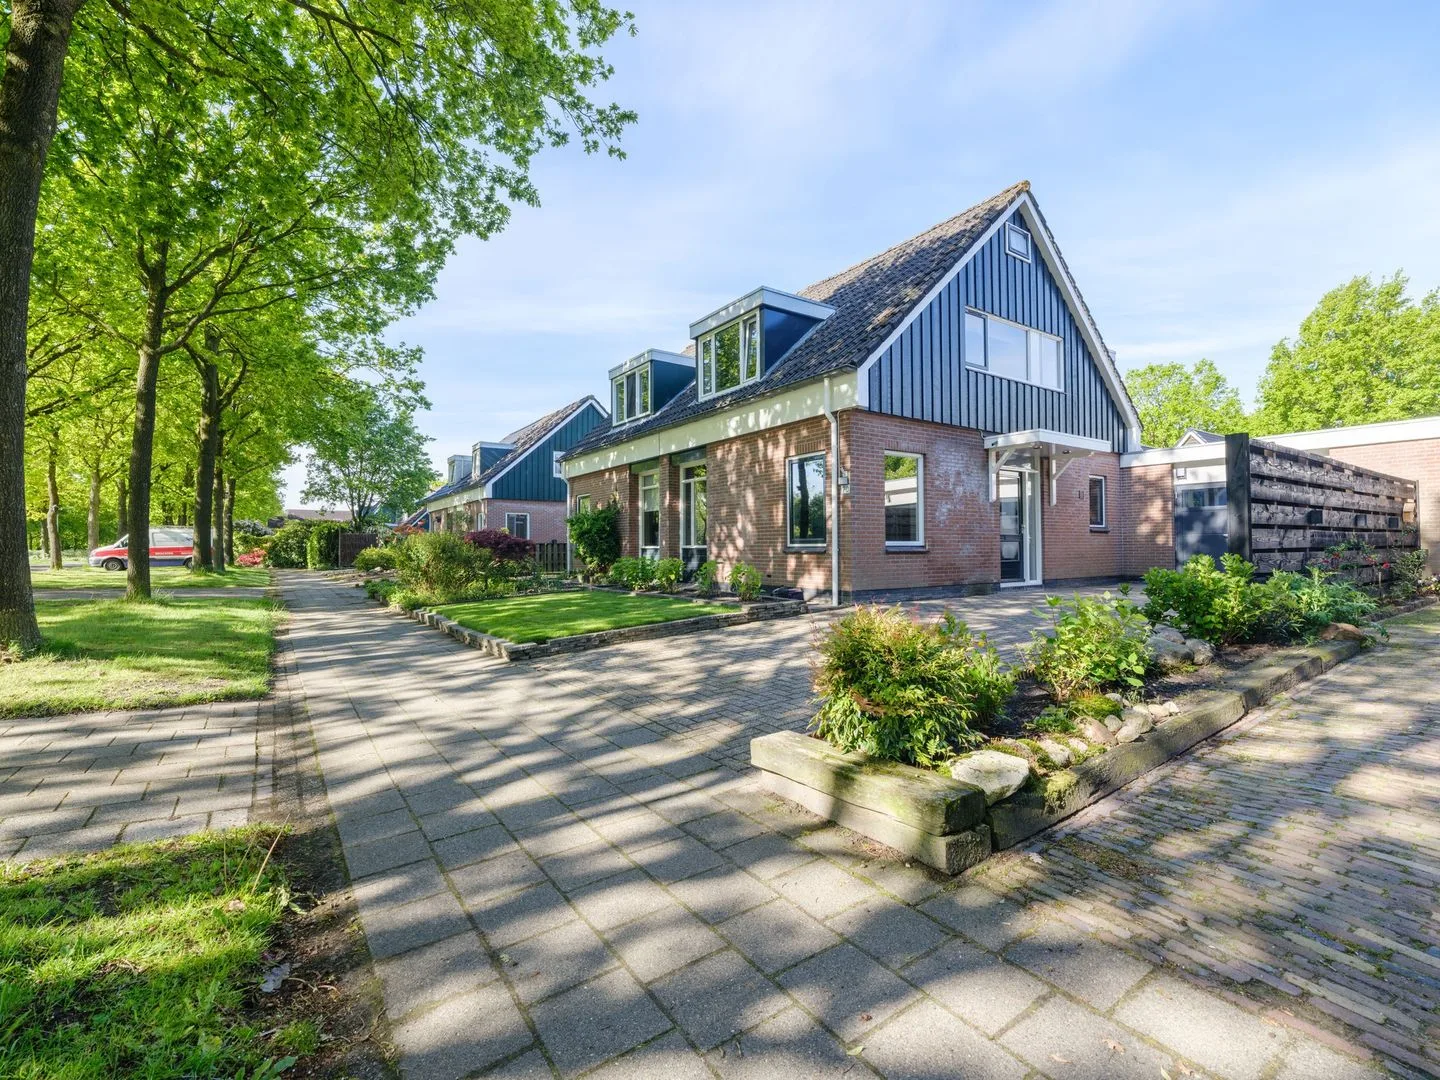
Rustig wonen met alles binnen handbereik dat is precies wat je hier in Ureterp kunt verwachten. Deze tussenwoning uit de starterscategorie ligt op een fijne, groene plek met een groenstrook direct voor de deur. Dat zorgt niet alleen voor extra privacy, maar ook voor een prettig vrij gevoel. En terwijl je hier geniet van de rust, loop je zó naar het multifunctioneel centrum en het dorpscentrum. Binnen voelt de woning logisch en praktisch ingedeeld. Je komt binnen in de hal en loopt door naar de L-vormige woonkamer van circa 30 m². Een fijne leefruimte waar je moeiteloos een gezellige zithoek en eethoek creëert. De trapkast is zo’n detail dat je pas echt gaat waarderen als je er woont: alles netjes uit het zicht, maar wel binnen handbereik. Via de tussenhal, met het recent vernieuwde toilet en de trapopgang De halfopen keuken is praktisch ingericht, aansluitend ligt de geïsoleerde bijkeuken, compleet met witgoedaansluitingen, vliering en cv-opstelling. Praktisch, overzichtelijk en ideaal voor extra bergruimte. Buiten vind je nog een aangebouwde houten schuur en een achtertuin die via een erfdienstbaarheid achterom bereikbaar is. En met de ligging op het zuiden zit je hier goed voor lange, zonnige dagen buiten. Op de eerste verdieping vind je drie slaapkamers van mooi formaat. Of je nu een gezin hebt, thuis werkt of ruimte nodig hebt voor hobby’s: je kunt hier alle kanten op. De badkamer is uitgevoerd met een ruime douchehoek en een badmeubel. Via de overloop bereik je met een vaste trap de zolderberging – ideaal voor seizoensspullen of gewoon extra opslag. Daarnaast zijn de kunststof kozijnen met HR++ glas op de verdieping recent vernieuwd, wat zorgt voor extra comfort en isolatie. Ureterp zelf maakt het plaatje compleet. Je woont hier rustig en groen, maar met Drachten en de A7 vlakbij ben je ook zó onderweg richting Groningen of Heerenveen. Het dorp biedt een compleet voorzieningenaanbod met scholen, sport en kinderopvang, en een actief verenigingsleven. Dat maakt het een plek waar veel mensen bewust voor kiezen en vaak ook jarenlang blijven wonen. Die combinatie van rust, bereikbaarheid en gemeenschap geeft deze locatie net dat beetje extra aantrekkingskracht. Ben je jonger dan 35 jaar en heb je nog niet eerder gebruikgemaakt van een vrijstelling van overdrachtsbelasting? Dan kun je in 2026 mogelijk eenmalig profiteren van de vrijstelling van overdrachtsbelasting. Voorwaarde is dat de woning bedoeld is voor eigen bewoning en de koopsom onder de € 555.000,00 blijft. Ook wanneer één van jullie jonger is dan 35 jaar, kun je hier gedeeltelijk gebruik van maken.
€ 300.000
Cost of copper (estimated): € 7.850
2% transfer tax (€ 6.000) + notary (€ 1.150) + valuation (€ 700)
Total purchase (incl. p.p.): € 307.850
3,02%
Yearly
€ 15.000
Direct available
Estimated mortgage
Indicative gross monthly cost
Based on annuity and 30 year term
Indicative net monthly cost
iDisclaimer: this mortgage calculation is a simplified indication based on general assumptions. No rights can be derived from the results shown. Calculated with 10-annual interest (met NHG), automatically determined based on the price limit € 470.000. Source: 10-jaars rente uit mortgage_rates (08-06-2026 03:45).
Douche
Explore Ureterp and the surrounding areas
View current location data on residents, WOZ development, housing stock, energy consumption, business activity and safety in Ureterp. In 2026 were there 4.929 residents. The average WOZ value in 2025 is EUR 342.000.
Residents
4.929
Last year: 2026
Average WOZ
EUR 342.000
Last year: 2025
Average income per person.
EUR 30.400
Source: AllNumbers
Crimes (current year)
75
Total registered
| Year | Residents |
|---|---|
| 2021 | 4.860 |
| 2022 | 4.900 |
| 2023 | 4.890 |
| 2024 | 4.900 |
| 2025 | 4.905 |
| 2026 | 4.929 |
| Year | Average WOZ |
|---|---|
| 2021 | EUR 258.000 |
| 2022 | EUR 283.000 |
| 2023 | EUR 328.000 |
| 2024 | EUR 336.000 |
| 2025 | EUR 342.000 |
Hoger
1.100
Praktisch
850
Middelbaar
1.610
Europa
110
Nederland
4.585
Buiten Europa
210
Label C
625
Label A
480
Label B
401
Label G
240
Label D
145
Label F
119
Label A+
53
Label E
37
Label A+++
33
Label A++
11
Label A++++
7
Label A+++++
0
| Year | Gas (m3) | Electricity (kWh) |
|---|---|---|
| 2020 | 1.420 | 2.780 |
| 2021 | 1.560 | 2.860 |
| 2022 | 1.210 | 2.640 |
| 2023 | 1.010 | 2.610 |
| 2024 | 950 | 2.690 |
Hoekwoning
Gas: 1.010 • Electricity: 2.150
Huurwoning
Gas: 870 • Electricity: 1.740
Koopwoning
Gas: 1.080 • Electricity: 2.990
Appartement
Gas: 620 • Electricity: 1.460
Tussenwoning
Gas: 940 • Electricity: 1.960
Vrijstaande woning
Gas: 1.230 • Electricity: 3.460
Twee-onder-één-kap woning
Gas: 930 • Electricity: 2.440
Total number of company establishments: 590
| Period | Crimes |
|---|---|
| jan 2026 | 1 |
| jul 2025 | 4 |
| jun 2025 | 6 |
| mei 2025 | 7 |
| mrt 2025 | 5 |
| mrt 2026 | 8 |
| nov 2024 | 11 |
| nov 2025 | 2 |
| okt 2024 | 15 |
| okt 2025 | 7 |
| sep 2024 | 9 |
| sep 2025 | 11 |
These figures give an indicative picture of safety trends in the living environment of Ureterp.
Short answers based on current local statistics, handy for a quick comparison of the living environment.
Ureterp telt in 2026 ongeveer 4.929 inwoners.
De gemiddelde WOZ-waarde in Ureterp is in 2025 circa € 342.000.
Het gemiddelde inkomen per inwoner in Ureterp ligt rond € 30.400 per jaar.
Voor het huidige jaar gaat het om ongeveer 75 geregistreerde misdrijven. Gebruik deze cijfers als indicatie en vergelijk trends per periode.
In Ureterp komt vooral "Vrijstaande woningen" veel voor, met ongeveer 861 woningen.
View more homes in this location.

9247CL Ureterp
€ 750.000 k.k.
€ 4.261/m²

9247CB Ureterp
€ 439.000 k.k.
€ 4.878/m²
9247EM Ureterp
€ 375.000 k.k.
€ 3.947/m²
9247BG Ureterp
€ 379.000 k.k.
€ 3.477/m²
9247GH Ureterp
€ 295.000 k.k.
€ 2.864/m²
9247BH Ureterp
€ 395.000 k.k.
€ 4.158/m²
9247BD Ureterp
€ 500.000 k.k.
€ 2.762/m²
9247GX Ureterp
€ 695.000 k.k.
€ 5.430/m²
