- Sold
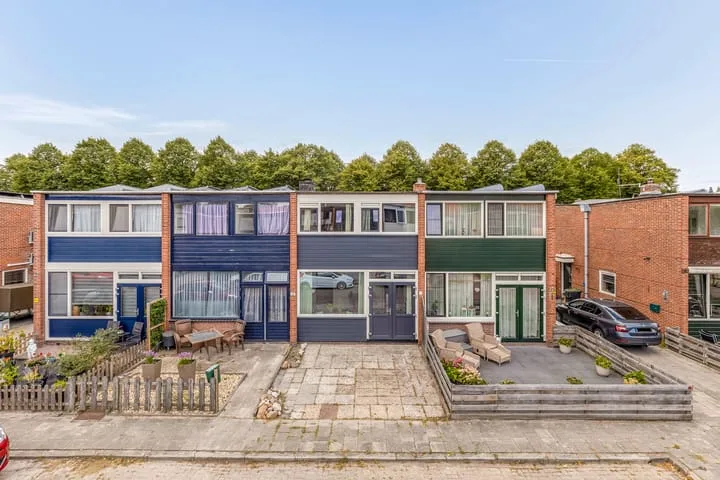
Burgemeester Bosscherstraat 2 A
9641NG Veendam
€ 359.500 k.k.
€ 2.078/m²
- Living area
- 173 m²
- Land area
- 569 m²
- Bedrooms
- 3
View 272 sold houses in Veendam
Type to search. Use arrow down and arrow up to navigate through results and press Enter to open.
Hidden search suggestions.
Compare sold homes in Veendam or view the current offering in this location directly.
On this page you will find recently sold homes in Veendam. Use this overview to better estimate selling prices, popular neighborhoods, and the local housing supply before you choose a real estate agent. Also view the current housing supply with 342 houses in Veendam.
9641NG Veendam
€ 359.500 k.k.
€ 2.078/m²
9641HA Veendam
€ 315.000 k.k.
€ 3.281/m²
9645CZ Veendam
€ 429.500 k.k.
€ 2.863/m²
9641JR Veendam
€ 525.000 k.k.
€ 1.761/m²
9645CW Veendam
€ 399.500 k.k.
€ 2.937/m²
9641BT Veendam
€ 299.500 k.k.
€ 3.025/m²
9645CR Veendam
€ 295.000 k.k.
€ 2.920/m²
9642CL Veendam
€ 210.000 k.k.
€ 2.164/m²
9642JB Veendam
€ 249.500 k.k.
€ 2.045/m²
9642EK Veendam
€ 349.500 k.k.
€ 2.841/m²
9642GB Veendam
€ 309.500 k.k.
€ 2.763/m²
9646AS Veendam
€ 449.500 k.k.
€ 3.942/m²
9645CT Veendam
€ 169.500 k.k.
€ 2.201/m²
9645EJ Veendam
€ 269.500 k.k.
€ 2.836/m²
9646BX Veendam
€ 349.500 k.k.
€ 3.840/m²
9641GE Veendam
€ 249.500 k.k.
€ 2.654/m²
9642PA Veendam
Price upon request
9641EV Veendam
€ 449.500 k.k.
€ 1.834/m²
9642BV Veendam
€ 249.500 k.k.
€ 2.268/m²
9646AH Veendam
€ 339.500 k.k.
€ 3.058/m²
9641HH Veendam
€ 199.500 k.k.
€ 3.764/m²
9645BK Veendam
€ 439.500 k.k.
€ 2.891/m²
9642GV Veendam
€ 299.500 k.k.
€ 2.415/m²
9642MG Veendam
€ 279.500 k.k.
€ 2.495/m²
9642RG Veendam
€ 259.000 k.k.
€ 2.466/m²
9642RJ Veendam
€ 350.000 k.k.
€ 2.536/m²
9641AG Veendam
€ 198.500 k.k.
€ 1.600/m²
9646AV Veendam
€ 320.000 k.k.
€ 3.636/m²
View recent sales and receive free quotes from local real estate agents. Compare more than 21 real estate agents in Veendam.
Sold recently in Veendam? Read the sales-oriented guide sell your home in Veendam, compare sales agents in Veendam or view the top sales agents in Veendam for reference in your choice.
Real estate agents make sharper offers when they know you're comparing — ask for quotes for sale or purchase.
Short answers about housing prices, sold homes and comparing real estate agents in Veendam.
The costs of a real estate agent in Veendam vary per office, property type and sales approach. In Veendam you can compare 21 real estate agents; therefore also look at the real estate agents in Veendam to better compare fees, presentation and local experience.
On this page we currently show 272 sold houses in Veendam from our selection. This helps you to better assess recent transactions and the local housing market.
Houses sold in Veendam give insight into asking prices, house types and neighborhoods where recent transactions have taken place. Compare this also with the current housing stock in Veendam to better understand the market.
You can use sold homes as a first market indication, but a local real estate agent can better take into account finishing, location, maintenance and current demand in Veendam. Plan the next step via the guide selling a house in Veendam.
Compare the 21 real estate agents in Veendam on local sales experience, reviews, expected yield, commission and marketing approach. View real estate agents in Veendam or the top 10 agents in Veendam to quickly discover strong offices.
View current location data on residents, WOZ development, housing stock, energy consumption, business activity and safety in Veendam. In 2025 were there 21.765 residents. The average WOZ value in 2025 is EUR 225.071.
These figures help to better assess and compare the housing stock in Veendam with recent sold homes. Orient yourself then on suitable top real estate agents in Veendam for sales advice in this region.
Residents
21.765
Last year: 2025
Average WOZ
EUR 225.071
Last year: 2025
Average income per person.
EUR 17.743
Source: AllNumbers
Crimes (current year)
810
Total registered
| Year | Residents |
|---|---|
| 2021 | 21.525 |
| 2022 | 21.585 |
| 2023 | 21.670 |
| 2024 | 21.615 |
| 2025 | 21.765 |
| Year | Average WOZ |
|---|---|
| 2021 | EUR 155.344 |
| 2022 | EUR 169.657 |
| 2023 | EUR 202.058 |
| 2024 | EUR 212.369 |
| 2025 | EUR 225.071 |
Hoger
3.030
Praktisch
5.030
Middelbaar
7.480
Europa
985
Nederland
18.080
Buiten Europa
2.695
Label C
2.997
Label A
1.850
Label B
1.850
Label D
1.536
Label G
1.209
Label F
518
Label E
514
Label A+++
174
Label A+
146
Label A++
87
Label A++++
63
Label A+++++
2
| Year | Gas (m3) | Electricity (kWh) |
|---|---|---|
| 2020 | 1.425 | 2.578 |
| 2021 | 1.602 | 2.563 |
| 2022 | 1.241 | 2.380 |
| 2023 | 1.037 | 2.349 |
| 2024 | 985 | 2.482 |
Hoekwoning
Gas: 1.100 • Electricity: 2.240
Huurwoning
Gas: 918 • Electricity: 1.866
Koopwoning
Gas: 1.133 • Electricity: 2.632
Appartement
Gas: 671 • Electricity: 1.549
Tussenwoning
Gas: 1.010 • Electricity: 2.057
Vrijstaande woning
Gas: 1.412 • Electricity: 3.221
Twee-onder-één-kap woning
Gas: 1.094 • Electricity: 2.473
Total number of company establishments: 2.060
| Period | Crimes |
|---|---|
| jan 2025 | 76 |
| jan 2026 | 53 |
| jul 2025 | 78 |
| jun 2025 | 81 |
| mei 2025 | 64 |
| mrt 2025 | 84 |
| nov 2024 | 55 |
| nov 2025 | 77 |
| okt 2024 | 108 |
| okt 2025 | 68 |
| sep 2024 | 86 |
| sep 2025 | 62 |
These figures give an indicative picture of safety trends in the living environment of Veendam.
Short answers based on current local statistics, handy for a quick comparison of the living environment.
Veendam telt in 2025 ongeveer 21.765 inwoners.
De gemiddelde WOZ-waarde in Veendam is in 2025 circa € 225.071.
Het gemiddelde inkomen per inwoner in Veendam ligt rond € 17.743 per jaar.
Voor het huidige jaar gaat het om ongeveer 810 geregistreerde misdrijven. Gebruik deze cijfers als indicatie en vergelijk trends per periode.
In Veendam komt vooral "Tussenwoningen" veel voor, met ongeveer 2.712 woningen.