- Sold
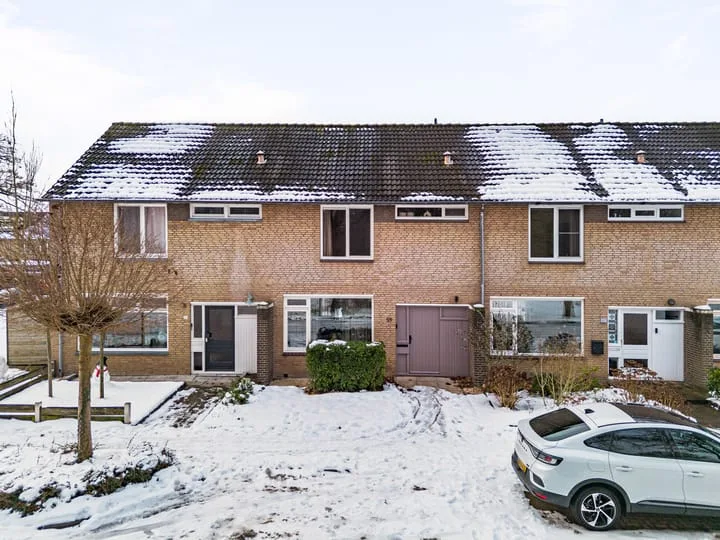
Dr. Schaepmanlaan 45
5463CA Veghel
€ 349.000 k.k.
€ 2.510/m²
- Living area
- 139 m²
- Land area
- 174 m²
- Bedrooms
- 5
View 366 sold houses in Veghel
Type to search. Use arrow down and arrow up to navigate through results and press Enter to open.
Hidden search suggestions.
Compare sold homes in Veghel or view the current offering in this location directly.
On this page you will find recently sold homes in Veghel. Use this overview to better estimate selling prices, popular neighborhoods, and the local housing supply before you choose a real estate agent. Also view the current housing supply with 510 houses in Veghel.
5463CA Veghel
€ 349.000 k.k.
€ 2.510/m²
5464ND Veghel
€ 539.000 k.k.
€ 3.246/m²
5461KG Veghel
€ 195.000 k.k.
€ 4.534/m²
5461BD Veghel
€ 475.000 k.k.
€ 4.094/m²
5463NA Veghel
€ 450.000 k.k.
€ 3.191/m²
5461KR Veghel
€ 369.000 k.k.
€ 4.241/m²
5461BG Veghel
€ 269.000 k.k.
€ 5.604/m²
5465PM Veghel
€ 875.000 k.k.
€ 4.557/m²
5462CJ Veghel
€ 345.000 k.k.
€ 3.026/m²
5467NG Veghel
€ 515.000 k.k.
€ 4.055/m²
5467AT Veghel
€ 450.000 k.k.
€ 3.600/m²
5467LM Veghel
€ 550.000 k.k.
€ 3.571/m²
5462HX Veghel
€ 699.000 k.k.
€ 4.288/m²
5463MR Veghel
€ 499.000 k.k.
€ 4.377/m²
5461BE Veghel
€ 520.000 k.k.
€ 4.727/m²
5463LD Veghel
€ 850.000 k.k.
€ 5.312/m²
5463NV Veghel
€ 360.000 k.k.
€ 2.686/m²
5465LD Veghel
€ 750.000 k.k.
€ 5.725/m²
5467LC Veghel
€ 515.000 k.k.
€ 3.083/m²
5466RT Veghel
€ 489.000 k.k.
€ 4.109/m²
5467JP Veghel
€ 495.000 k.k.
€ 3.928/m²
5463RB Veghel
€ 359.000 k.k.
€ 2.316/m²
5463AC Veghel
€ 369.000 k.k.
€ 3.049/m²
5466PA Veghel
€ 440.000 k.k.
€ 5.176/m²
5461GM Veghel
€ 425.000 k.k.
€ 4.427/m²
5467BP Veghel
€ 350.000 k.k.
€ 3.301/m²
5467CL Veghel
€ 475.000 k.k.
€ 3.275/m²
5463AB Veghel
€ 425.000 k.k.
€ 3.427/m²
Bekijk recente verkopen en ontvang gratis offertes van lokale verkoopmakelaars in Veghel.
Recent verkocht in Veghel? Lees de verkoopgerichte gids huis verkopen in Veghel, vergelijk verkoopmakelaars in Veghel of bekijk de beste verkoopmakelaars in Veghel voor referentie bij jouw keuze.
Makelaars maken scherpere voorstellen als ze weten dat je vergelijkt — vraag offertes aan voor verkoop of aankoop.
Short answers about housing prices, sold homes and comparing real estate agents in Veghel.
The costs of a real estate agent in Veghel vary per office, property type and sales approach. Therefore, compare multiple quotes and also look at the real estate agents in Veghel to better compare rates, presentation and local experience.
On this page we currently show 366 sold houses in Veghel from our selection. This helps you to better assess recent transactions and the local housing market.
Houses sold in Veghel give insight into asking prices, house types and neighborhoods where recent transactions have taken place. Compare this also with the current housing stock in Veghel to better understand the market.
Je kunt verkochte woningen gebruiken als eerste marktindicatie, maar een lokale makelaar kan beter rekening houden met afwerking, ligging, onderhoud en actuele vraag in Veghel. Plan de volgende stap via de gids huis verkopen in Veghel.
Vergelijk makelaars in Veghel op lokale verkoopervaring, reviews, verwachte opbrengst, courtage en marketingaanpak. Bekijk verkoopmakelaars in Veghel of de top 10 makelaars in Veghel om snel sterke kantoren te ontdekken.
View current location data on residents, WOZ development, housing stock, energy consumption, business activity and safety in Veghel. In 2025 were there 34.805 residents. The average WOZ value in 2025 is EUR 416.000.
These figures help to better assess and compare the housing stock in Veghel with recent sold homes. Orient yourself then on suitable top real estate agents in Veghel for sales advice in this region.
Residents
34.805
Last year: 2025
Average WOZ
EUR 416.000
Last year: 2025
Average income per person.
EUR 34.700
Source: AllNumbers
Crimes (current year)
1.185
Total registered
| Year | Residents |
|---|---|
| 2021 | 32.585 |
| 2022 | 33.345 |
| 2023 | 33.895 |
| 2024 | 34.455 |
| 2025 | 34.805 |
| Year | Average WOZ |
|---|---|
| 2021 | EUR 284.000 |
| 2022 | EUR 315.000 |
| 2023 | EUR 375.000 |
| 2024 | EUR 390.000 |
| 2025 | EUR 416.000 |
Hoger
7.640
Praktisch
7.110
Middelbaar
11.450
Europa
3.795
Nederland
25.630
Buiten Europa
5.375
Label A
4.312
Label C
4.307
Label B
2.841
Label D
1.129
Label F
600
Label G
594
Label A+++
585
Label A+
500
Label E
439
Label A++
316
Label A++++
134
Label A+++++
11
| Year | Gas (m3) | Electricity (kWh) |
|---|---|---|
| 2020 | 1.270 | 3.130 |
| 2021 | 1.410 | 3.190 |
| 2022 | 1.080 | 2.970 |
| 2023 | 910 | 2.850 |
| 2024 | 860 | 2.950 |
Hoekwoning
Gas: 920 • Electricity: 2.720
Huurwoning
Gas: 700 • Electricity: 2.030
Koopwoning
Gas: 1.000 • Electricity: 3.210
Appartement
Gas: 550 • Electricity: 1.860
Tussenwoning
Gas: 810 • Electricity: 2.520
Vrijstaande woning
Gas: 1.360 • Electricity: 4.340
Twee-onder-één-kap woning
Gas: 1.100 • Electricity: 3.400
Total number of company establishments: 4.485
| Period | Crimes |
|---|---|
| jan 2025 | 101 |
| jan 2026 | 93 |
| jul 2025 | 92 |
| jun 2025 | 91 |
| mei 2025 | 120 |
| mrt 2025 | 113 |
| nov 2024 | 91 |
| nov 2025 | 81 |
| okt 2024 | 85 |
| okt 2025 | 114 |
| sep 2024 | 83 |
| sep 2025 | 100 |
These figures give an indicative picture of safety trends in the living environment of Veghel.
Short answers based on current local statistics, handy for a quick comparison of the living environment.
Veghel telt in 2025 ongeveer 34.805 inwoners.
De gemiddelde WOZ-waarde in Veghel is in 2025 circa € 416.000.
Het gemiddelde inkomen per inwoner in Veghel ligt rond € 34.700 per jaar.
Voor het huidige jaar gaat het om ongeveer 1.185 geregistreerde misdrijven. Gebruik deze cijfers als indicatie en vergelijk trends per periode.
In Veghel komt vooral "Tussenwoningen" veel voor, met ongeveer 5.417 woningen.