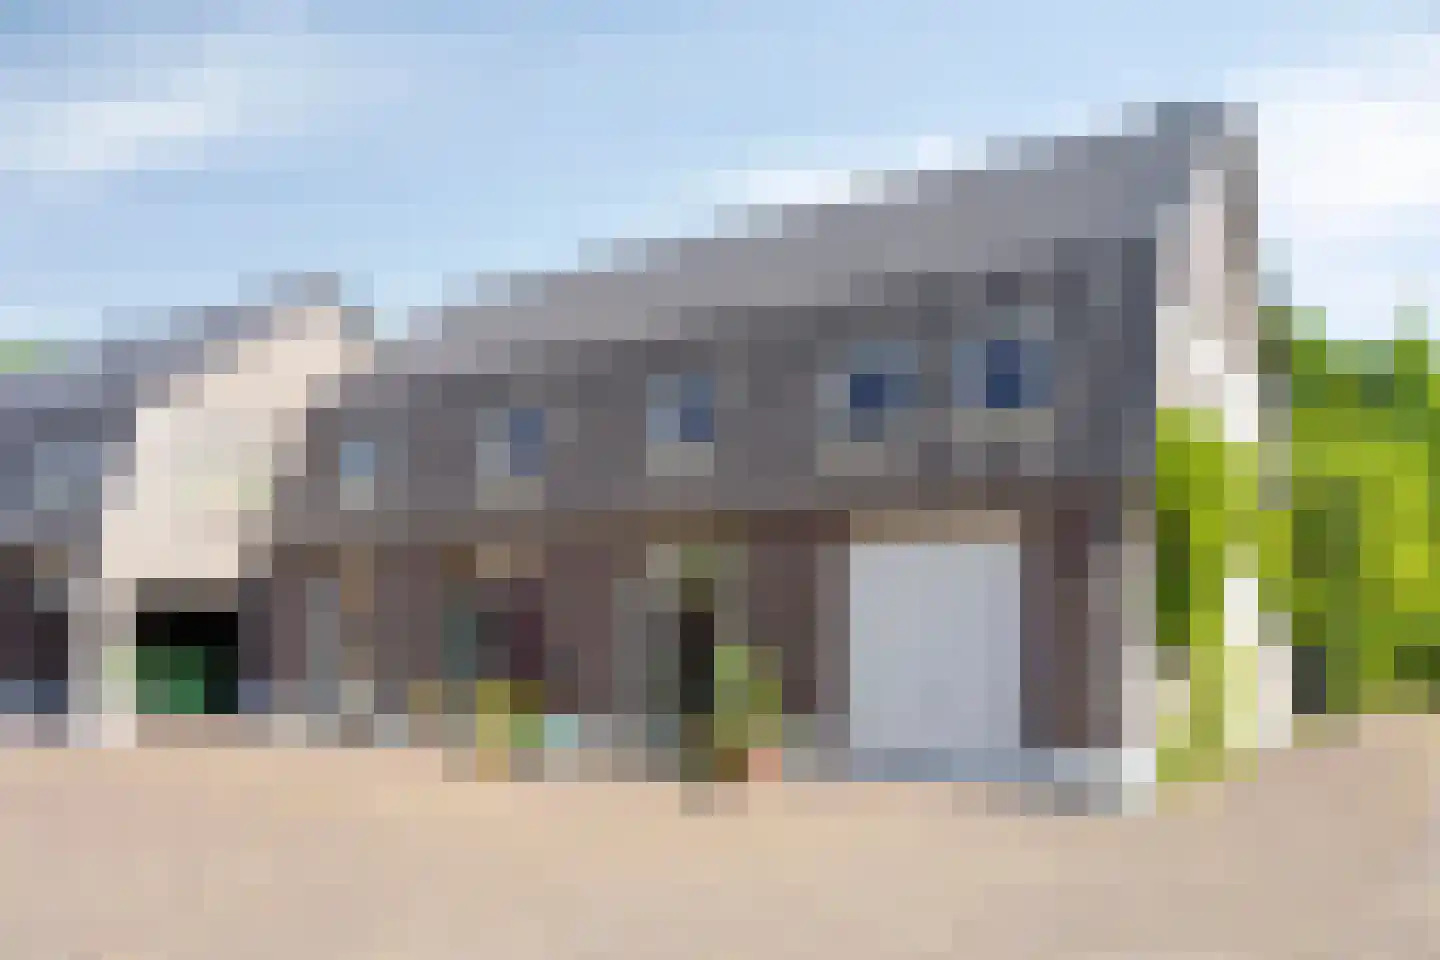
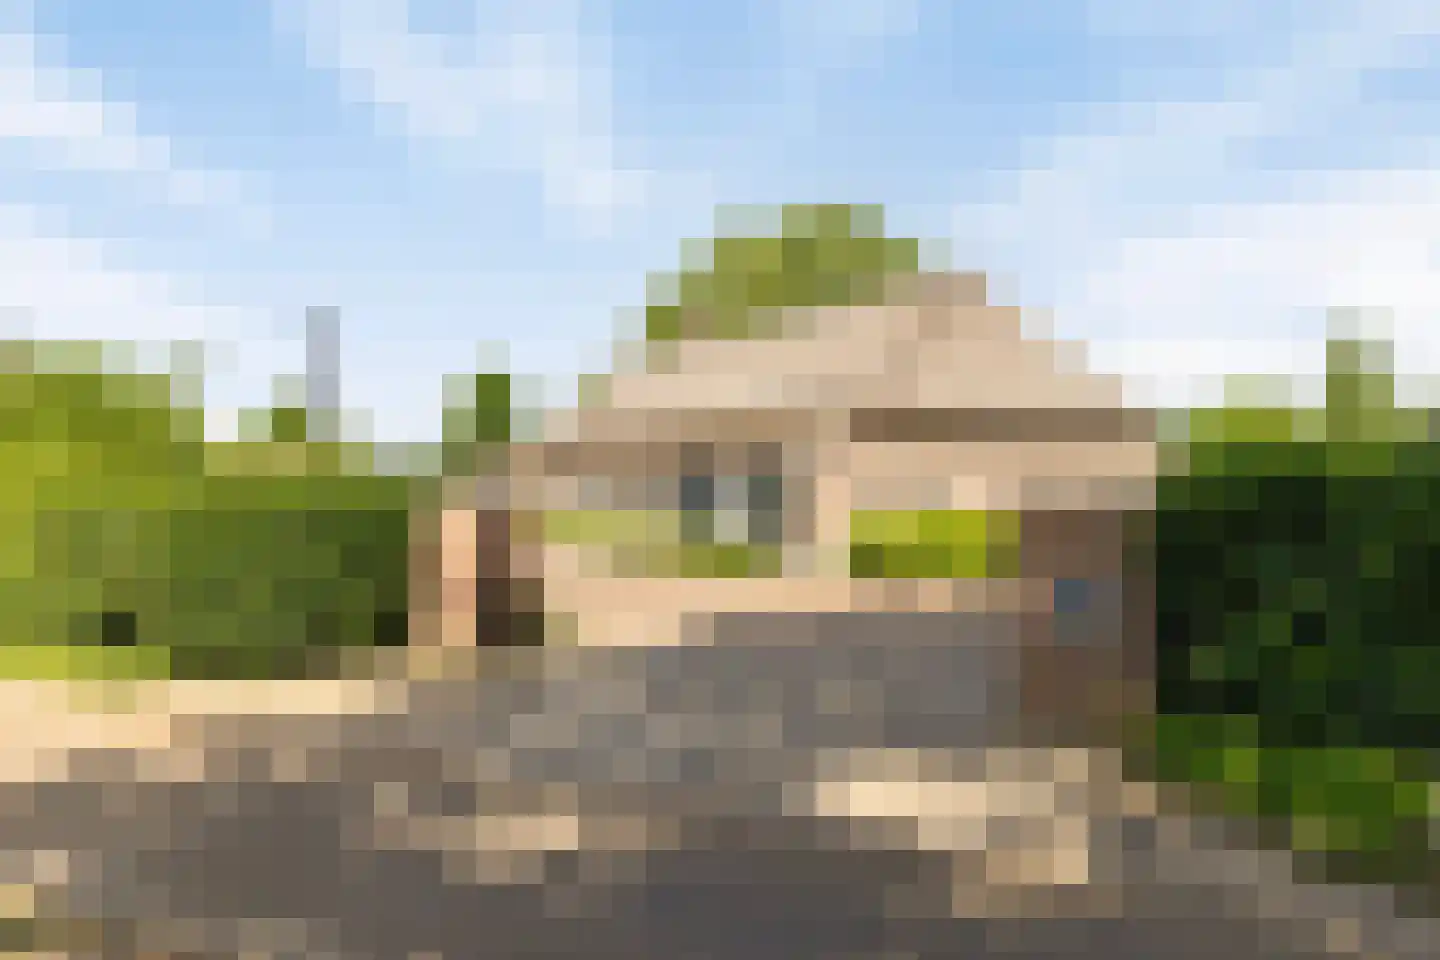
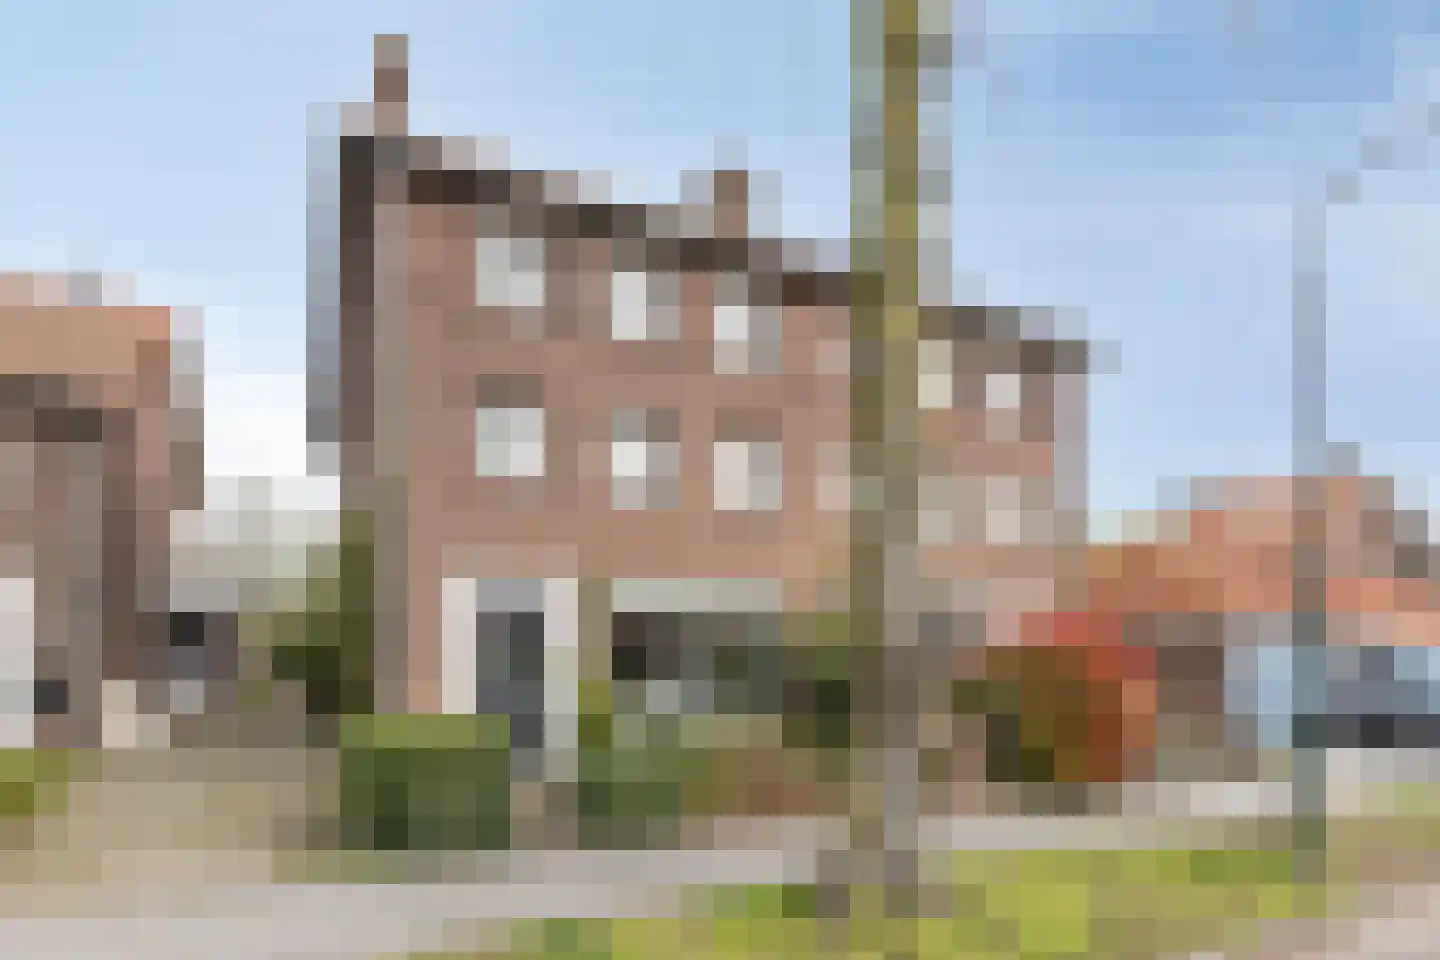
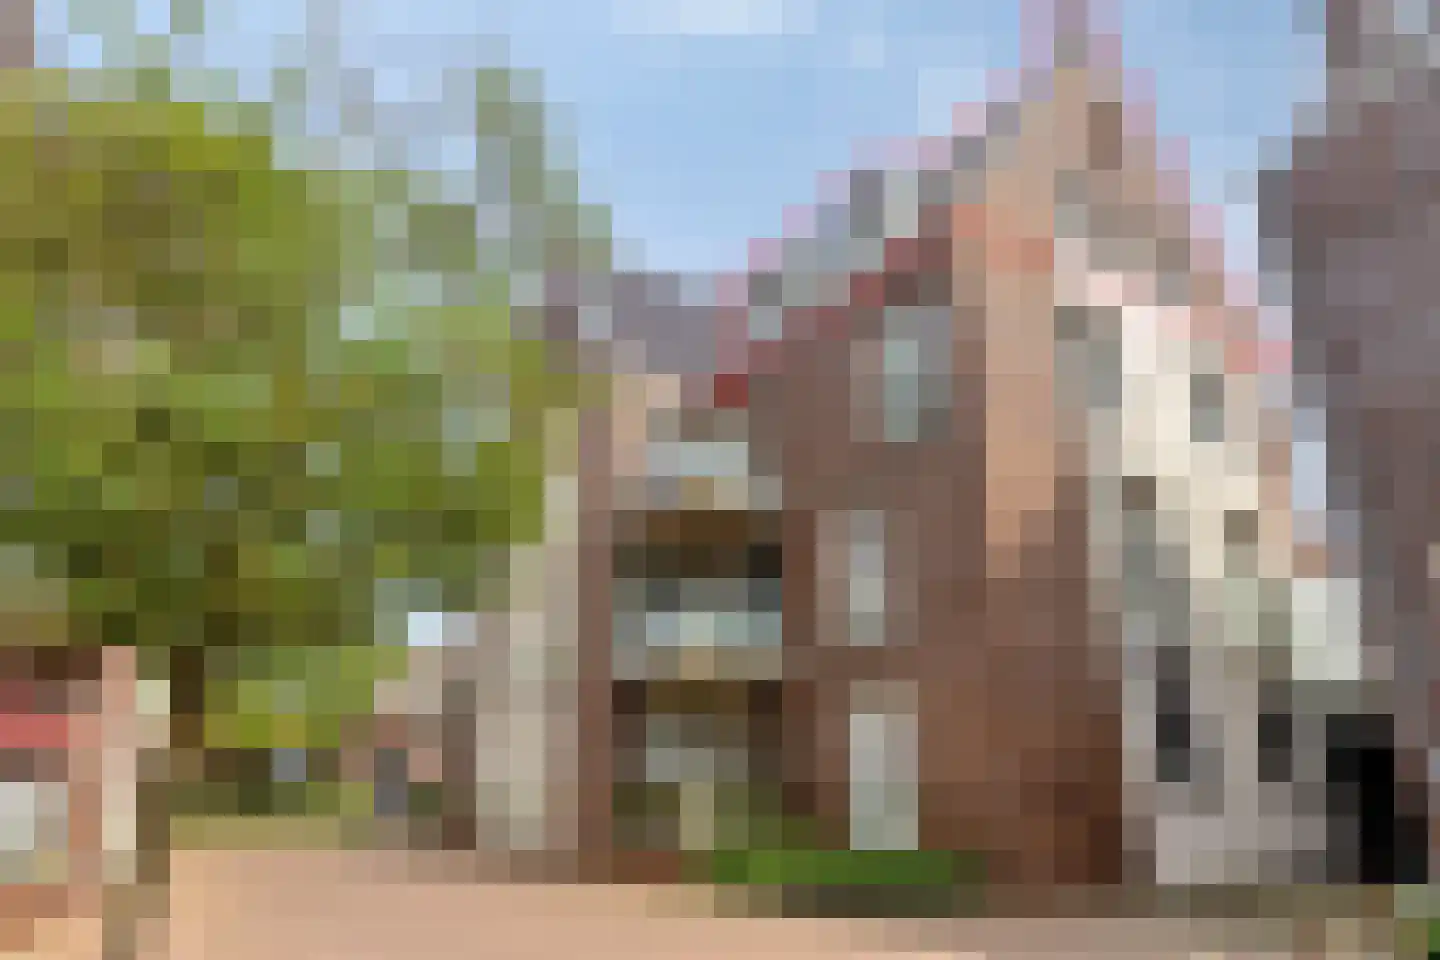
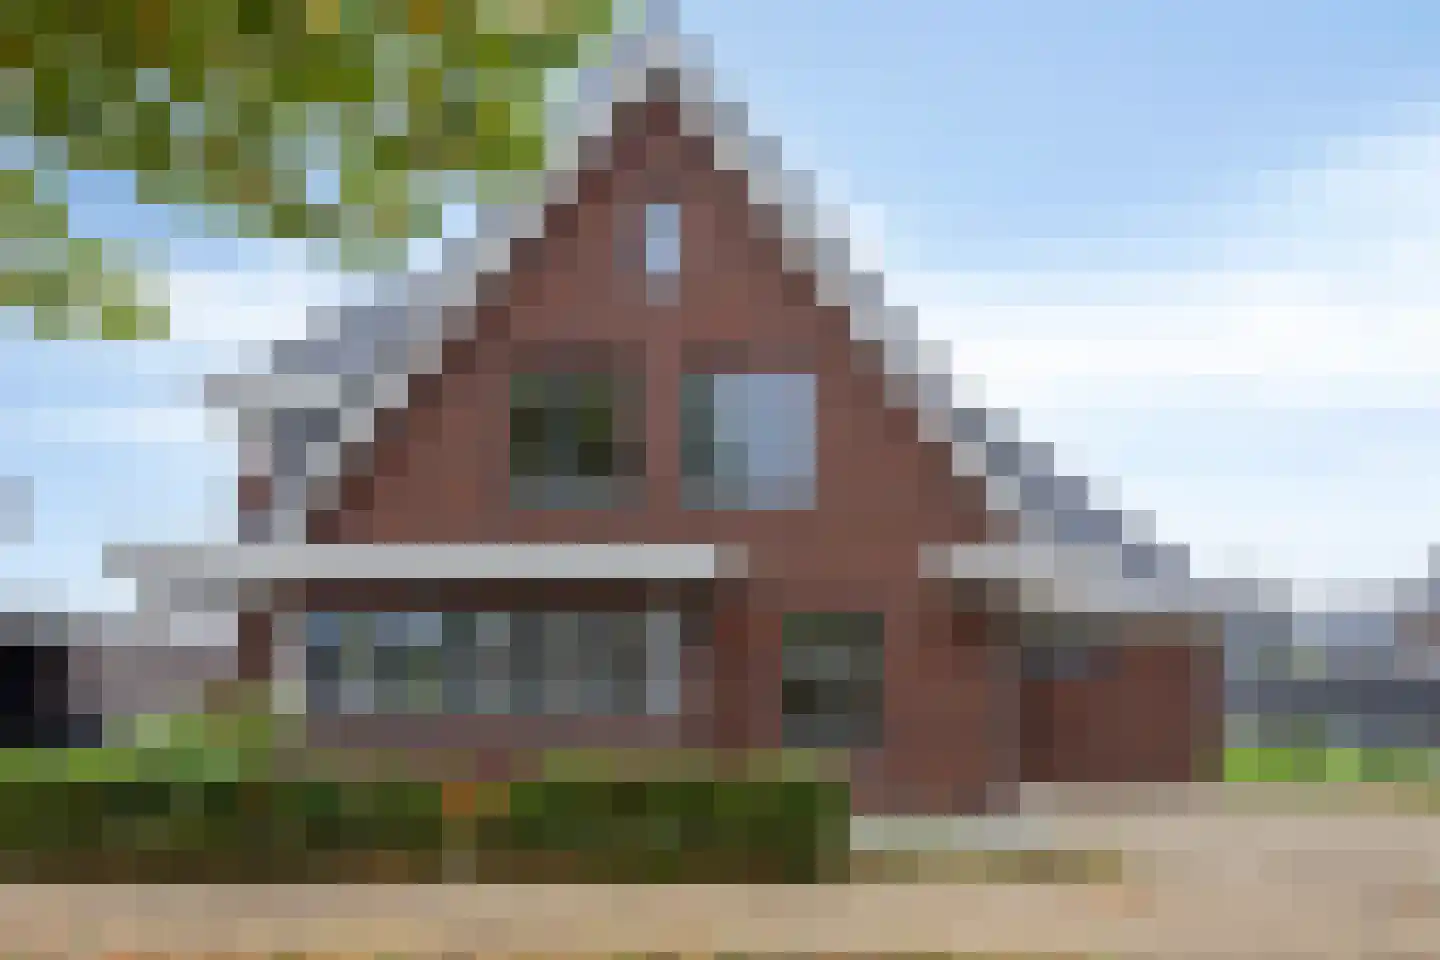
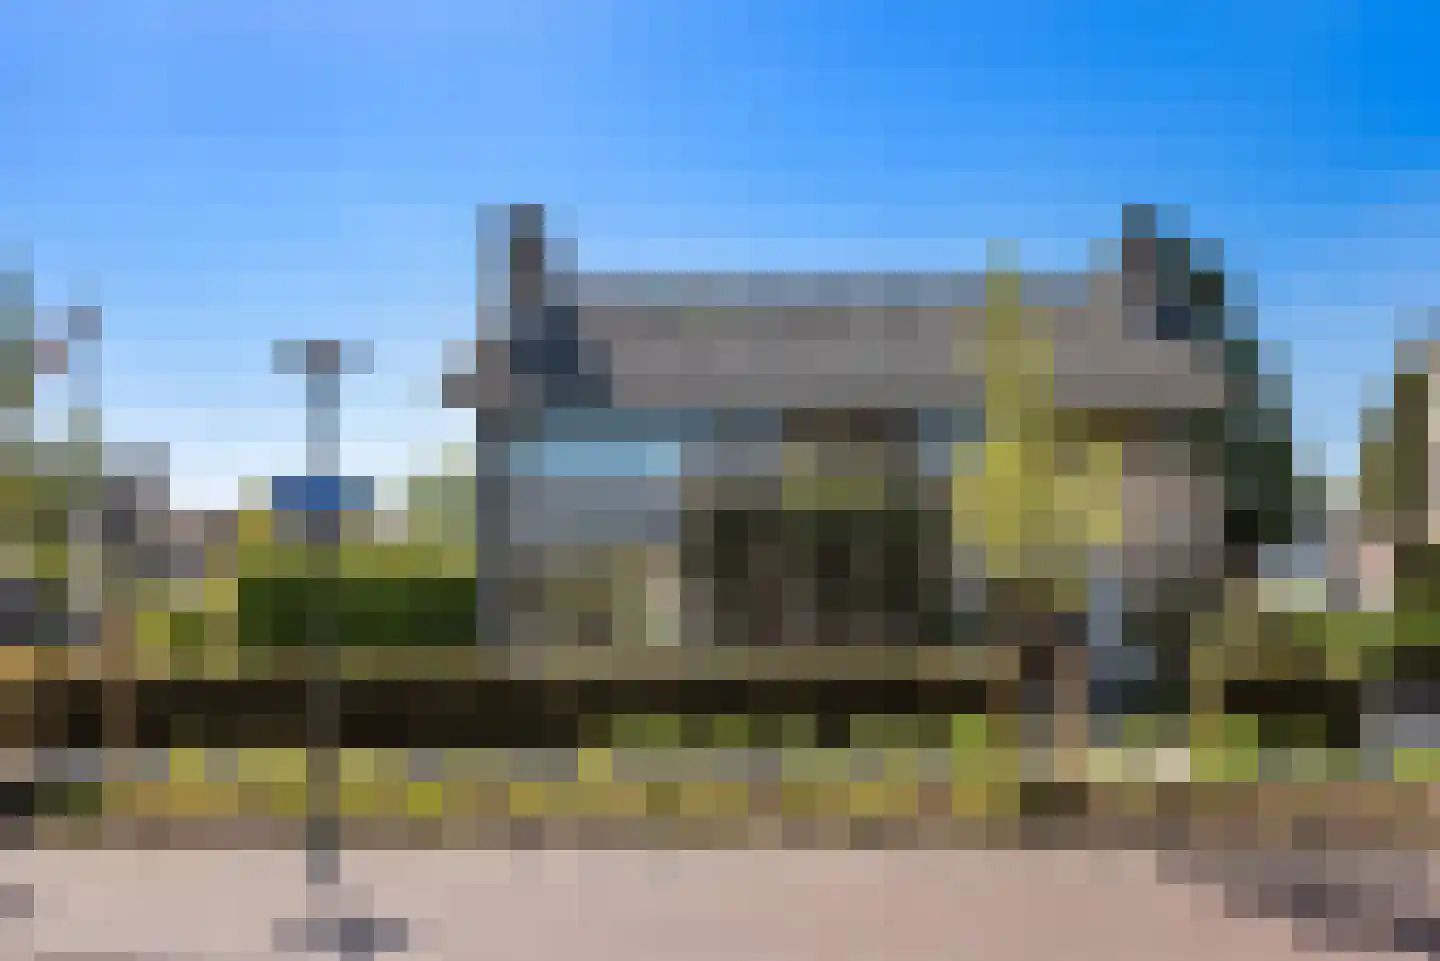
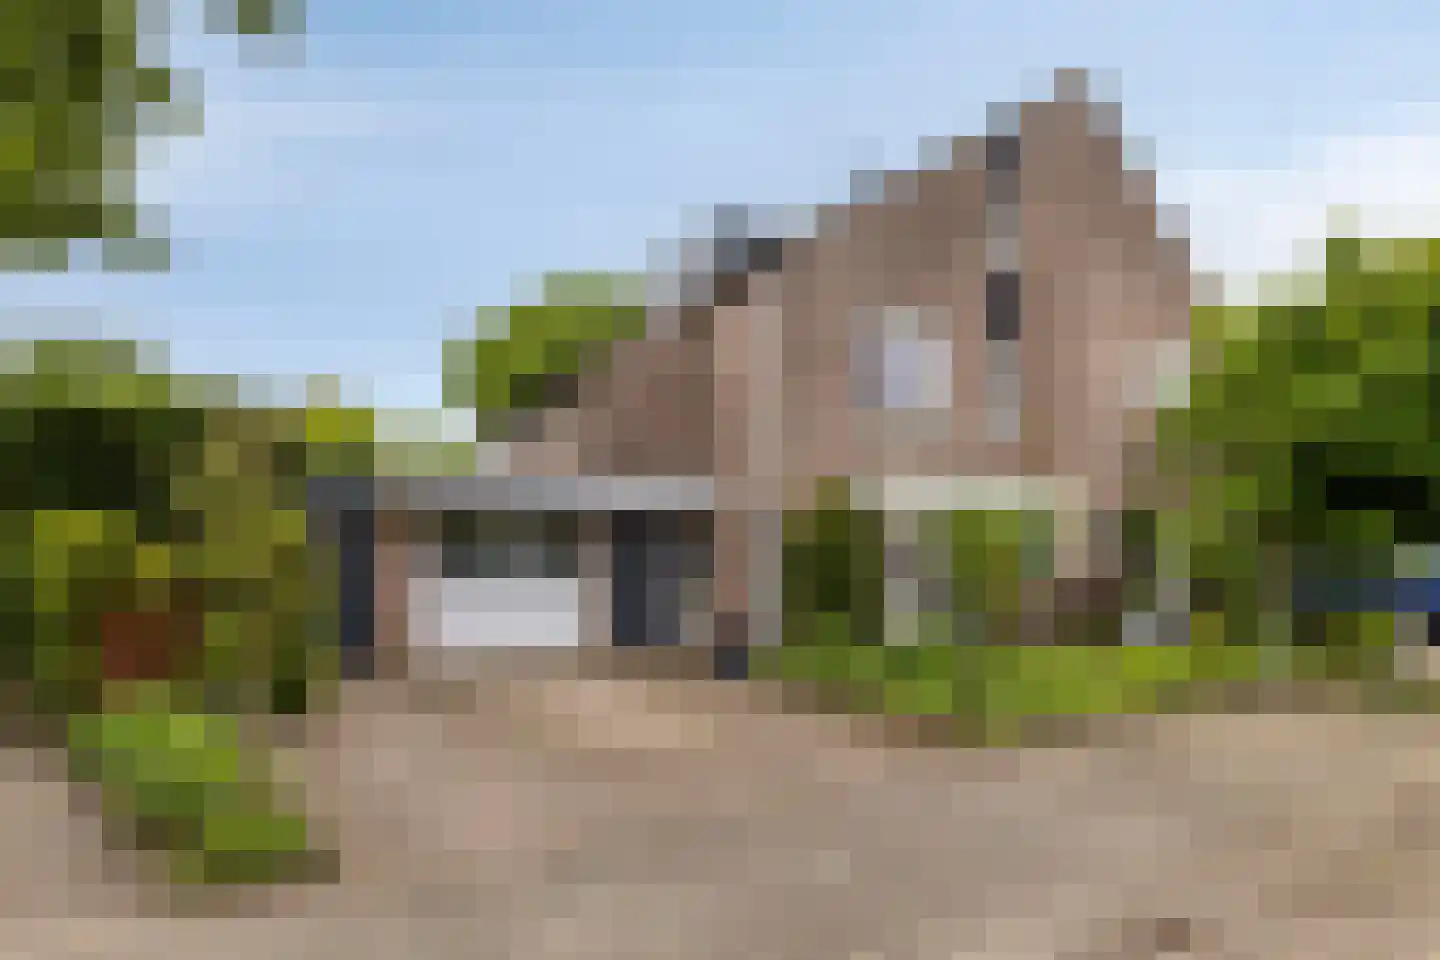
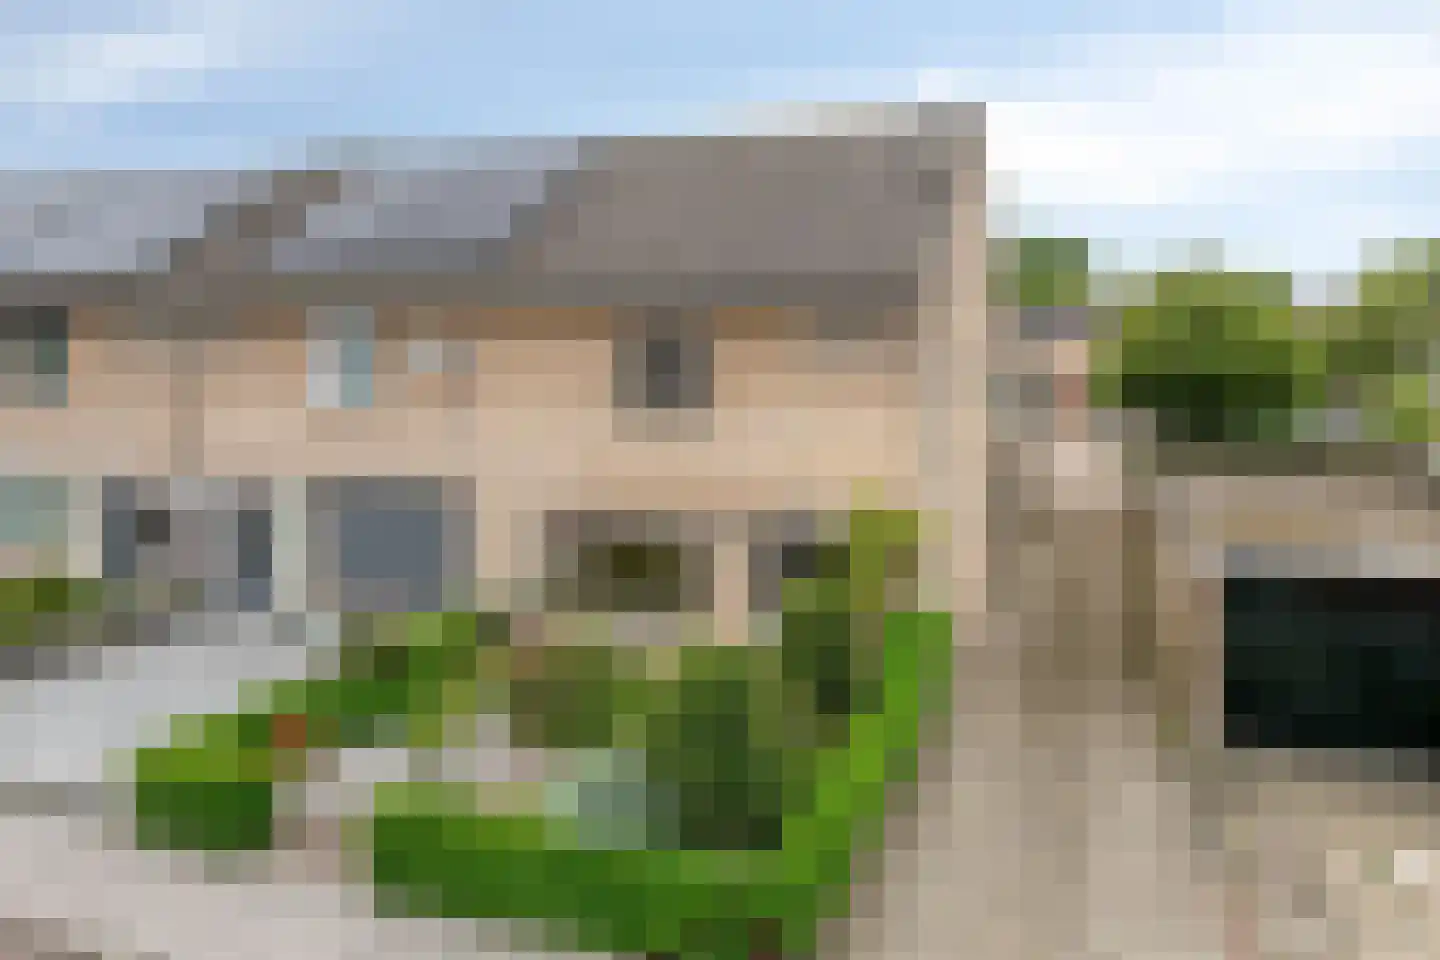
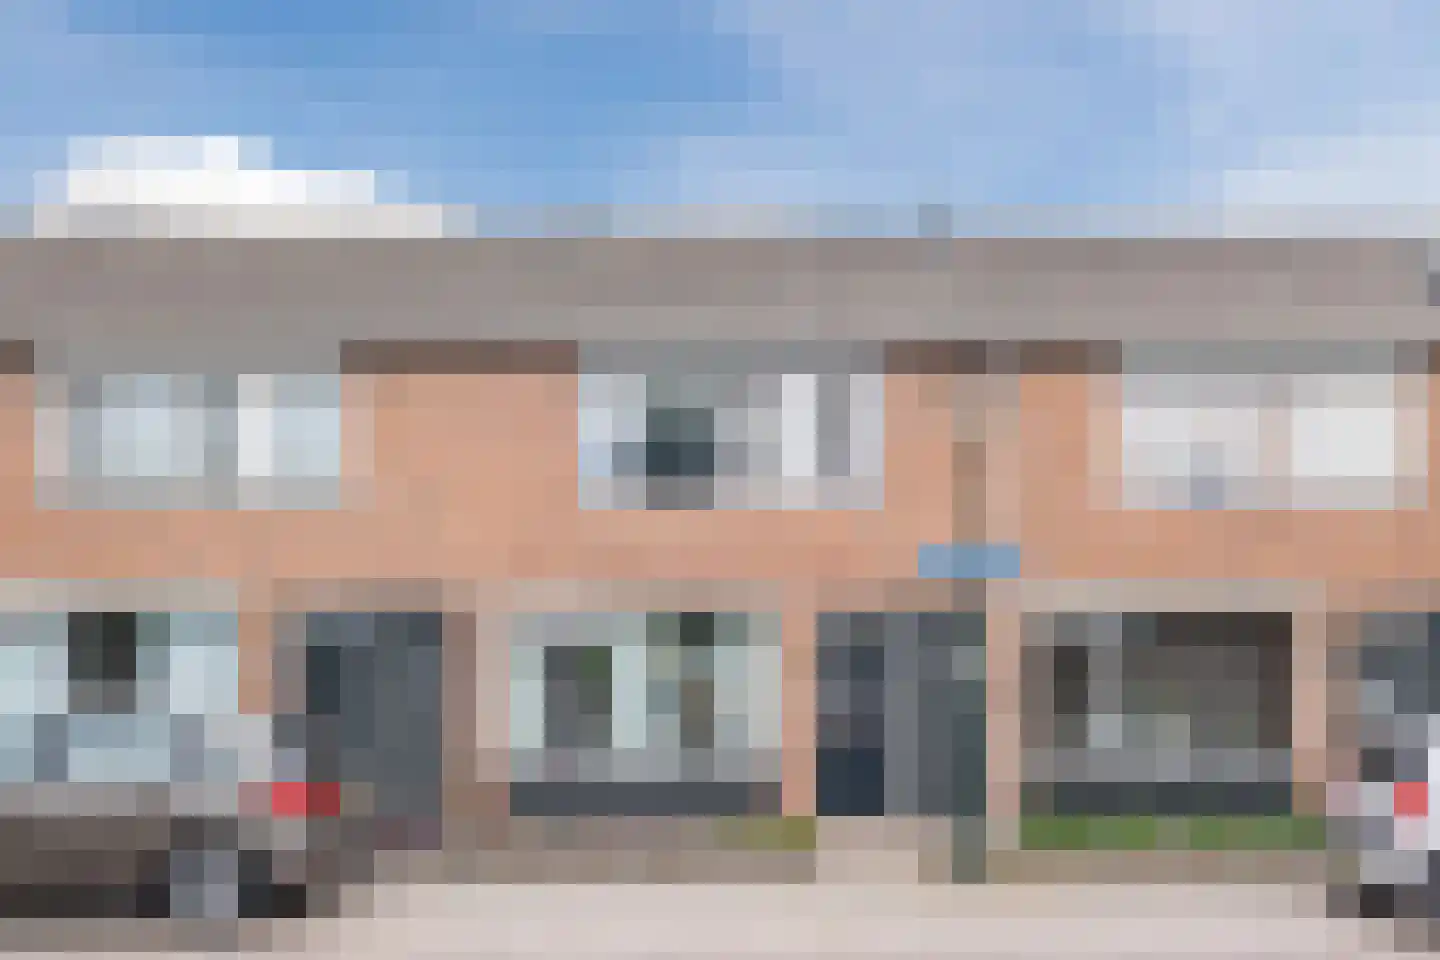
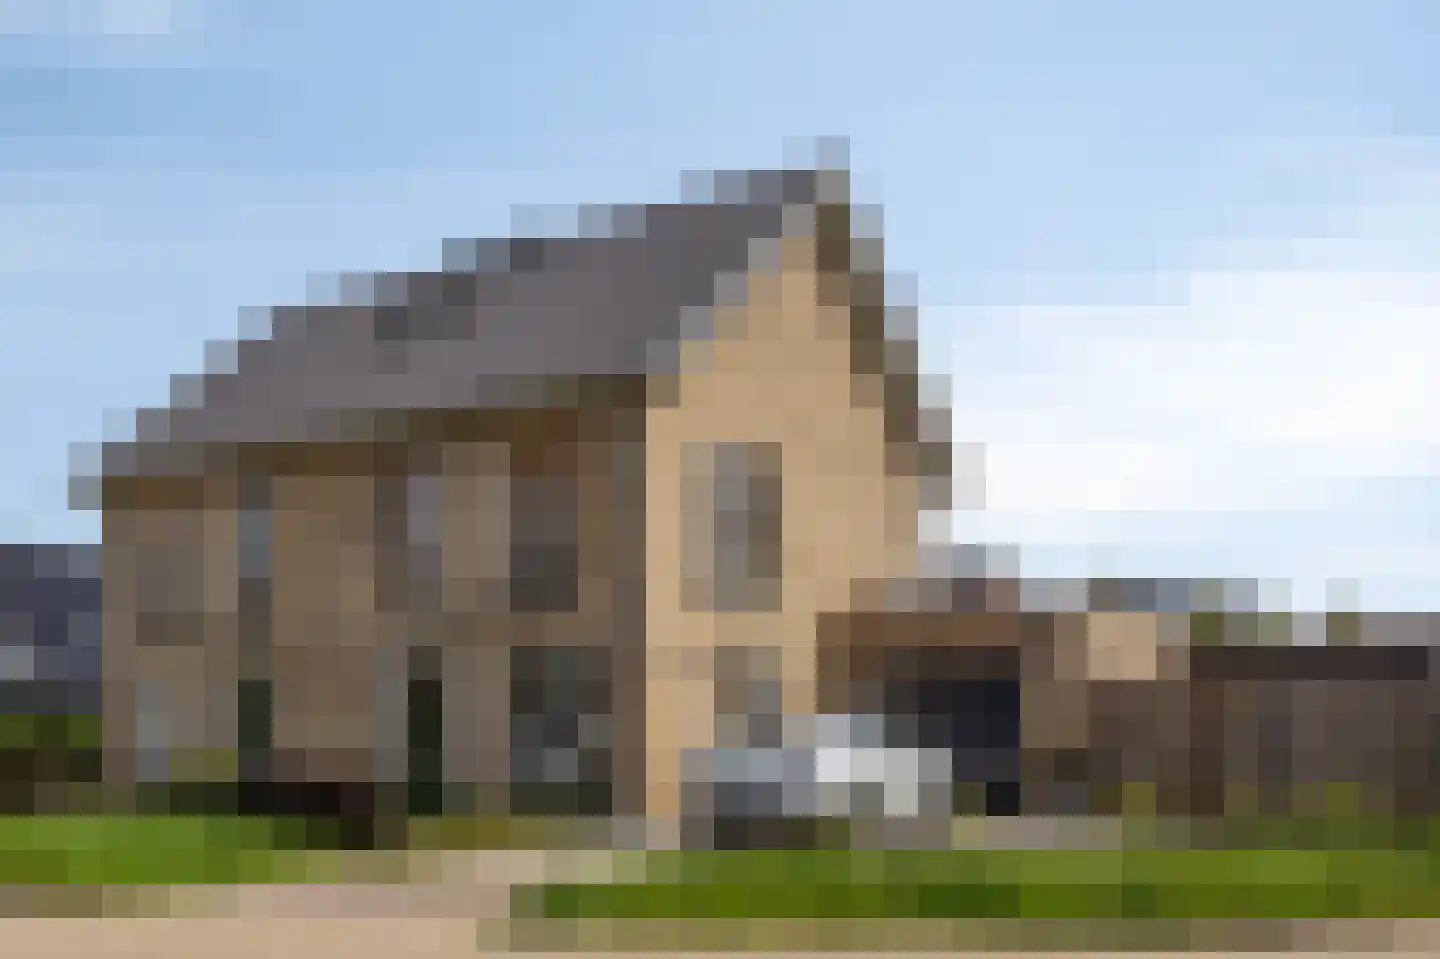
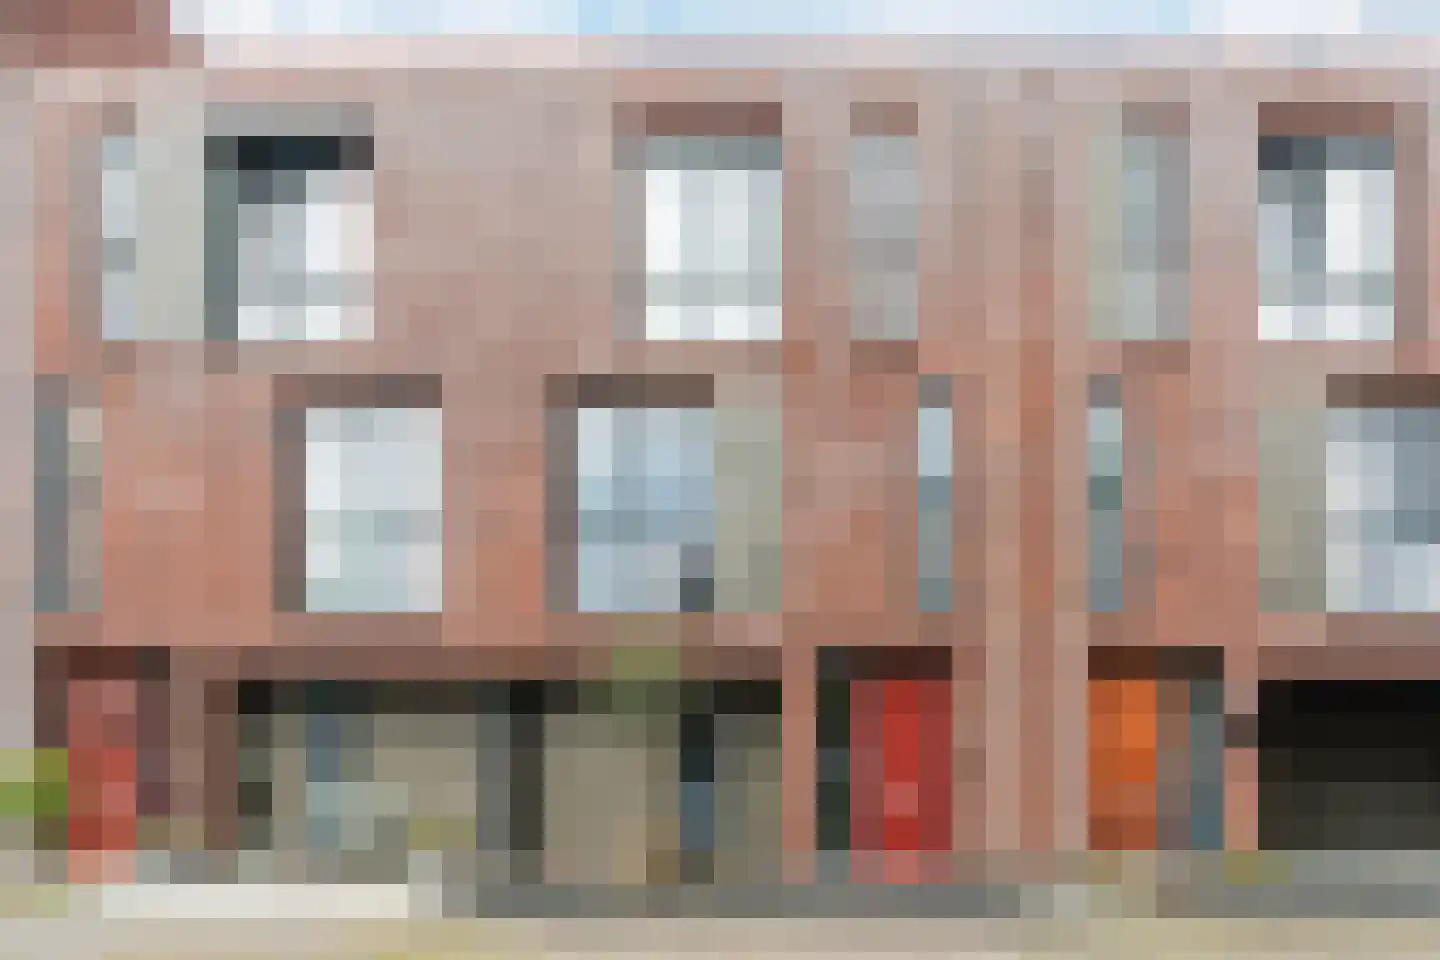
- Available
Meijerijstraat 21
5461HK Veghel
€ 250.000 k.k.
€ 3.968/m²
- Living area
- 63 m²
- Land area
- —
- Bedrooms
- 2
Searching in 513 houses in Veghel
Type to search. Use arrow down and arrow up to navigate through results and press Enter to open.
Hidden search suggestions.
View current properties in Veghel or search targeted on street, postal code and property characteristics.
View the current housing stock in Veghel and quickly filter by price, living area, rooms and more. There are currently 513 houses in this place within our selection. View also 356 sold houses in Veghel for extra insight into the local housing market.
5461HK Veghel
€ 250.000 k.k.
€ 3.968/m²
5463LP Veghel
€ 1.050.000 k.k.
€ 4.054/m²
5463PB Veghel
€ 2.295.000 k.k.
€ 6.253/m²
5461AJ Veghel
€ 449.000 k.k.
€ 3.184/m²
5464PP Veghel
€ 835.000 k.k.
€ 4.014/m²
5461GX Veghel
€ 375.000 k.k.
€ 4.412/m²
5467DS Veghel
€ 440.000 k.k.
€ 3.636/m²
5462AW Veghel
€ 525.000 k.k.
€ 3.671/m²
5464RB Veghel
€ 1.095.000 k.k.
€ 2.626/m²
5467KE Veghel
€ 489.000 k.k.
€ 4.794/m²
5466SB Veghel
€ 1.350 p/m
€ 27/m²
5462BA Veghel
€ 375.000 k.k.
€ 3.205/m²
5467CX Veghel
€ 469.000 k.k.
€ 3.350/m²
5463JG Veghel
€ 465.000 k.k.
€ 3.142/m²
5461KJ Veghel
€ 315.000 k.k.
€ 5.625/m²
5461JA Veghel
€ 639.000 k.k.
€ 4.597/m²
5463LN Veghel
€ 499.000 k.k.
€ 4.536/m²
5463HP Veghel
€ 375.000 k.k.
€ 2.930/m²
5461KR Veghel
€ 335.000 k.k.
€ 3.454/m²
5463EJ Veghel
€ 350.000 k.k.
€ 4.217/m²
5463MX Veghel
€ 675.000 k.k.
€ 4.623/m²
5467LA Veghel
€ 459.000 k.k.
€ 4.371/m²
5464PN Veghel
€ 409.000 k.k.
€ 4.648/m²
5463GV Veghel
€ 950.000 k.k.
€ 4.419/m²
5461AP Veghel
€ 1.075.000 k.k.
€ 4.864/m²
5461JV Veghel
€ 299.000 k.k.
€ 4.746/m²
5462CA Veghel
€ 425.000 k.k.
€ 3.935/m²
5467LL Veghel
€ 585.000 k.k.
€ 3.589/m²
Get free quotes from real estate agents with local market knowledge. Compare more than 40 real estate agents in Veghel.
Selling a home in Veghel? View the sales-oriented guide sell a house in Veghel, compare all real estate agents in Veghel or view the top 10 real estate agents in Veghel for extra context to your choice.
Real estate agents make sharper offers when they know you're comparing — ask for quotes for sale or purchase.
Practical answers about housing supply, sales and comparing real estate agents in Veghel.
The costs of a real estate agent in Veghel depend on commission, setup costs, property presentation and the chosen service. Compare the 40 real estate agents in Veghel via the real estate agent page and request multiple quotes to compare rates and approach well.
Within our selection, we are currently showing 513 houses in Veghel. View also the sold houses in Veghel to compare the current offering with recent transactions.
Take into account not only price and living area but also maintenance, energy label, location, outdoor space and sales status. This way you compare houses in Veghel on more than just the asking price.
A local real estate agent knows the neighborhoods, recent transactions and demand in Veghel. By comparing 40 real estate agents in the region you get a better insight into prices, sales strategy and expected yield; the top 10 in Veghel provides a useful starting point.
Yes, when making a sales plan, a valuation in Veghel is wise. You gain insight into a realistic asking price and can then compare offers from real estate agents specifically.
View current location data on residents, WOZ development, housing stock, energy consumption, business activity and safety in Veghel. In 2025 were there 34.805 residents. The average WOZ value in 2025 is EUR 416.000.
These figures help to better assess and compare the housing stock in Veghel with recent sold homes. Orient yourself then on suitable top real estate agents in Veghel for sales advice in this region.
Residents
34.805
Last year: 2025
Average WOZ
EUR 416.000
Last year: 2025
Average income per person.
EUR 34.700
Source: AllNumbers
Crimes (current year)
1.185
Total registered
| Year | Residents |
|---|---|
| 2021 | 32.585 |
| 2022 | 33.345 |
| 2023 | 33.895 |
| 2024 | 34.455 |
| 2025 | 34.805 |
| Year | Average WOZ |
|---|---|
| 2021 | EUR 284.000 |
| 2022 | EUR 315.000 |
| 2023 | EUR 375.000 |
| 2024 | EUR 390.000 |
| 2025 | EUR 416.000 |
Hoger
7.640
Praktisch
7.110
Middelbaar
11.450
Europa
3.795
Nederland
25.630
Buiten Europa
5.375
Label A
4.312
Label C
4.307
Label B
2.841
Label D
1.129
Label F
600
Label G
594
Label A+++
585
Label A+
500
Label E
439
Label A++
316
Label A++++
134
Label A+++++
11
| Year | Gas (m3) | Electricity (kWh) |
|---|---|---|
| 2020 | 1.270 | 3.130 |
| 2021 | 1.410 | 3.190 |
| 2022 | 1.080 | 2.970 |
| 2023 | 910 | 2.850 |
| 2024 | 860 | 2.950 |
Hoekwoning
Gas: 920 • Electricity: 2.720
Huurwoning
Gas: 700 • Electricity: 2.030
Koopwoning
Gas: 1.000 • Electricity: 3.210
Appartement
Gas: 550 • Electricity: 1.860
Tussenwoning
Gas: 810 • Electricity: 2.520
Vrijstaande woning
Gas: 1.360 • Electricity: 4.340
Twee-onder-één-kap woning
Gas: 1.100 • Electricity: 3.400
Total number of company establishments: 4.485
| Period | Crimes |
|---|---|
| jan 2025 | 101 |
| jan 2026 | 93 |
| jul 2025 | 92 |
| jun 2025 | 91 |
| mei 2025 | 120 |
| mrt 2025 | 113 |
| nov 2024 | 91 |
| nov 2025 | 81 |
| okt 2024 | 85 |
| okt 2025 | 114 |
| sep 2024 | 83 |
| sep 2025 | 100 |
These figures give an indicative picture of safety trends in the living environment of Veghel.
Short answers based on current local statistics, handy for a quick comparison of the living environment.
Veghel telt in 2025 ongeveer 34.805 inwoners.
De gemiddelde WOZ-waarde in Veghel is in 2025 circa € 416.000.
Het gemiddelde inkomen per inwoner in Veghel ligt rond € 34.700 per jaar.
Voor het huidige jaar gaat het om ongeveer 1.185 geregistreerde misdrijven. Gebruik deze cijfers als indicatie en vergelijk trends per periode.
In Veghel komt vooral "Tussenwoningen" veel voor, met ongeveer 5.417 woningen.