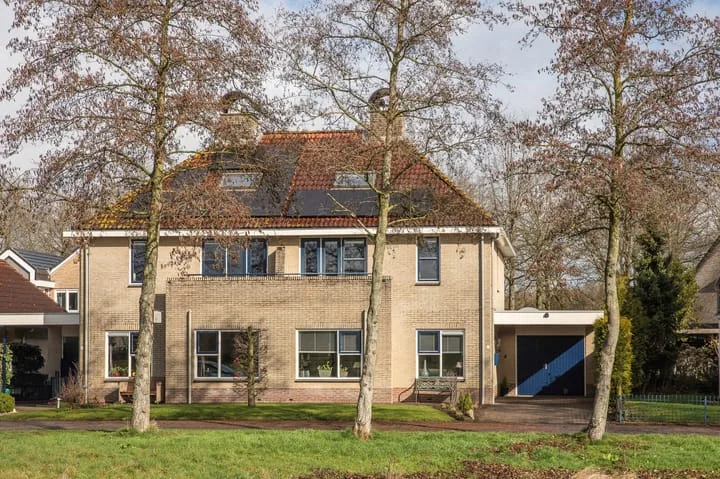
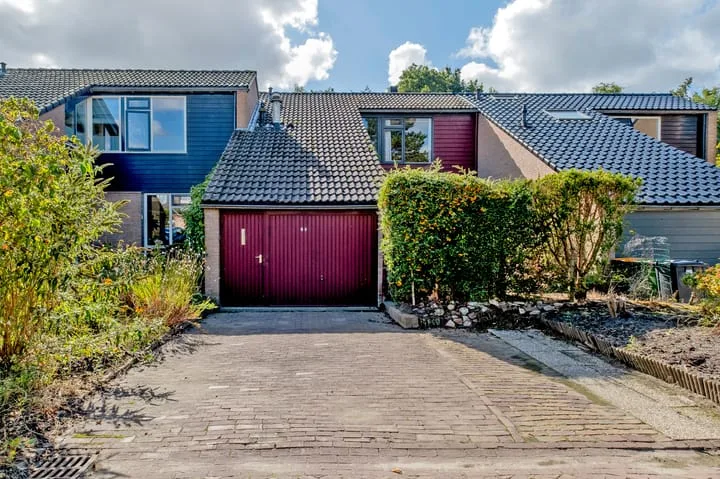
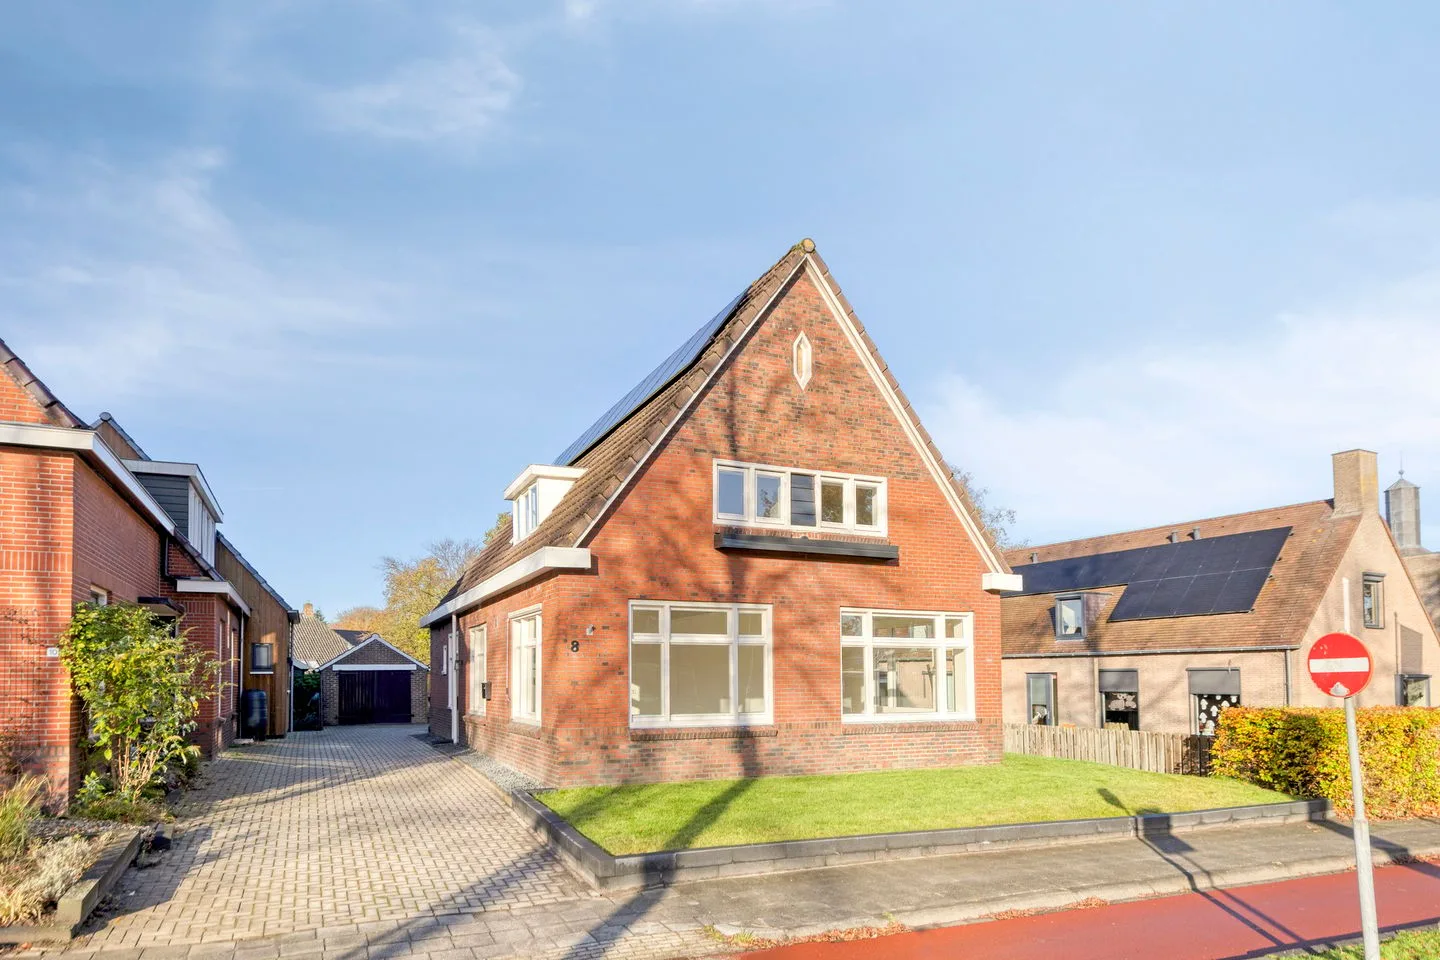
Houses sold in Vries

View 43 sold houses in Vries

Connected to: Vastgoed Nederland NVM Makelaars

On this page you will find recently sold homes in Vries. Use this overview to better estimate selling prices, popular neighborhoods, and the local housing supply before you choose a real estate agent. Also view the current housing supply with 56 houses in Vries.

Selection

Search and filter homes

Set your preferences and discover homes that suit you.

Total supply 242.442
Filters

Set price, area and other characteristics. Adjust a filter or click on Show homes. Location changes directly above.

Reset filters

You search for

  • Place Vries
  • Status Sold

Huis verkopen in Vries? Vergelijk verkoopmakelaars

Bekijk recente verkopen en ontvang gratis offertes van lokale makelaars. Vergelijk meer dan 39 makelaars in Vries.

Free request a quote

  • Quotes in Vries
  • Non-binding
  • Personal
  • Gratis tarieven vergelijken

Zelf je woning verkopen in Vries? Vergelijk verkoopmakelaars in Vries of bekijk de beste verkoopmakelaars in Vries als referentie bij jouw keuze.

Vergelijk meerdere offertes

Makelaars maken scherpere voorstellen als ze weten dat je vergelijkt — vraag offertes aan voor verkoop of aankoop.

Frequently asked questions about sold homes in Vries

Short answers about housing prices, sold homes and comparing real estate agents in Vries.

Residential and neighborhood statistics in Vries

View current location data on residents, WOZ development, housing stock, energy consumption, business activity and safety in Vries. In 2025 were there 4.180 residents. The average WOZ value in 2025 is EUR 365.000.

These figures help to better assess and compare the housing stock in Vries with recent sold homes. Orient yourself then on suitable top real estate agents in Vries for sales advice in this region.

Residents

4.180

Last year: 2025

Average WOZ

EUR 365.000

Last year: 2025

Average income per person.

EUR 35.200

Source: AllNumbers

Crimes (current year)

81

Total registered

Demographics and WOZ development

Inhabitants per year

Inhabitants per year in Vries
Year Residents
2021 4.045
2022 4.045
2023 4.125
2024 4.210
2025 4.180

Annual WOZ value

WOZ value per year in Vries
Year Average WOZ
2021 EUR 266.000
2022 EUR 296.000
2023 EUR 337.000
2024 EUR 347.000
2025 EUR 365.000

Composition of residents

Age build-up

65+: 1.355 0-15: 500 15-25: 360 25-45: 795 45-65: 1.170

Education level

Hoger

1.070

Praktisch

810

Middelbaar

1.140

Origin of residents (2025)

Europa

205

Nederland

3.710

Buiten Europa

270

Housing stock and construction periods

Types of homes

Hoekwoningen 335
Appartementen 161
Tussenwoningen 432
Vrijstaande woningen 644
Twee-onder-één-kap woningen 419

Construction period of buildings

Voor 1700 0
1700 tot 1900 44
1900 tot 1925 76
1925 tot 1950 128
1950 tot 1970 414
1970 tot 1980 452
1980 tot 1990 439
1990 tot 2000 218
2000 tot 2010 57
2010 tot 2020 20
2020 en later 126

Energy and sustainability

Energy label distribution

Label C

603

Label A

359

Label B

355

Label D

169

Label G

143

Label F

101

Label E

76

Label A++++

51

Label A+++

30

Label A++

22

Label A+

21

Label A+++++

1

Average energy consumption per year

Average energy consumption per year in Vries
Year Gas (m3) Electricity (kWh)
2020 1.560 2.790
2021 1.770 2.850
2022 1.380 2.630
2023 1.130 2.470
2024 1.060 2.620

Consumption per house type

Hoekwoning

Gas: 1.010 • Electricity: 1.870

Huurwoning

Gas: 920 • Electricity: 1.900

Koopwoning

Gas: 1.200 • Electricity: 2.680

Appartement

Gas: 790 • Electricity: 2.000

Tussenwoning

Gas: 920 • Electricity: 1.810

Vrijstaande woning

Gas: 1.410 • Electricity: 3.170

Twee-onder-één-kap woning

Gas: 1.120 • Electricity: 2.730

Business activity in Vries (2025)

Handel en HORECA 70
Nijverheid en energie 45
Zakelijke dienstverlening 105
Overheid, onderwijs en zorg 110
Landbouw, bosbouw en visserij 15
Vervoer, informatie en communicatie 20
Financiele diensten en onroerendgoed 20
Cultuur, recreatie en overige diensten 55

Total number of company establishments: 445

Recent crime statistics

Recent crime statistics in Vries
Period Crimes
jan 2025 8
jan 2026 4
jul 2025 12
jun 2025 12
mei 2025 5
mrt 2025 7
nov 2024 7
nov 2025 5
okt 2024 7
okt 2025 8
sep 2024 5
sep 2025 8

These figures give an indicative picture of safety trends in the living environment of Vries.

Frequently asked questions about living in Vries

Short answers based on current local statistics, handy for a quick comparison of the living environment.

Hoeveel inwoners heeft Vries?

Vries telt in 2025 ongeveer 4.180 inwoners.

Wat is de gemiddelde WOZ-waarde in Vries?

De gemiddelde WOZ-waarde in Vries is in 2025 circa € 365.000.

Wat is het gemiddelde inkomen per inwoner in Vries?

Het gemiddelde inkomen per inwoner in Vries ligt rond € 35.200 per jaar.

Hoe veilig is wonen in Vries?

Voor het huidige jaar gaat het om ongeveer 81 geregistreerde misdrijven. Gebruik deze cijfers als indicatie en vergelijk trends per periode.

Welke woningtypen komen het meest voor in Vries?

In Vries komt vooral "Vrijstaande woningen" veel voor, met ongeveer 644 woningen.

Gratis vrijblijvende offertes ontvangen

Vergelijk meerdere makelaars en kies de beste match.