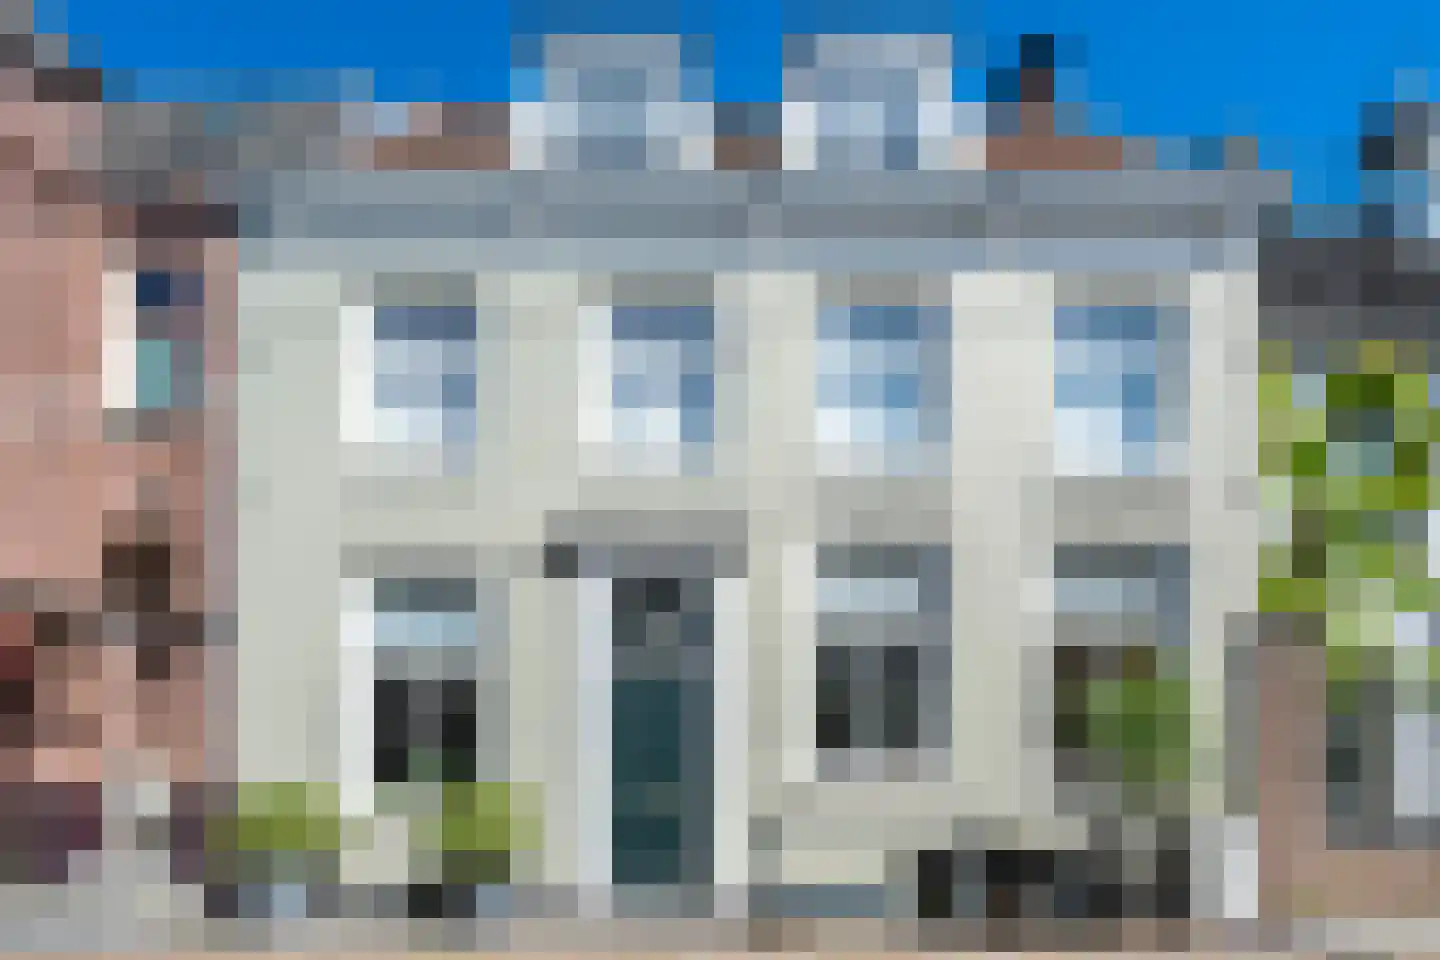
Housing offer in Wijk bij Duurstede

Searching in 215 houses in Wijk bij Duurstede

Connected to: Vastgoed Nederland NVM Makelaars

View the current housing stock in Wijk bij Duurstede and quickly filter by price, living area, rooms and more. There are currently 215 houses in this place within our selection. View also 155 sold houses in Wijk bij Duurstede for extra insight into the local housing market.

Selection

Search and filter homes

Set your preferences and discover homes that suit you.

Total supply 244.758
Filters

Set price, area and other characteristics. Adjust a filter or click on Show homes. Location changes directly above.

Reset filters

You search for

  • Place Wijk bij Duurstede

Selling a home in Wijk bij Duurstede? Compare realtor offers

Get free quotes from real estate agents with local market knowledge. Compare more than 38 real estate agents in Wijk bij Duurstede.

Free request a quote

  • Quotes in Wijk bij Duurstede
  • Non-binding
  • Personal
  • Compare free rates

Selling a home in Wijk bij Duurstede? View the sales-oriented guide sell a house in Wijk bij Duurstede, compare all real estate agents in Wijk bij Duurstede or view the top 10 real estate agents in Wijk bij Duurstede for extra context to your choice.

Compare multiple quotes

Real estate agents make sharper offers when they know you're comparing — ask for quotes for sale or purchase.

Frequently asked questions about homes in Wijk bij Duurstede

Practical answers about housing supply, sales and comparing real estate agents in Wijk bij Duurstede.

Residential and neighborhood statistics in Wijk bij Duurstede

View current location data on residents, WOZ development, housing stock, energy consumption, business activity and safety in Wijk bij Duurstede. In 2025 were there 18.055 residents. The average WOZ value in 2025 is EUR 436.973.

These figures help to better assess and compare the housing stock in Wijk bij Duurstede with recent sold homes. Orient yourself then on suitable top real estate agents in Wijk bij Duurstede for sales advice in this region.

Residents

18.055

Last year: 2025

Average WOZ

EUR 436.973

Last year: 2025

Average income per person.

EUR 34.777

Source: AllNumbers

Crimes (current year)

340

Total registered

Demographics and WOZ development

Inhabitants per year

Inhabitants per year in Wijk bij Duurstede
Year Residents
2021 18.215
2022 18.190
2023 18.205
2024 18.100
2025 18.055

Annual WOZ value

WOZ value per year in Wijk bij Duurstede
Year Average WOZ
2021 EUR 307.705
2022 EUR 341.918
2023 EUR 402.835
2024 EUR 418.216
2025 EUR 436.973

Composition of residents

Age build-up

65+: 4.540 0-15: 2.750 15-25: 1.870 25-45: 3.865 45-65: 5.020

Education level

Hoger

4.270

Praktisch

3.110

Middelbaar

6.130

Origin of residents (2025)

Europa

890

Nederland

15.270

Buiten Europa

1.895

Housing stock and construction periods

Types of homes

Hoekwoningen 1.467
Appartementen 1.851
Tussenwoningen 4.224
Vrijstaande woningen 412
Twee-onder-één-kap woningen 342

Construction period of buildings

Voor 1700 12
1700 tot 1900 270
1900 tot 1925 84
1925 tot 1950 198
1950 tot 1970 628
1970 tot 1980 1.925
1980 tot 1990 2.324
1990 tot 2000 948
2000 tot 2010 258
2010 tot 2020 424
2020 en later 124

Energy and sustainability

Energy label distribution

Label C

3.366

Label A

1.794

Label B

1.707

Label D

402

Label G

235

Label F

229

Label E

220

Label A+

106

Label A+++

80

Label A++

41

Label A++++

7

Label A+++++

2

Average energy consumption per year

Average energy consumption per year in Wijk bij Duurstede
Year Gas (m3) Electricity (kWh)
2020 1.142 3.000
2021 1.272 3.031
2022 992 2.811
2023 831 2.612
2024 806 2.661

Consumption per house type

Hoekwoning

Gas: 950 • Electricity: 2.767

Huurwoning

Gas: 715 • Electricity: 2.133

Koopwoning

Gas: 889 • Electricity: 2.808

Appartement

Gas: 568 • Electricity: 2.127

Tussenwoning

Gas: 831 • Electricity: 2.575

Vrijstaande woning

Gas: 1.408 • Electricity: 3.979

Twee-onder-één-kap woning

Gas: 1.124 • Electricity: 3.276

Business activity in Wijk bij Duurstede (2025)

Handel en HORECA 370
Nijverheid en energie 345
Zakelijke dienstverlening 635
Overheid, onderwijs en zorg 440
Landbouw, bosbouw en visserij 45
Vervoer, informatie en communicatie 135
Financiele diensten en onroerendgoed 125
Cultuur, recreatie en overige diensten 240

Total number of company establishments: 2.340

Recent crime statistics

Recent crime statistics in Wijk bij Duurstede
Period Crimes
jan 2026 33
jul 2025 30
jun 2025 28
mei 2025 41
mrt 2025 29
mrt 2026 28
nov 2024 32
nov 2025 22
okt 2024 36
okt 2025 33
sep 2024 22
sep 2025 32

These figures give an indicative picture of safety trends in the living environment of Wijk bij Duurstede.

Frequently asked questions about living in Wijk bij Duurstede

Short answers based on current local statistics, handy for a quick comparison of the living environment.

Hoeveel inwoners heeft Wijk bij Duurstede?

Wijk bij Duurstede telt in 2025 ongeveer 18.055 inwoners.

Wat is de gemiddelde WOZ-waarde in Wijk bij Duurstede?

De gemiddelde WOZ-waarde in Wijk bij Duurstede is in 2025 circa € 436.973.

Wat is het gemiddelde inkomen per inwoner in Wijk bij Duurstede?

Het gemiddelde inkomen per inwoner in Wijk bij Duurstede ligt rond € 34.777 per jaar.

Hoe veilig is wonen in Wijk bij Duurstede?

Voor het huidige jaar gaat het om ongeveer 340 geregistreerde misdrijven. Gebruik deze cijfers als indicatie en vergelijk trends per periode.

Welke woningtypen komen het meest voor in Wijk bij Duurstede?

In Wijk bij Duurstede komt vooral "Tussenwoningen" veel voor, met ongeveer 4.224 woningen.

Receive free, non-binding quotes

Compare multiple real estate agents and choose the best match.