- Sold
Burg. Baron van Hövellstraat 5
6321DB Wijlre
€ 329.000 k.k.
€ 4.061/m²
B
Save as favorite
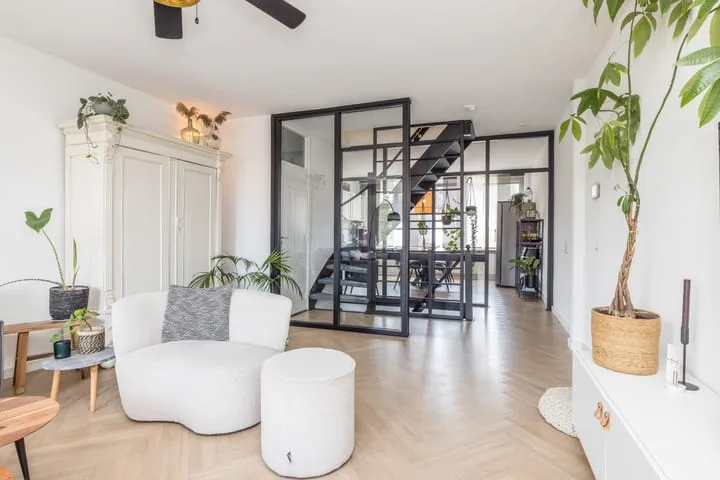
- Living area
- 81 m²
- Land area
- 160 m²
- Bedrooms
- 3