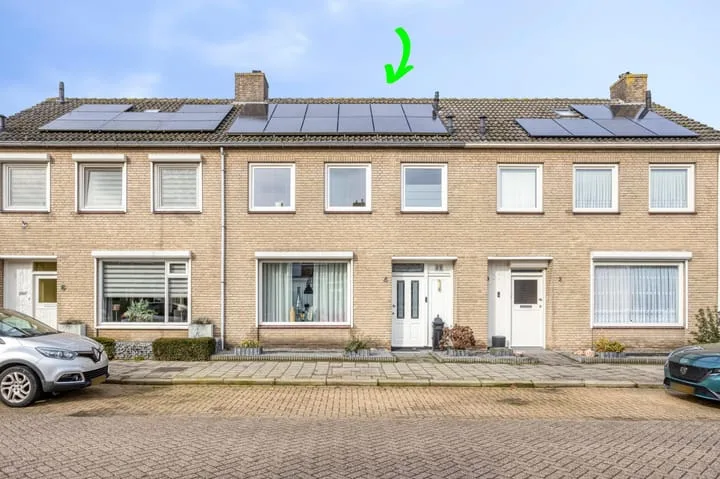
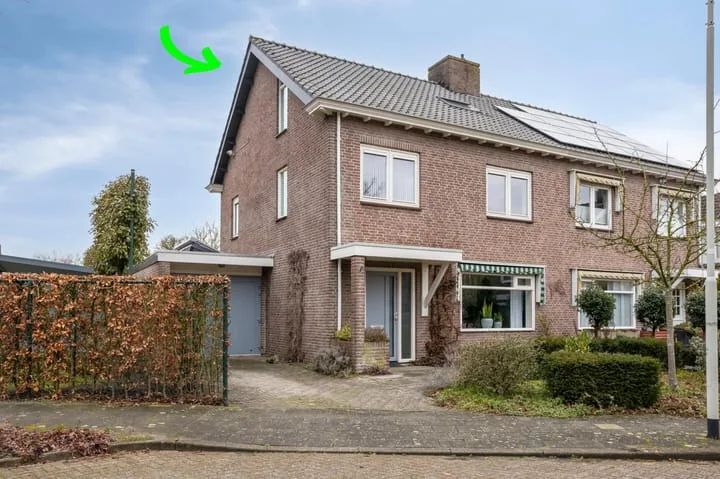
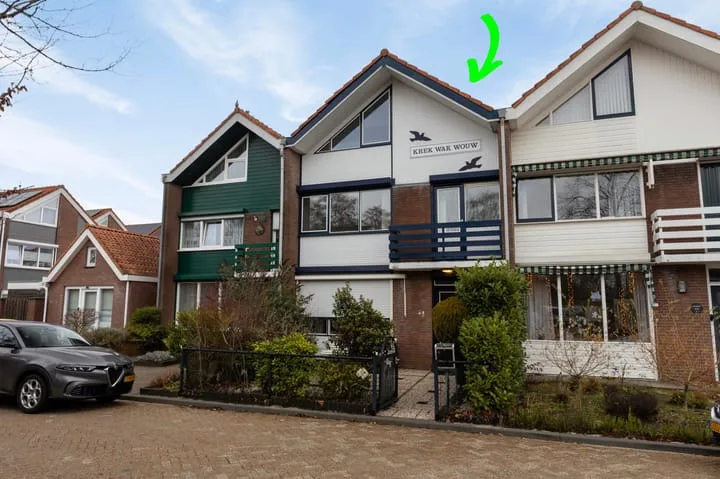
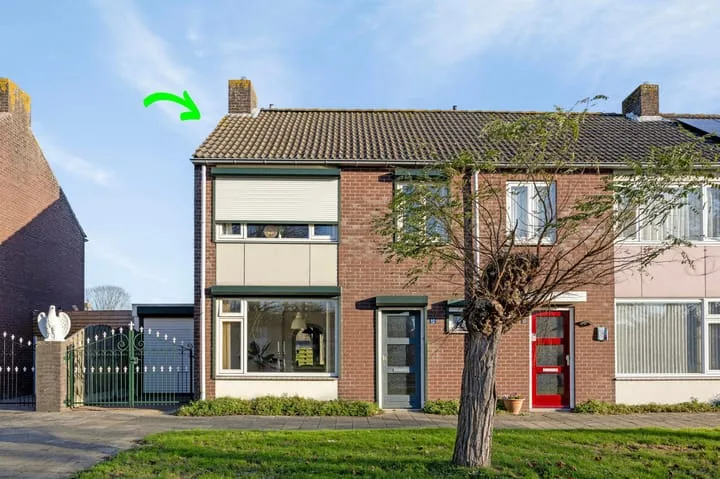
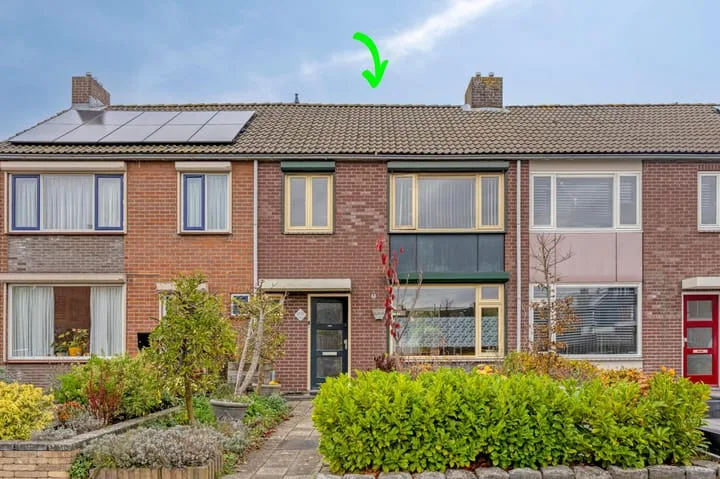
- Sold
Glymesstraat 9
4724AP Wouw
€ 459.000 k.k.
€ 3.702/m²
- Living area
- 124 m²
- Land area
- 564 m²
- Bedrooms
- 4
View 38 sold houses in Wouw
Type to search. Use arrow down and arrow up to navigate through results and press Enter to open.
Hidden search suggestions.
Compare sold homes in Wouw or view the current offering in this location directly.
On this page you will find recently sold homes in Wouw. Use this overview to better estimate selling prices, popular neighborhoods, and the local housing supply before you choose a real estate agent. Also view the current housing supply with 58 houses in Wouw.
4724AP Wouw
€ 459.000 k.k.
€ 3.702/m²
4724BP Wouw
€ 545.000 k.k.
€ 3.893/m²
4724EE Wouw
€ 320.000 k.k.
€ 4.103/m²
4724ES Wouw
€ 349.500 k.k.
€ 3.360/m²
4724CW Wouw
€ 729.000 k.k.
€ 4.072/m²
4724AL Wouw
€ 449.000 k.k.
€ 5.044/m²
4724EM Wouw
€ 395.000 k.k.
€ 2.883/m²
4724DN Wouw
€ 569.000 k.k.
€ 3.010/m²
4724CL Wouw
€ 355.000 k.k.
€ 2.909/m²
4724AD Wouw
€ 375.000 k.k.
€ 4.464/m²
4724CW Wouw
€ 635.000 k.k.
€ 3.239/m²
4724DL Wouw
€ 370.000 k.k.
€ 2.661/m²
4724AN Wouw
€ 339.000 k.k.
€ 3.852/m²
4724AE Wouw
€ 625.000 k.k.
€ 4.084/m²
4724BB Wouw
€ 275.000 k.k.
€ 2.835/m²
4724AA Wouw
€ 274.500 k.k.
€ 2.326/m²
4724DA Wouw
€ 399.000 k.k.
€ 3.439/m²
4724BB Wouw
€ 299.000 k.k.
€ 3.359/m²
4724CA Wouw
€ 270.000 k.k.
€ 3.802/m²
4724AL Wouw
€ 460.000 k.k.
€ 4.070/m²
4724EX Wouw
€ 449.000 k.k.
€ 3.710/m²
4724DH Wouw
€ 749.000 k.k.
€ 3.420/m²
4724AV Wouw
Price upon request
4724EK Wouw
€ 309.500 k.k.
€ 3.004/m²
4724CC Wouw
€ 565.000 k.k.
€ 3.598/m²
4724AC Wouw
€ 325.000
€ 4.643/m²
4724DC Wouw
€ 355.000 k.k.
€ 2.933/m²
4724CS Wouw
€ 200.000 k.k.
€ 3.508/m²
Bekijk recente verkopen en ontvang gratis offertes van lokale verkoopmakelaars in Wouw.
Zelf je woning verkopen in Wouw? Vergelijk verkoopmakelaars in Wouw of bekijk de beste verkoopmakelaars in Wouw als referentie bij jouw keuze.
Makelaars maken scherpere voorstellen als ze weten dat je vergelijkt — vraag offertes aan voor verkoop of aankoop.
Short answers about housing prices, sold homes and comparing real estate agents in Wouw.
The costs of a real estate agent in Wouw vary per office, property type and sales approach. Therefore, compare multiple quotes and also look at the real estate agents in Wouw to better compare rates, presentation and local experience.
On this page we currently show 38 sold houses in Wouw from our selection. This helps you to better assess recent transactions and the local housing market.
Houses sold in Wouw give insight into asking prices, house types and neighborhoods where recent transactions have taken place. Compare this also with the current housing stock in Wouw to better understand the market.
You can use sold homes as a first market indication, but a local real estate agent can better take into account finishing, location, maintenance and current demand in Wouw.
Vergelijk makelaars in Wouw op lokale verkoopervaring, reviews, verwachte opbrengst, courtage en marketingaanpak. Bekijk verkoopmakelaars in Wouw of de top 10 makelaars in Wouw om snel sterke kantoren te ontdekken.
View current location data on residents, WOZ development, housing stock, energy consumption, business activity and safety in Wouw. In 2025 were there 4.850 residents. The average WOZ value in 2025 is EUR 391.000.
These figures help to better assess and compare the housing stock in Wouw with recent sold homes. Orient yourself then on suitable top real estate agents in Wouw for sales advice in this region.
Residents
4.850
Last year: 2025
Average WOZ
EUR 391.000
Last year: 2025
Average income per person.
EUR 35.300
Source: AllNumbers
Crimes (current year)
135
Total registered
| Year | Residents |
|---|---|
| 2021 | 4.795 |
| 2022 | 4.830 |
| 2023 | 4.830 |
| 2024 | 4.850 |
| 2025 | 4.850 |
| Year | Average WOZ |
|---|---|
| 2021 | EUR 292.000 |
| 2022 | EUR 310.000 |
| 2023 | EUR 350.000 |
| 2024 | EUR 367.000 |
| 2025 | EUR 391.000 |
Hoger
930
Praktisch
940
Middelbaar
1.640
Europa
340
Nederland
4.290
Buiten Europa
210
Label C
566
Label B
421
Label A
328
Label D
319
Label F
164
Label G
157
Label E
90
Label A+++
64
Label A+
33
Label A++
27
Label A++++
13
Label A+++++
0
| Year | Gas (m3) | Electricity (kWh) |
|---|---|---|
| 2020 | 1.380 | 3.240 |
| 2021 | 1.530 | 3.270 |
| 2022 | 1.170 | 3.060 |
| 2023 | 1.000 | 2.920 |
| 2024 | 950 | 3.000 |
Hoekwoning
Gas: 990 • Electricity: 2.760
Huurwoning
Gas: 730 • Electricity: 1.940
Koopwoning
Gas: 1.070 • Electricity: 3.170
Appartement
Gas: 570 • Electricity: 1.590
Tussenwoning
Gas: 840 • Electricity: 2.430
Vrijstaande woning
Gas: 1.300 • Electricity: 3.990
Twee-onder-één-kap woning
Gas: 1.120 • Electricity: 3.170
Total number of company establishments: 615
| Period | Crimes |
|---|---|
| jan 2026 | 9 |
| jul 2025 | 12 |
| jun 2025 | 9 |
| mei 2025 | 19 |
| mrt 2025 | 13 |
| mrt 2026 | 8 |
| nov 2024 | 9 |
| nov 2025 | 13 |
| okt 2024 | 10 |
| okt 2025 | 5 |
| sep 2024 | 10 |
| sep 2025 | 9 |
These figures give an indicative picture of safety trends in the living environment of Wouw.
Short answers based on current local statistics, handy for a quick comparison of the living environment.
Wouw telt in 2025 ongeveer 4.850 inwoners.
De gemiddelde WOZ-waarde in Wouw is in 2025 circa € 391.000.
Het gemiddelde inkomen per inwoner in Wouw ligt rond € 35.300 per jaar.
Voor het huidige jaar gaat het om ongeveer 135 geregistreerde misdrijven. Gebruik deze cijfers als indicatie en vergelijk trends per periode.
In Wouw komt vooral "Tussenwoningen" veel voor, met ongeveer 604 woningen.