- Available
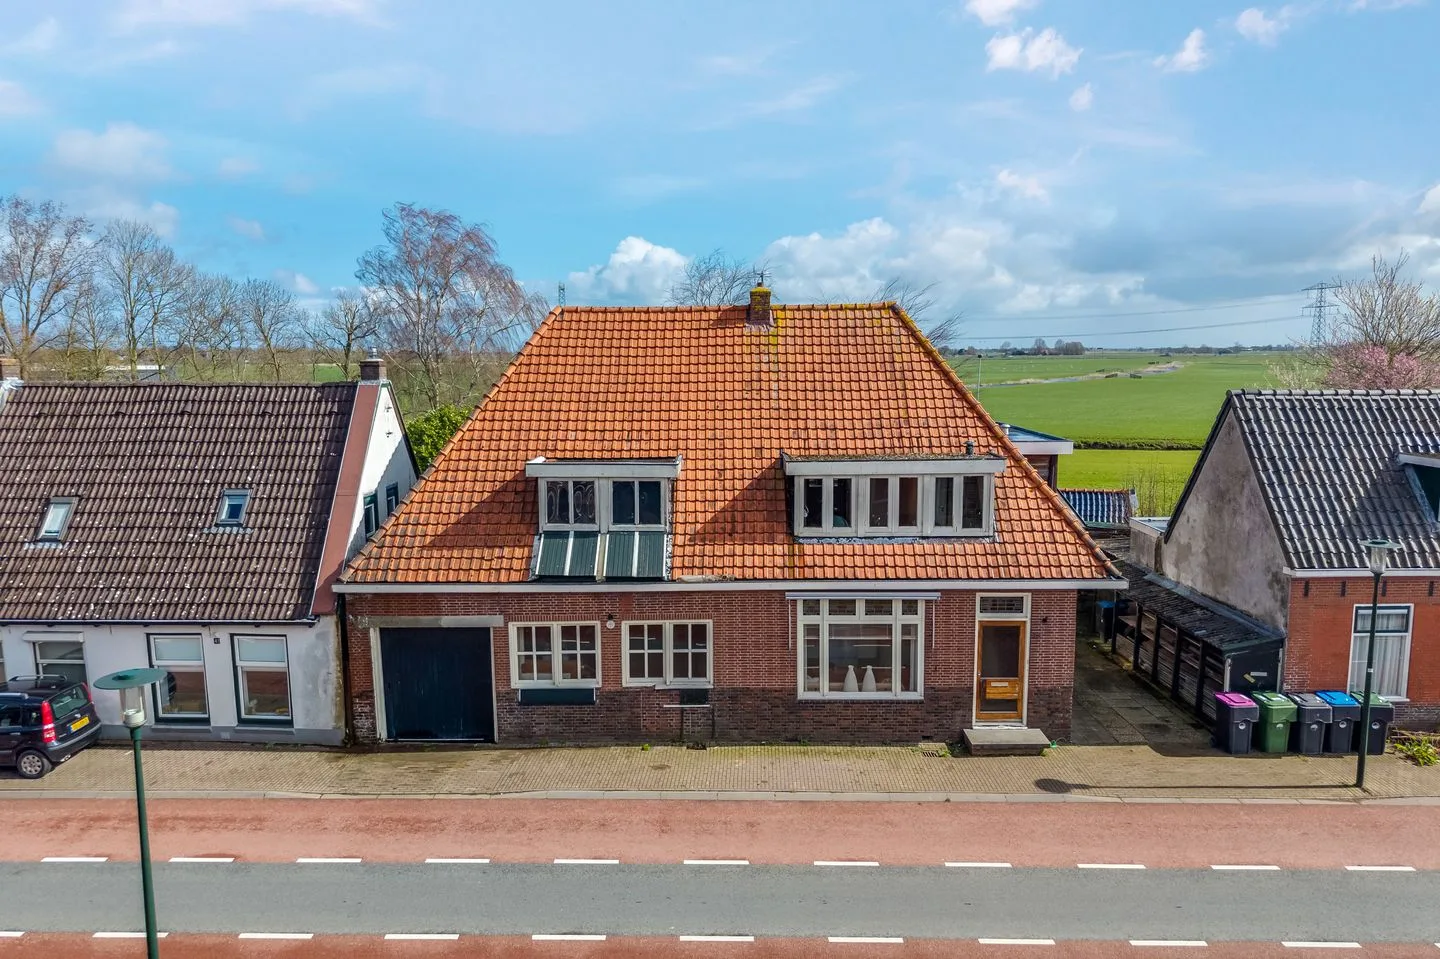
Pier Thomasstrjitte 2
9089CC Wytgaard
€ 375.000 k.k.
€ 4.121/m²
- Living area
- 91 m²
- Land area
- 224 m²
- Bedrooms
- 2
Searching in 9 houses in Wytgaard
Type to search. Use arrow down and arrow up to navigate through results and press Enter to open.
Hidden search suggestions.
View current properties in Wytgaard or search targeted on street, postal code and property characteristics.
View the current housing stock in Wytgaard and quickly filter by price, living area, rooms and more. There are currently 9 houses in this place within our selection.
9089CC Wytgaard
€ 375.000 k.k.
€ 4.121/m²
9089CA Wytgaard
€ 925.000 k.k.
€ 3.854/m²
9089BA Wytgaard
€ 950.000 k.k.
€ 2.357/m²
9089BA Wytgaard
€ 825.000 k.k.
€ 1.782/m²
9089BA Wytgaard
€ 725.000 k.k.
€ 3.194/m²
9089BJ Wytgaard
€ 425.000 k.k.
€ 4.087/m²
9089BB Wytgaard
€ 325.000 k.k.
€ 3.155/m²
9089CA Wytgaard
€ 449.500 k.k.
€ 3.057/m²
9089CA Wytgaard
€ 345.000 k.k.
€ 2.782/m²
Get free quotes from real estate agents with local market knowledge. Compare more than 42 real estate agents in Wytgaard.
Selling a home in Wytgaard? Compare all real estate agents in Wytgaard or view the top 10 real estate agents in Wytgaard for extra context for your choice.
Real estate agents make sharper offers when they know you're comparing — ask for quotes for sale or purchase.
Practical answers about housing supply, sales and comparing real estate agents in Wytgaard.
The costs of a real estate agent in Wytgaard depend on commission, setup costs, property presentation and the chosen service. Compare the 42 real estate agents in Wytgaard via the real estate agent page and request multiple quotes to compare rates and approach well.
Within our selection, we are currently showing 9 houses in Wytgaard. View also the sold houses in Wytgaard to compare the current offering with recent transactions.
Take into account not only price and living area but also maintenance, energy label, location, outdoor space and sales status. This way you compare houses in Wytgaard on more than just the asking price.
A local real estate agent knows the neighborhoods, recent transactions and demand in Wytgaard. By comparing 42 real estate agents in the region you get a better insight into prices, sales strategy and expected yield; the top 10 in Wytgaard provides a useful starting point.
Yes, when making a sales plan, a valuation in Wytgaard is wise. You gain insight into a realistic asking price and can then compare offers from real estate agents specifically.
View current location data on residents, WOZ development, housing stock, energy consumption, business activity and safety in Wytgaard. In 2026 were there 611 residents. The average WOZ value in 2025 is EUR 311.360.
These figures help to better assess and compare the housing stock in Wytgaard with recent sold homes. Orient yourself then on suitable top real estate agents in Wytgaard for sales advice in this region.
Residents
611
Last year: 2026
Average WOZ
EUR 311.360
Last year: 2025
Average income per person.
EUR 31.620
Source: AllNumbers
Crimes (current year)
6
Total registered
| Year | Residents |
|---|---|
| 2021 | 575 |
| 2022 | 590 |
| 2023 | 590 |
| 2024 | 610 |
| 2025 | 625 |
| 2026 | 611 |
| Year | Average WOZ |
|---|---|
| 2021 | EUR 229.011 |
| 2022 | EUR 251.743 |
| 2023 | EUR 271.937 |
| 2024 | EUR 293.087 |
| 2025 | EUR 311.360 |
Hoger
130
Praktisch
70
Middelbaar
160
Europa
25
Nederland
580
Buiten Europa
20
Label G
67
Label C
66
Label B
50
Label A
34
Label D
20
Label F
16
Label A+++
15
Label E
14
Label A+
2
Label A++++
2
Label A++
1
Label A+++++
0
| Year | Gas (m3) | Electricity (kWh) |
|---|---|---|
| 2020 | 1.416 | 2.804 |
| 2021 | 1.571 | 2.871 |
| 2022 | 1.180 | 2.669 |
| 2023 | 994 | 2.630 |
| 2024 | 923 | 2.756 |
Hoekwoning
Gas: 587 • Electricity: 1.627
Huurwoning
Gas: 958 • Electricity: 2.134
Koopwoning
Gas: 1.008 • Electricity: 2.799
Tussenwoning
Gas: 595 • Electricity: 1.400
Vrijstaande woning
Gas: 1.231 • Electricity: 3.067
Twee-onder-één-kap woning
Gas: 899 • Electricity: 2.704
Total number of company establishments: 75
| Period | Crimes |
|---|---|
| jan 2026 | 1 |
| jul 2025 | 0 |
| jun 2025 | 0 |
| mei 2025 | 1 |
| mrt 2025 | 1 |
| mrt 2026 | 1 |
| nov 2024 | 2 |
| nov 2025 | 0 |
| okt 2024 | 4 |
| okt 2025 | 0 |
| sep 2024 | 1 |
| sep 2025 | 0 |
These figures give an indicative picture of safety trends in the living environment of Wytgaard.
Short answers based on current local statistics, handy for a quick comparison of the living environment.
Wytgaard telt in 2026 ongeveer 611 inwoners.
De gemiddelde WOZ-waarde in Wytgaard is in 2025 circa € 311.360.
Het gemiddelde inkomen per inwoner in Wytgaard ligt rond € 31.620 per jaar.
Voor het huidige jaar gaat het om ongeveer 6 geregistreerde misdrijven. Gebruik deze cijfers als indicatie en vergelijk trends per periode.
In Wytgaard komt vooral "Vrijstaande woningen" veel voor, met ongeveer 109 woningen.