- Available
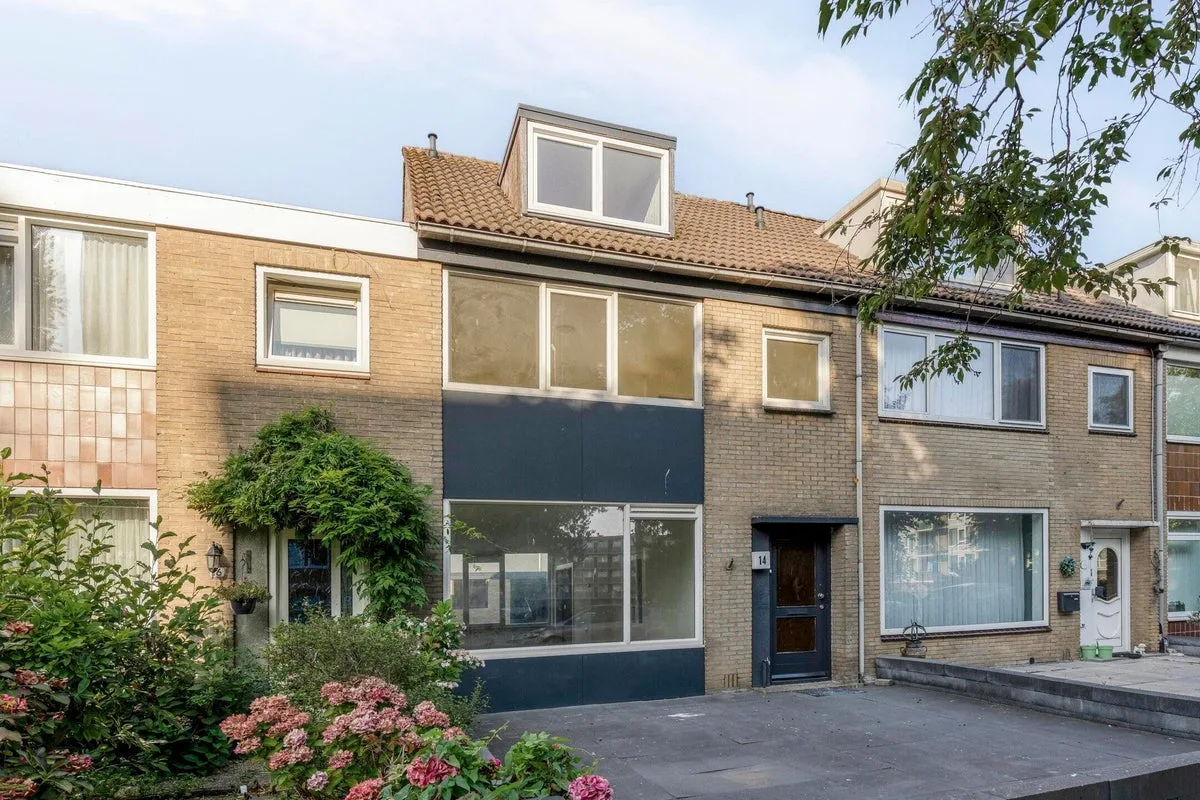
Omberstraat 24
1503NT Zaandam
€ 435.000 k.k.
€ 3.537/m²
C
Save as favorite
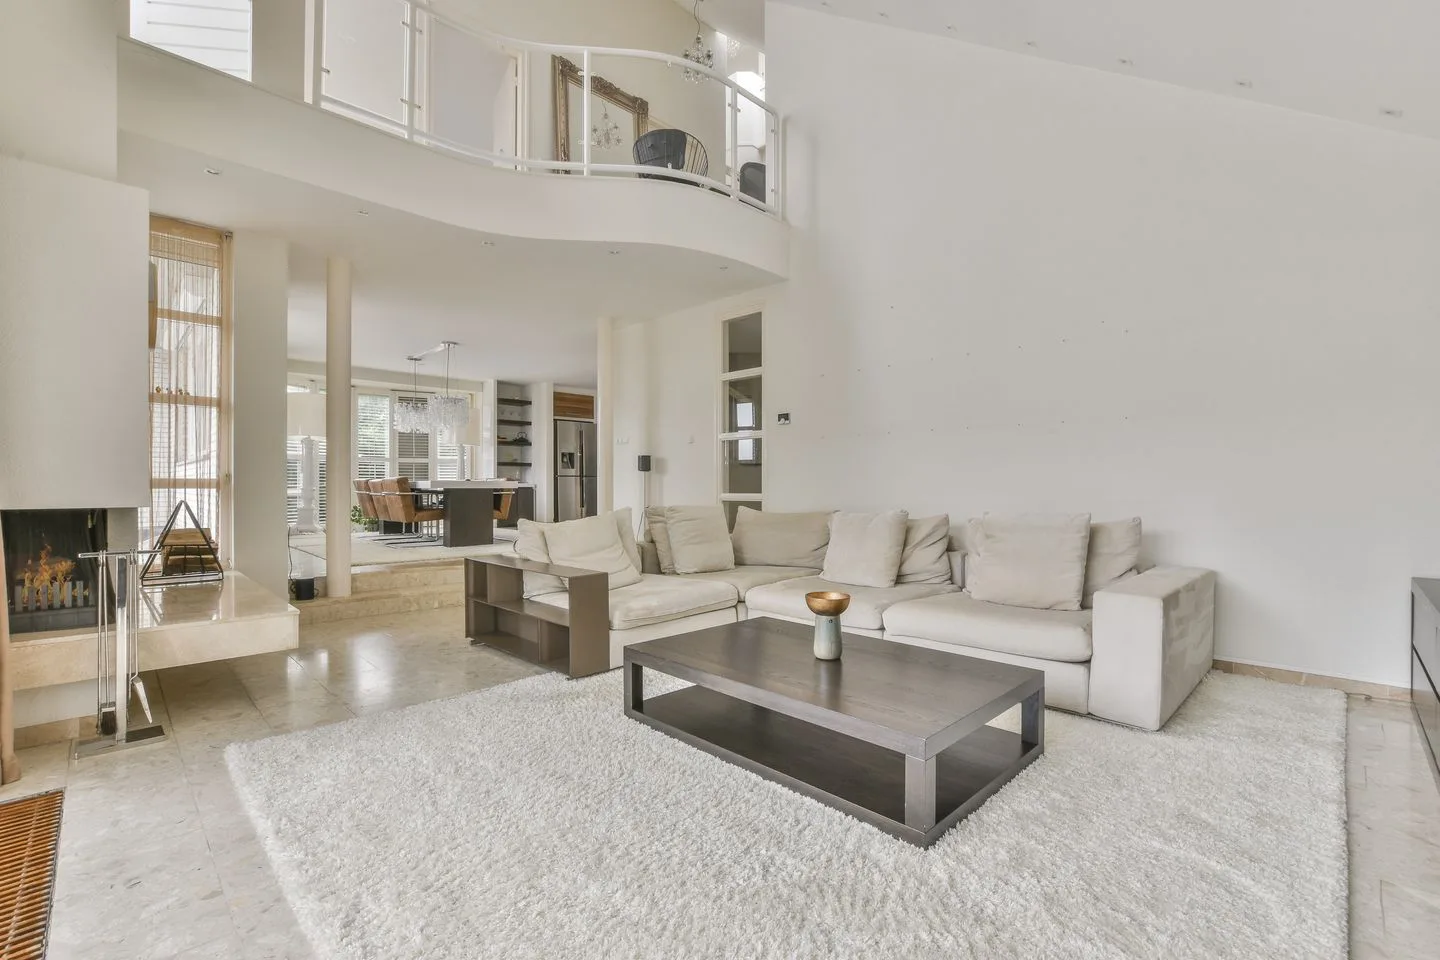
- Living area
- 123 m²
- Land area
- 142 m²
- Bedrooms
- 4