Noorderlicht Makelaars

Noorderlicht Makelaars offers reliable and personal real estate services in Drachten. We help you with confidence and professionalism in finding or selling your home. Our promise is to guide you tailor-made, from start to finish. We offer a wide range of services, including sales, purchases, appraisals, rentals and lettings. Our approach is transparent, detailed and focused on your wishes. We are accredited with certificates such as NRV...
Current housing stock
-
- Available
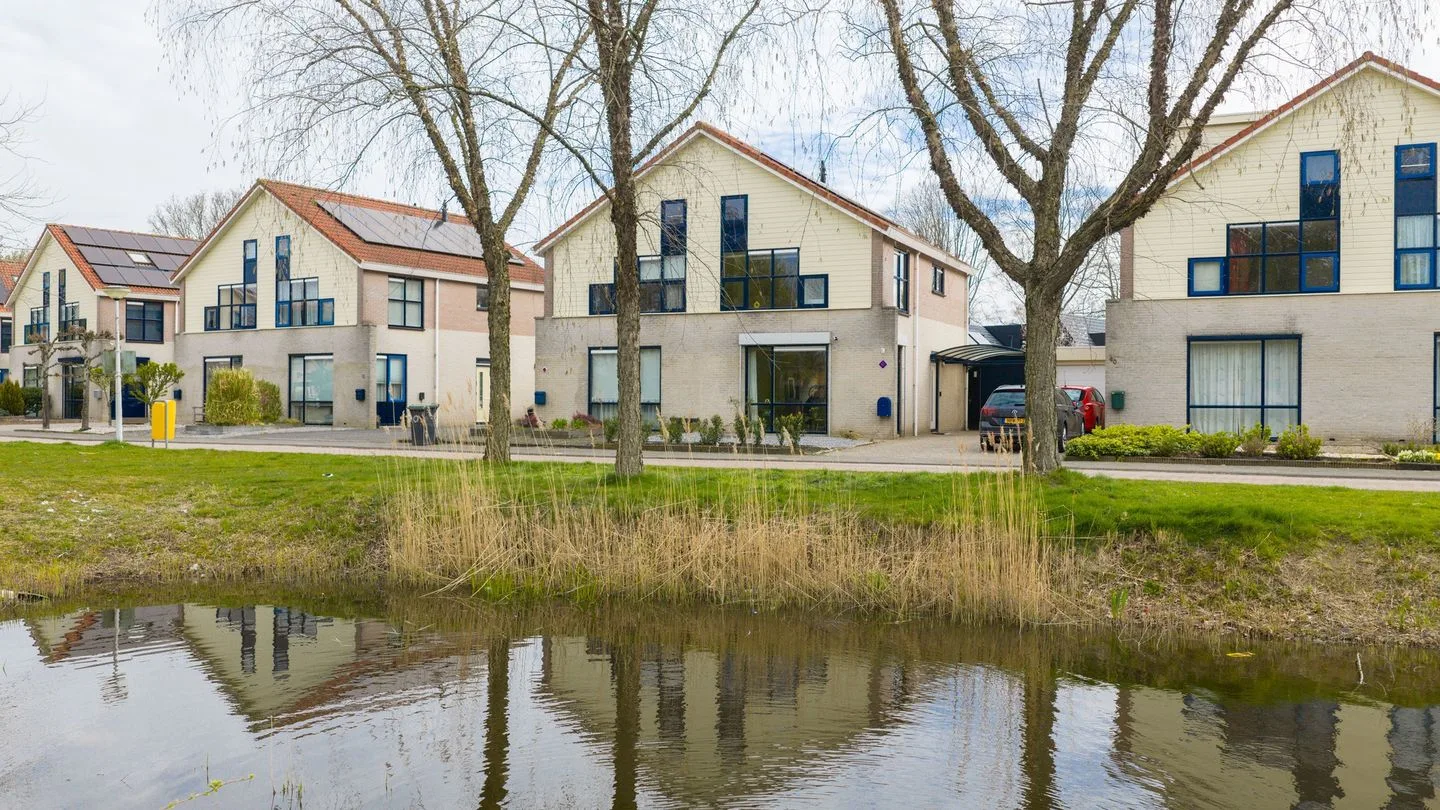
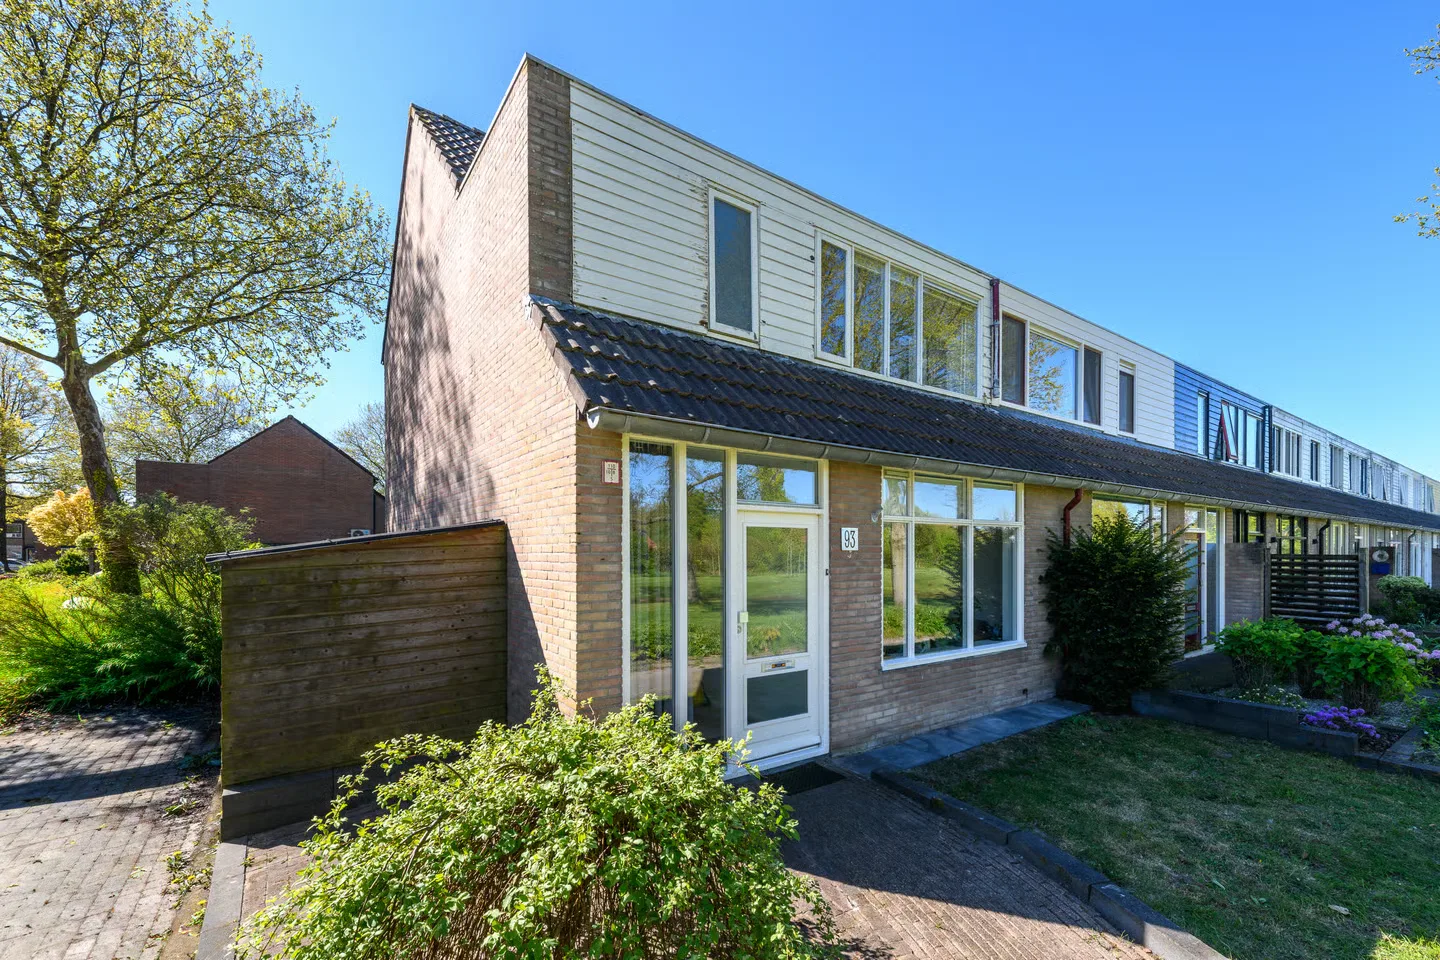
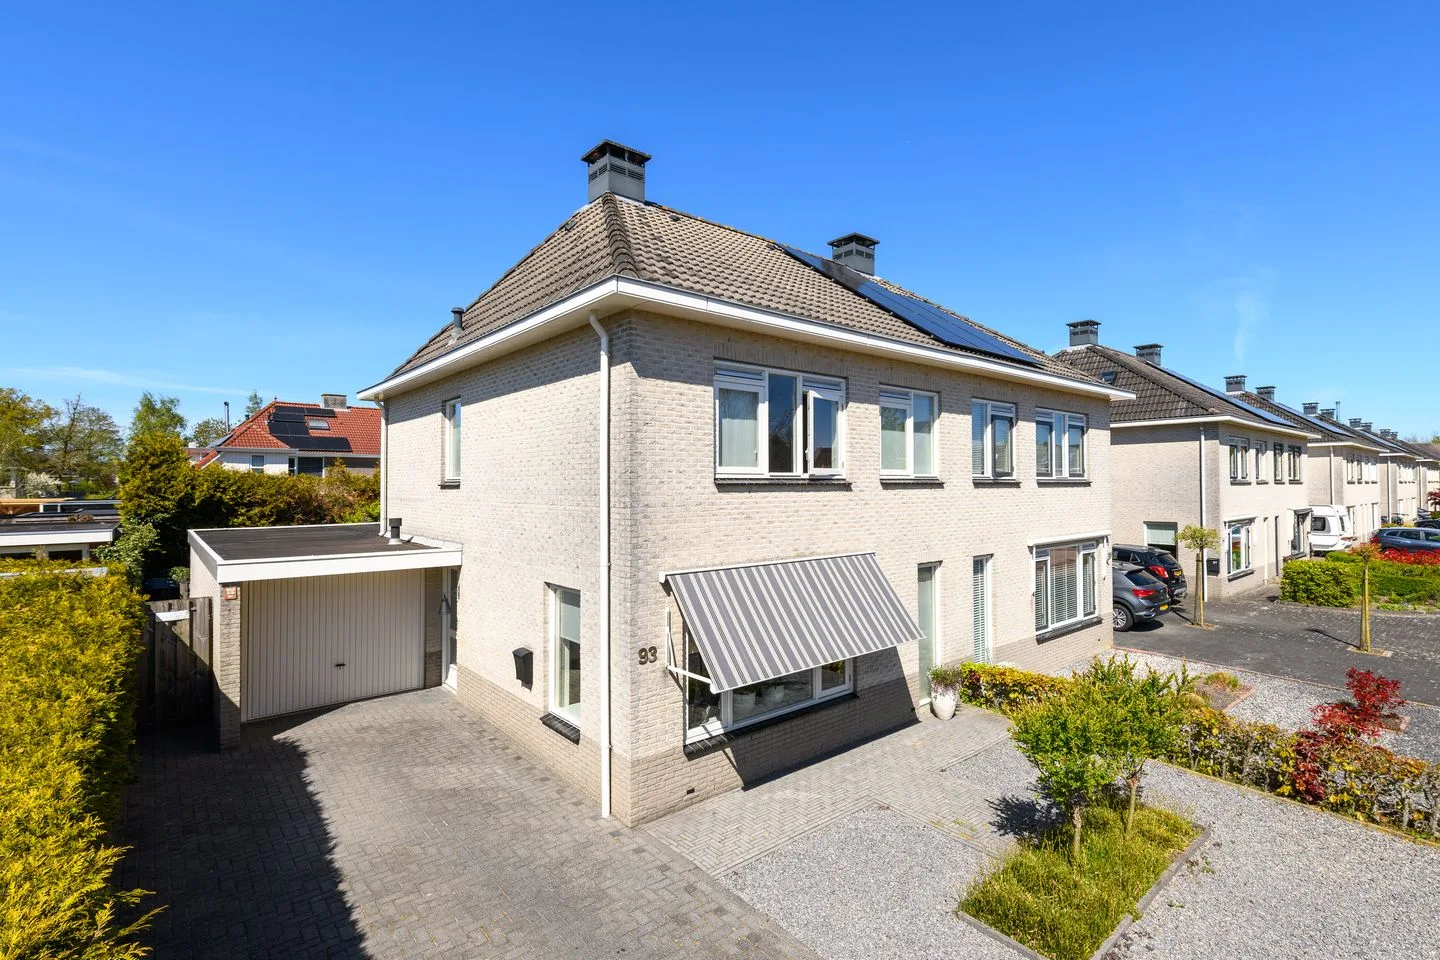
De Nova Cura 93
9207BP Drachten
€ 282.000 k.k.
CSave as favorite- Living area
- 111 m²
- Land area
- 183 m²
- Bedrooms
- 3
-
- Available
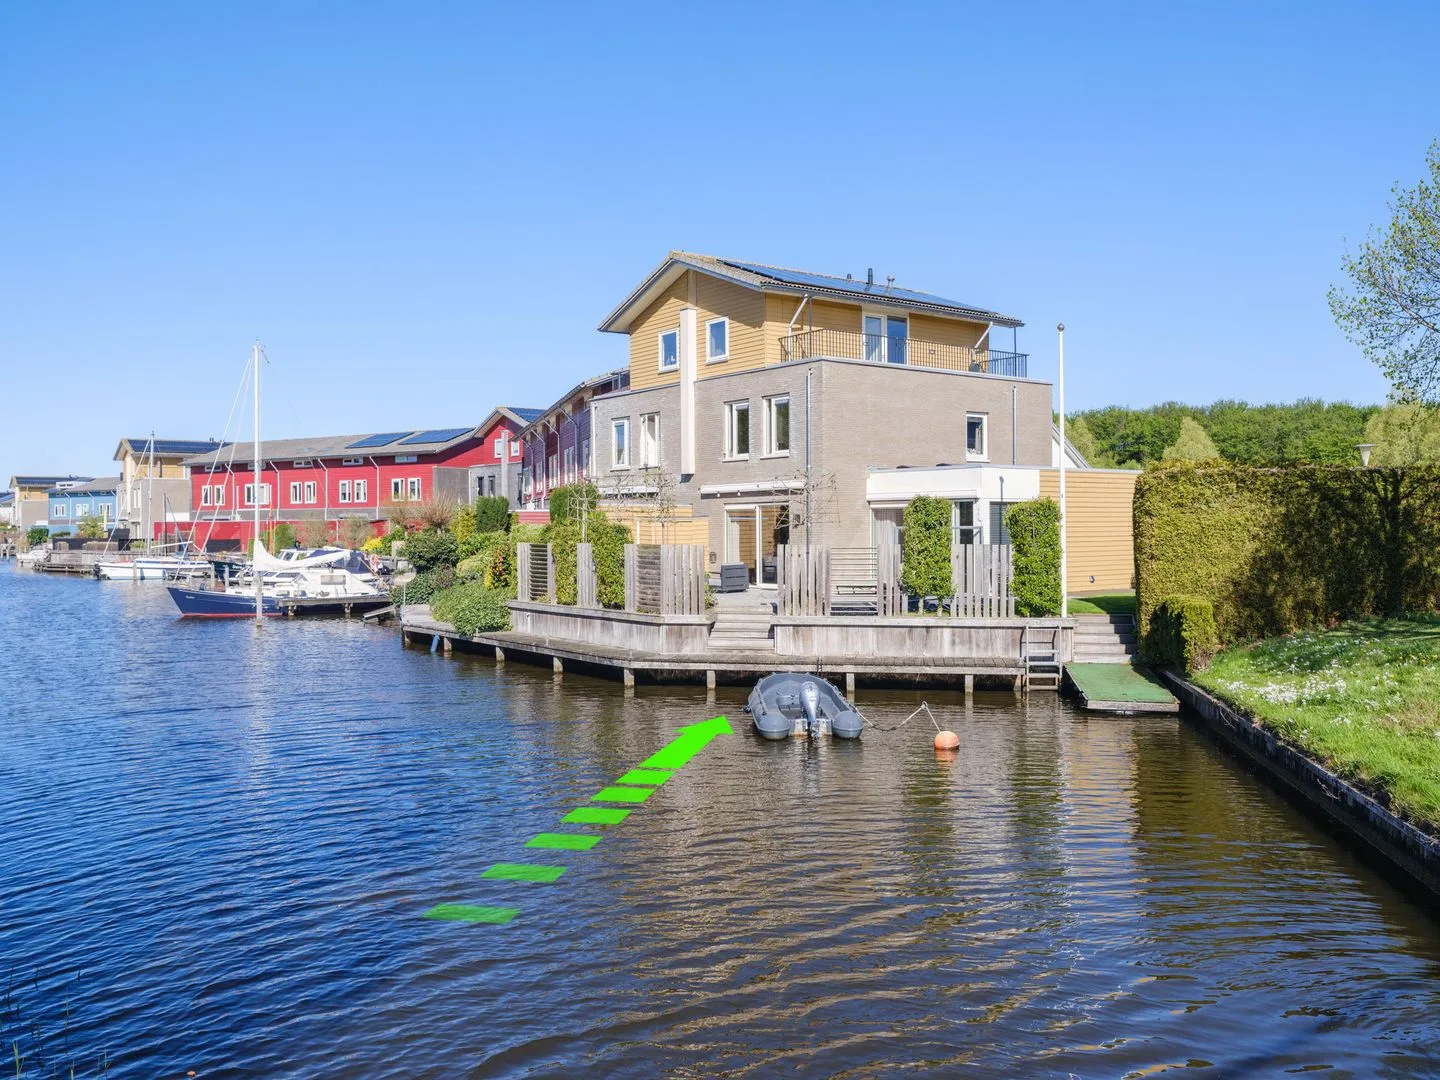
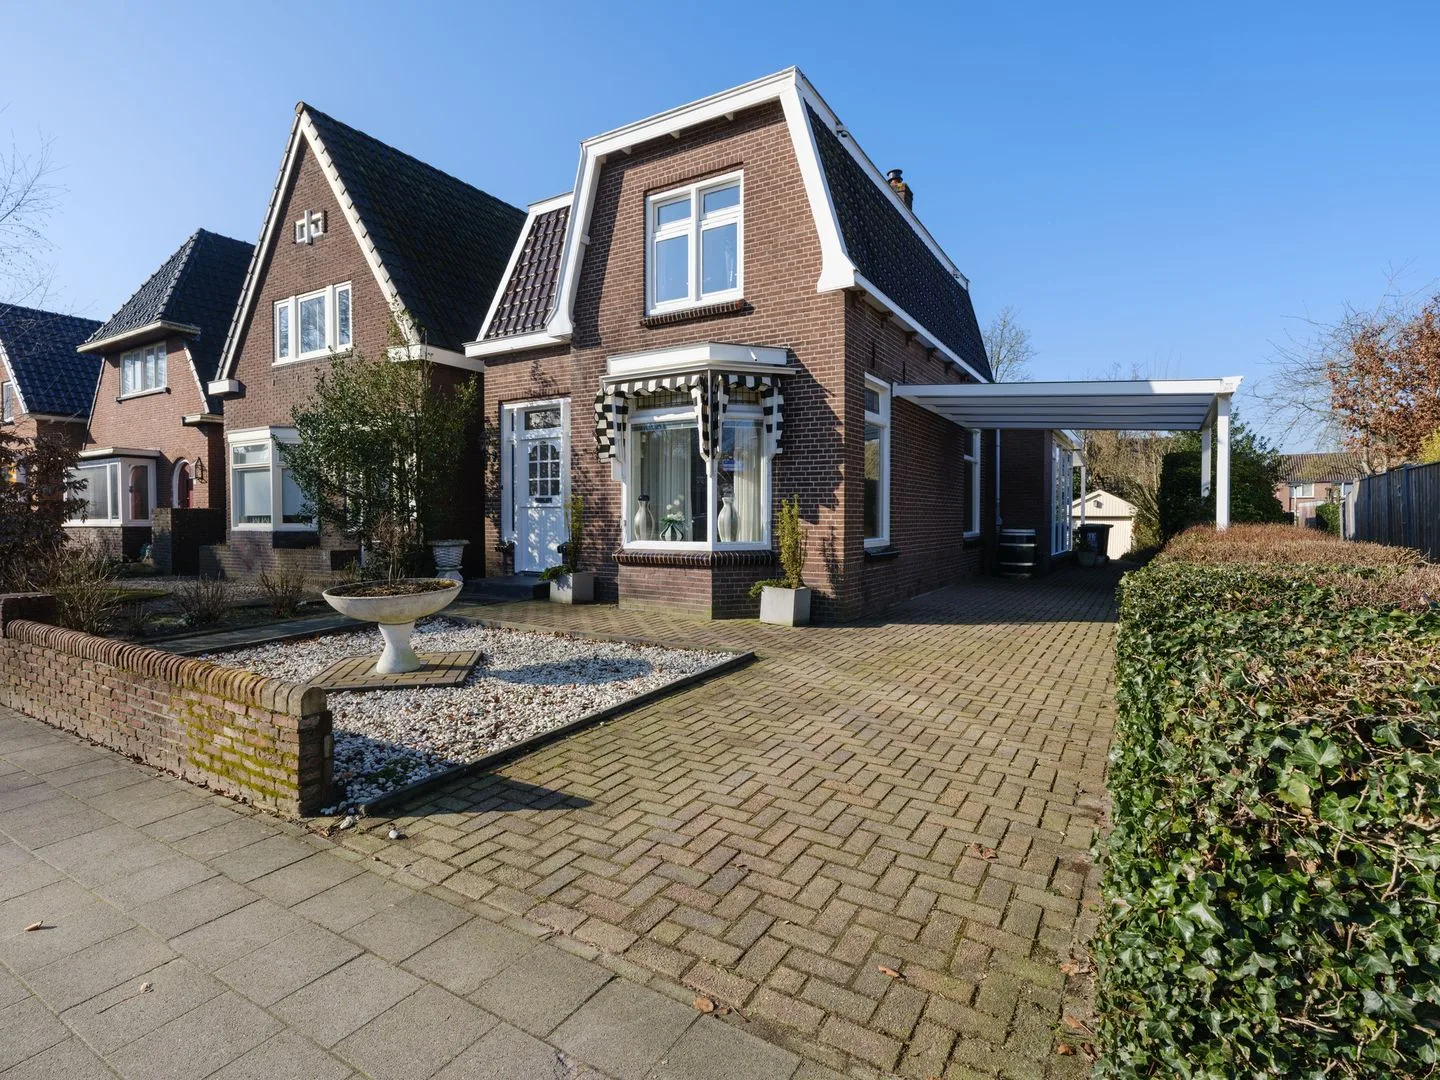
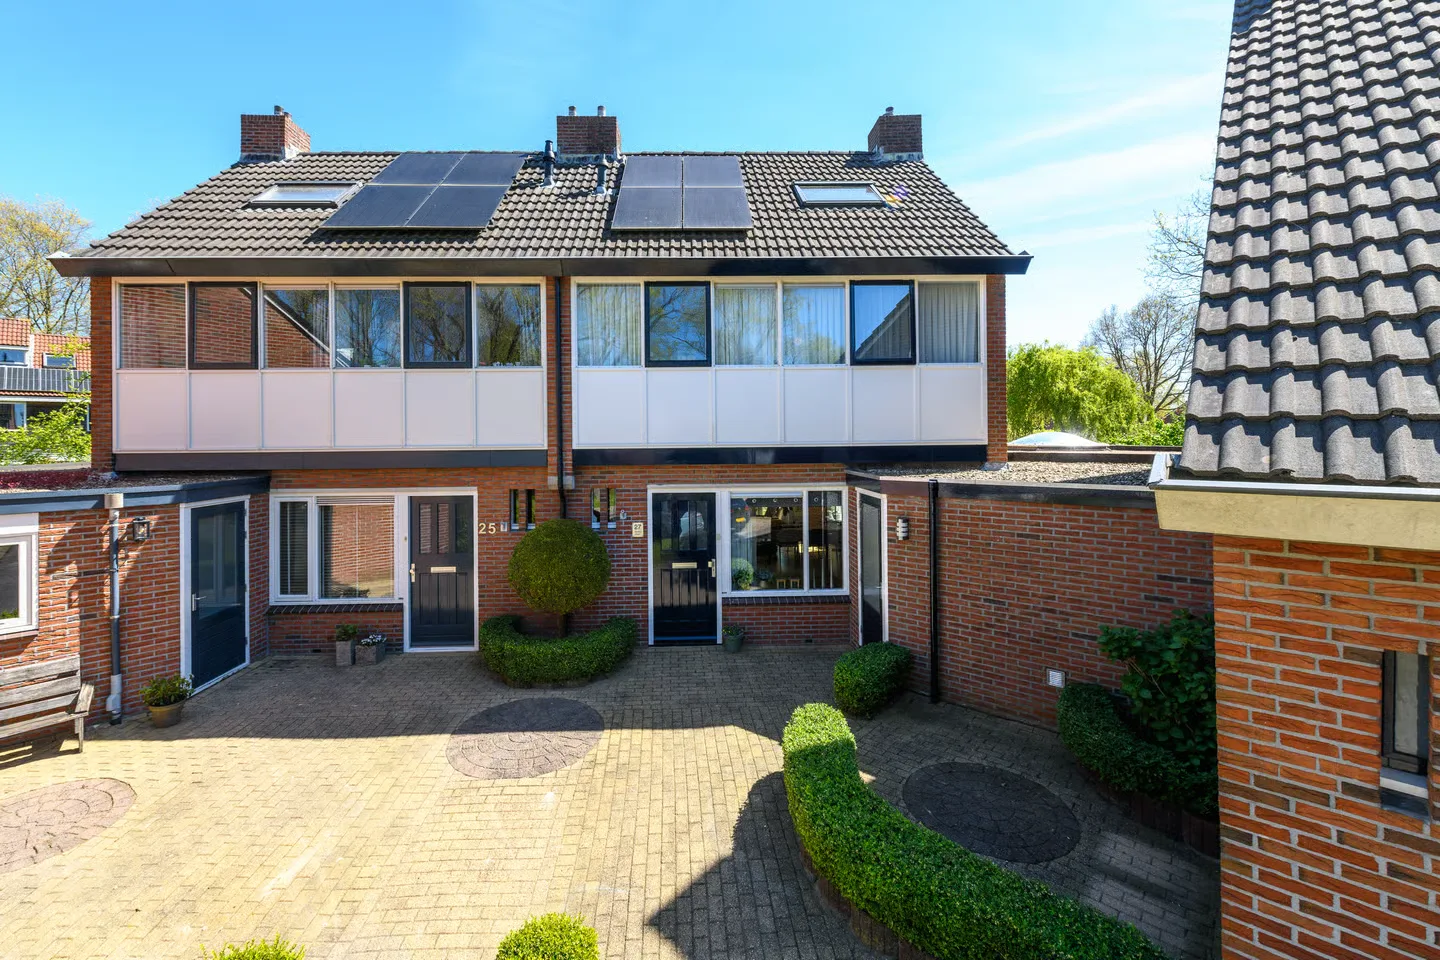
De Excelsior 27
9207DB Drachten
€ 385.000 k.k.
CSave as favorite- Living area
- 142 m²
- Land area
- 308 m²
- Bedrooms
- 4
-
- Available
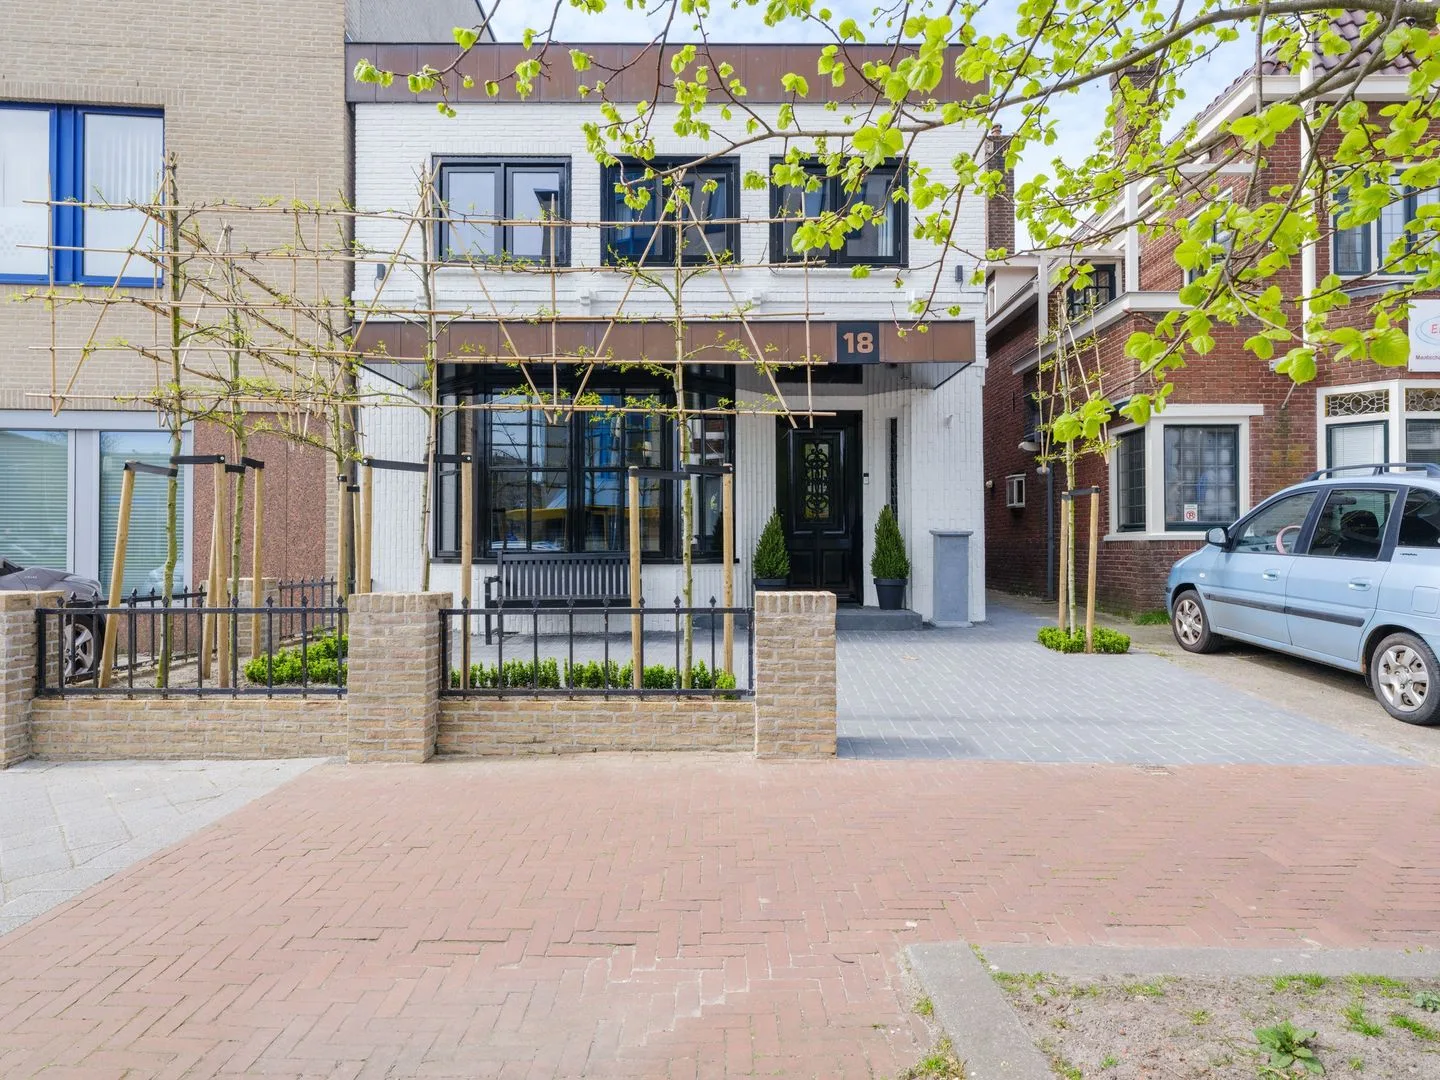
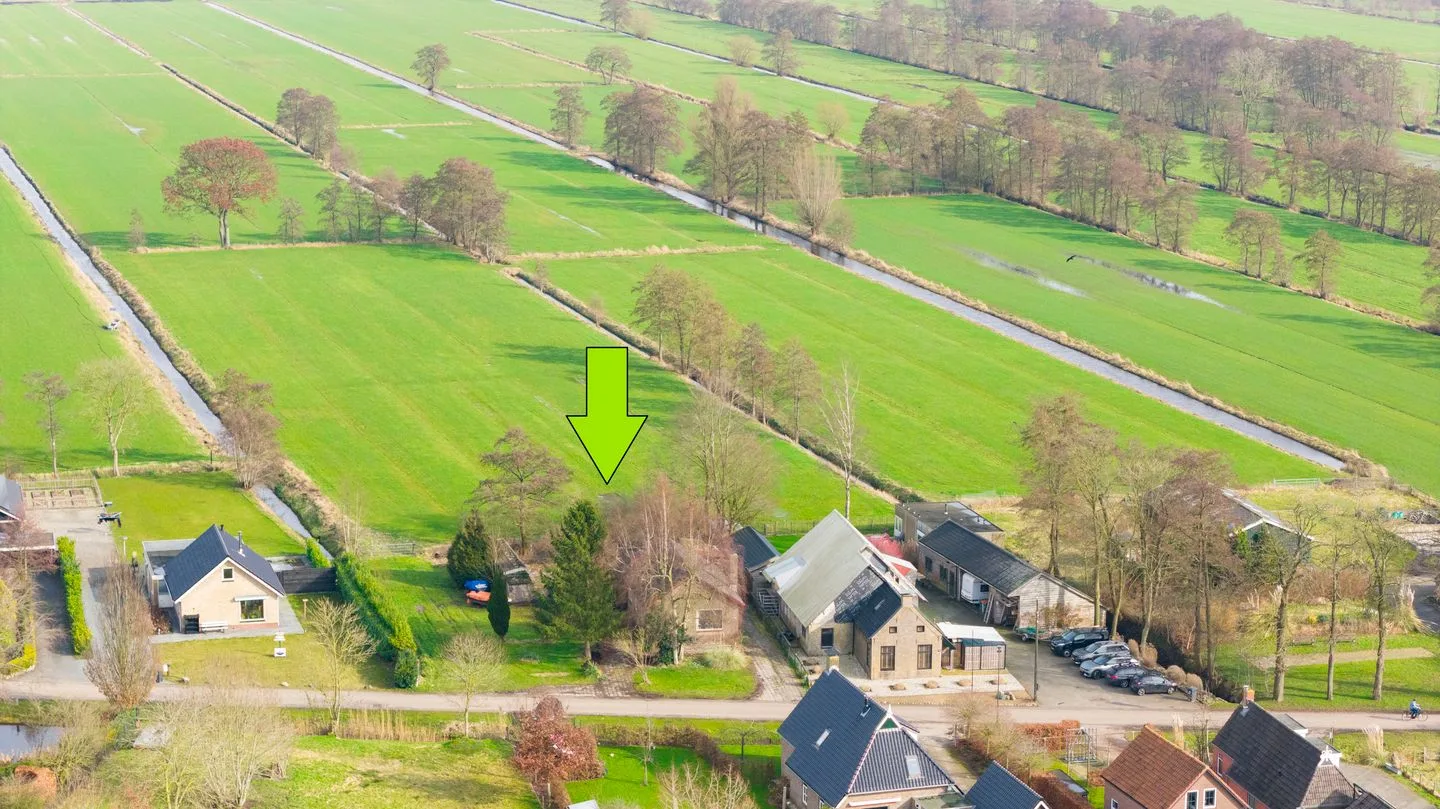
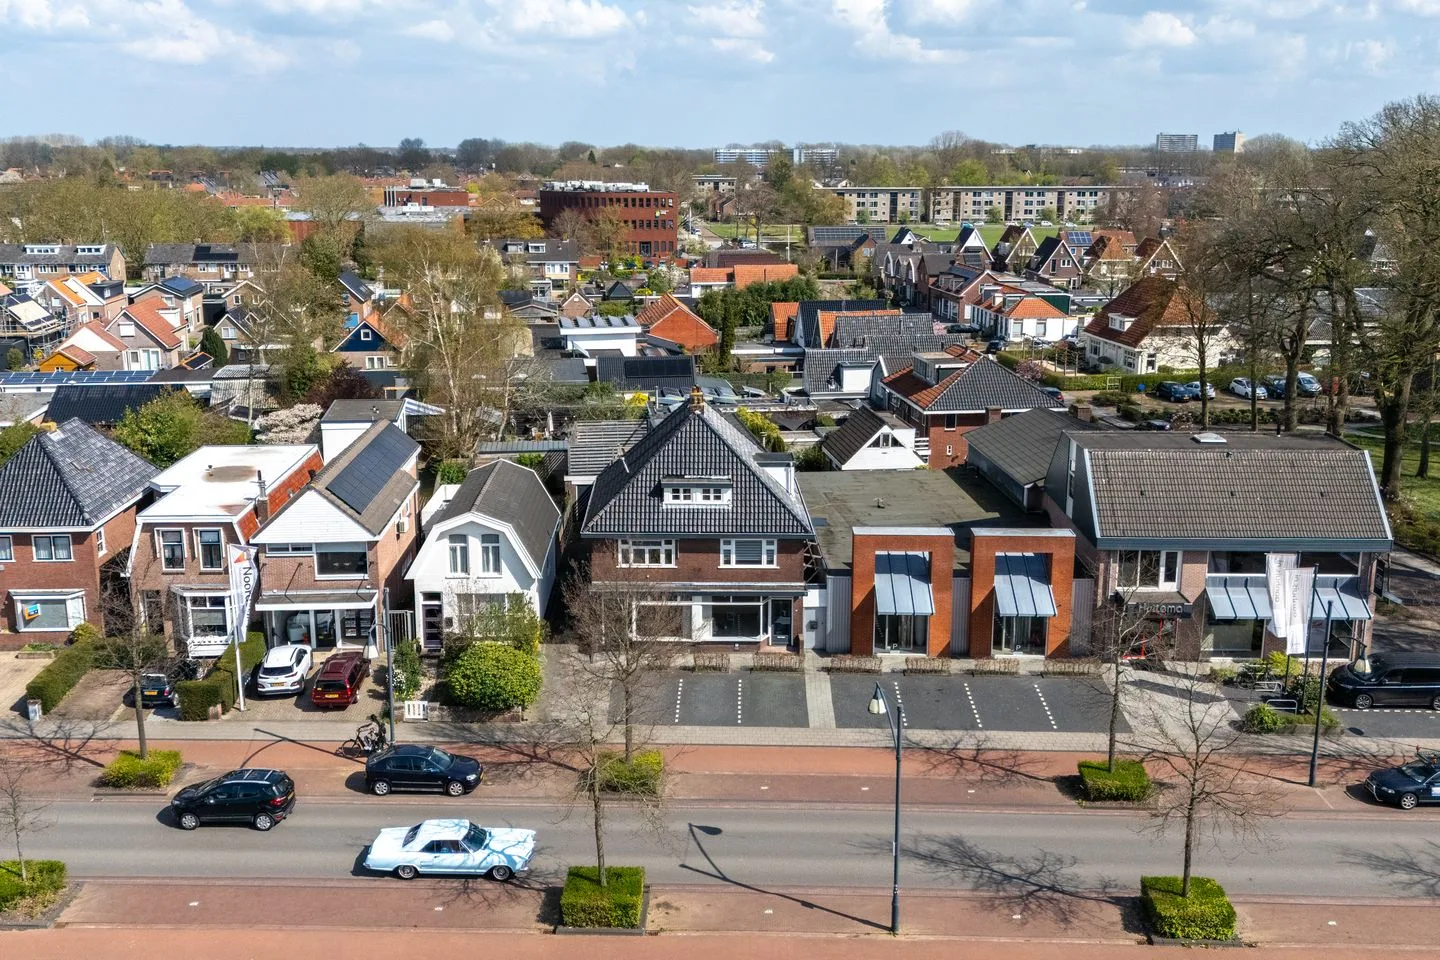
Stationsweg 78
9201GR Drachten
€ 325.000 k.k.
€ 2.600/m²
DSave as favorite- Living area
- 125 m²
- Land area
- 285 m²
- Bedrooms
- 4
-
- Available
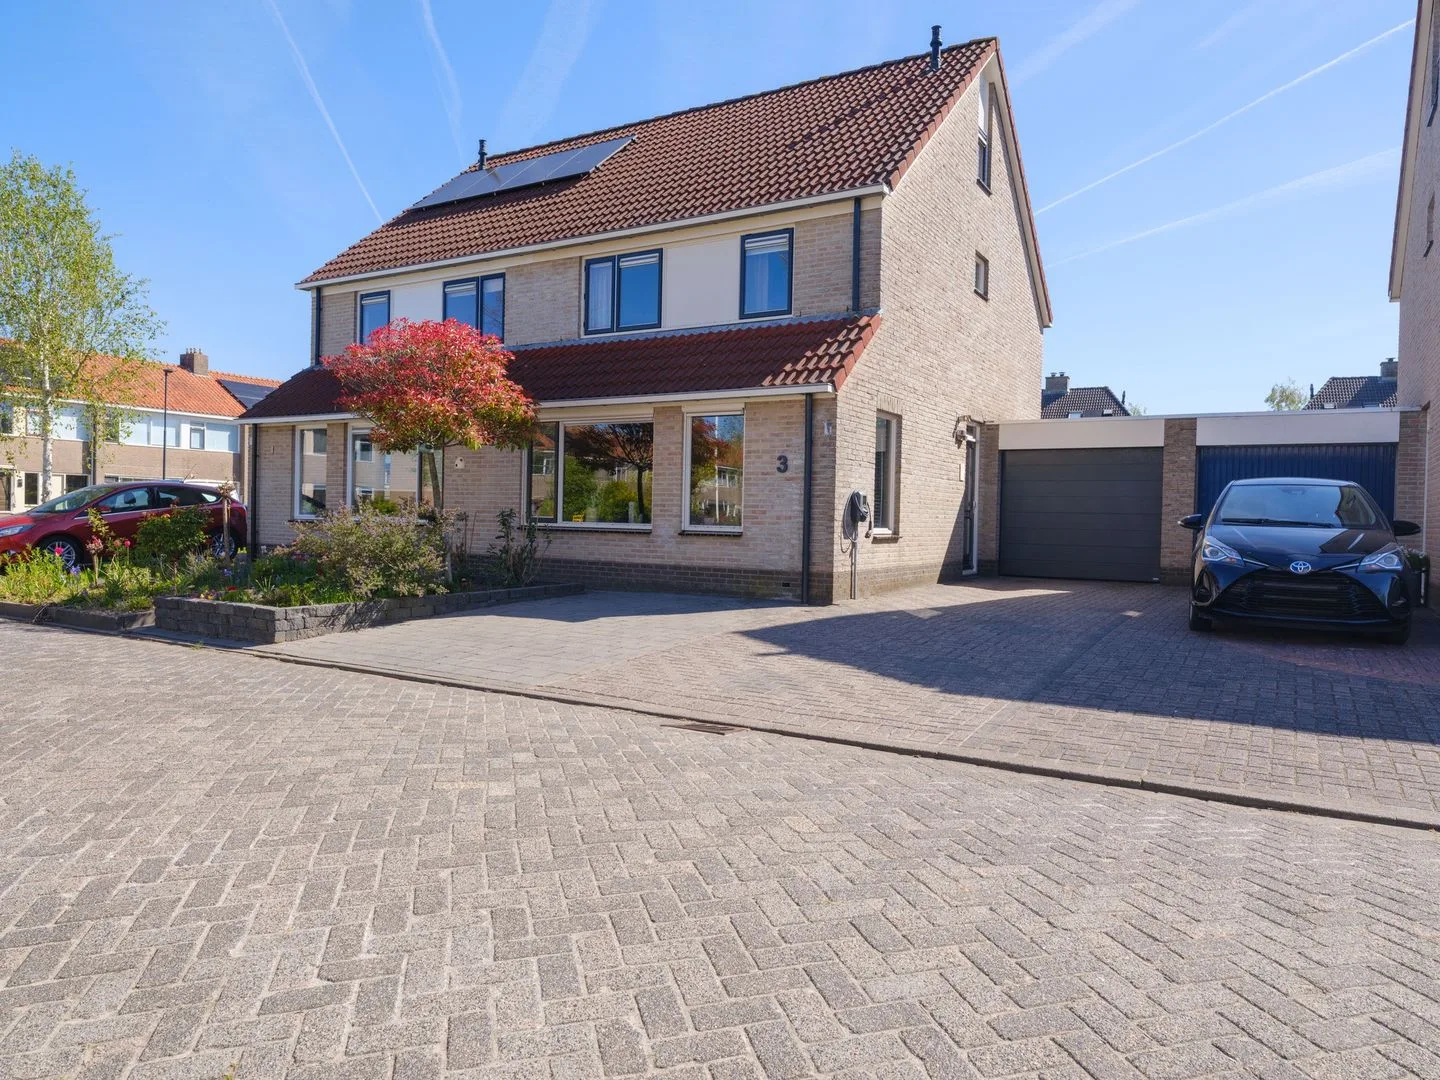
Lisdodde 93
9207AW Drachten
€ 472.500 k.k.
€ 3.351/m²
ASave as favorite- Living area
- 141 m²
- Land area
- 294 m²
- Bedrooms
- 3
-
- Available
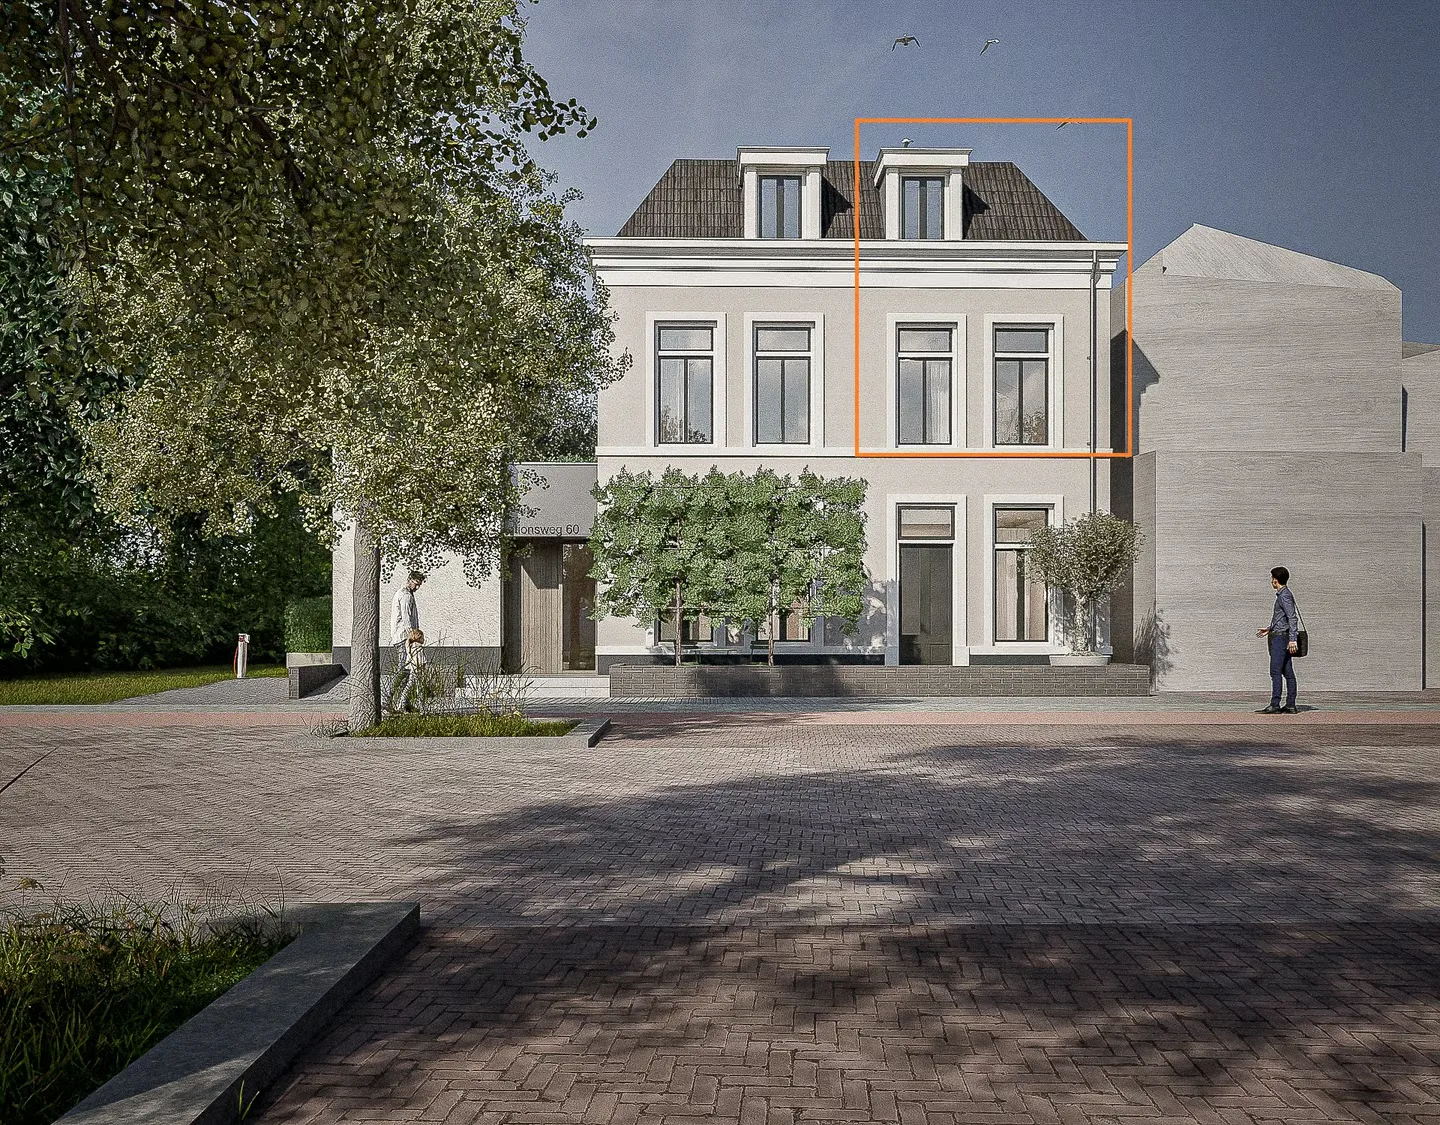
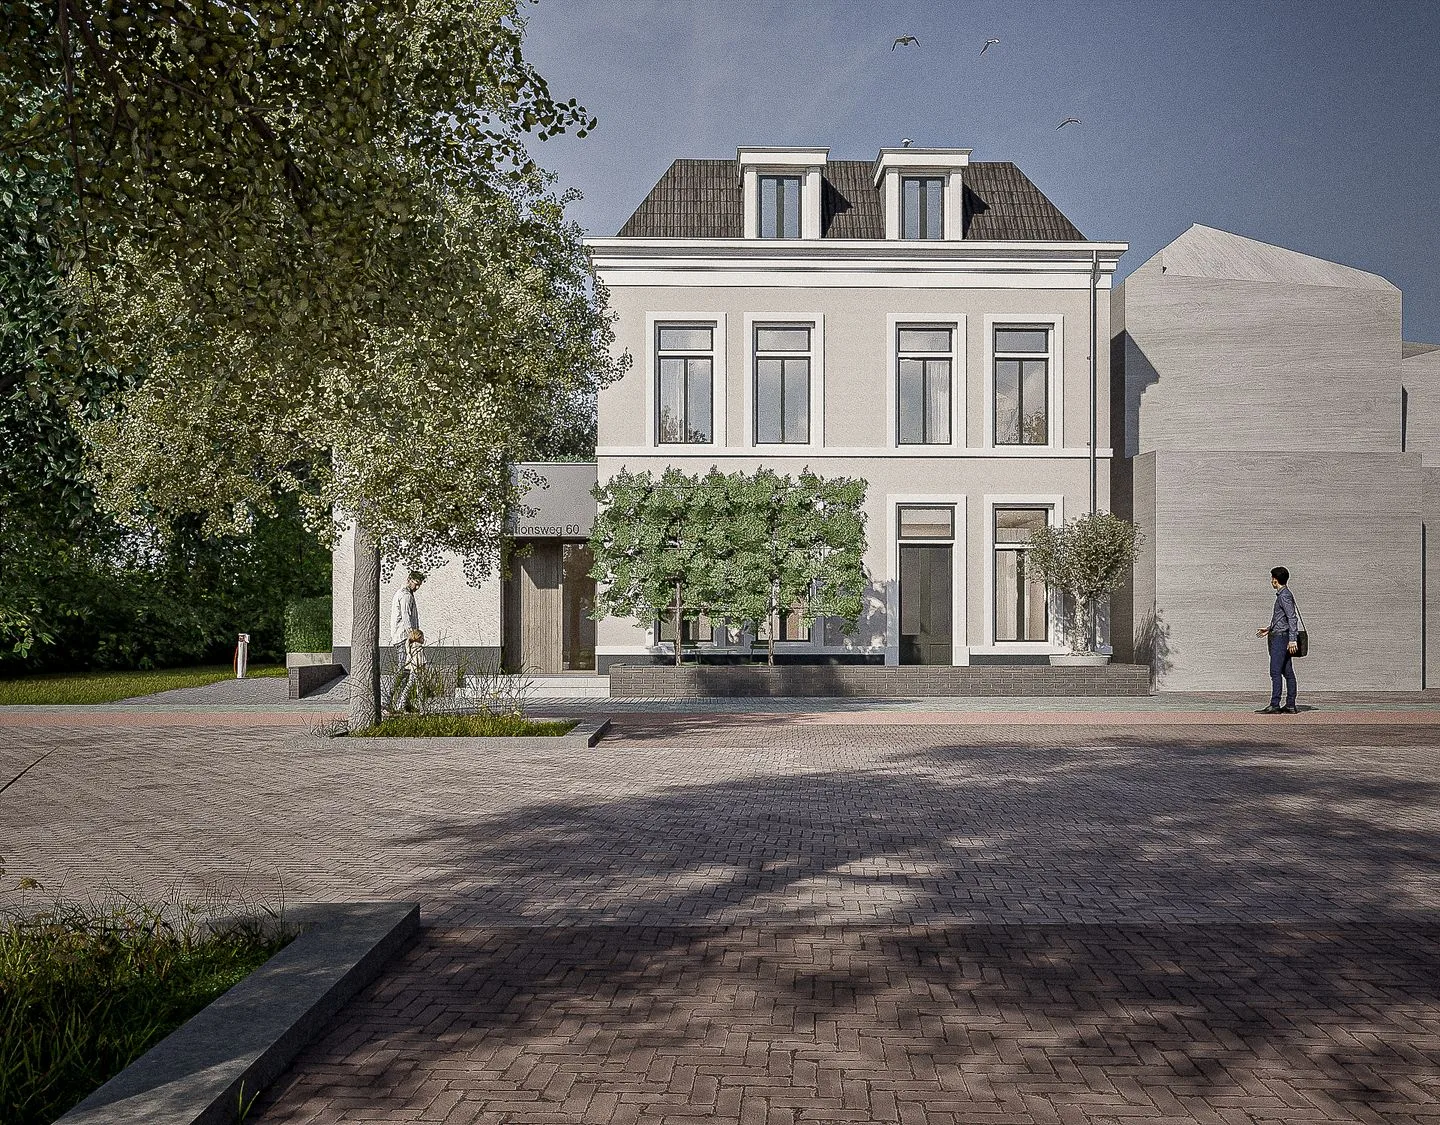
Stationsweg 60 f
9201GP Drachten
€ 345.000 k.k.
A+++Save as favorite- Living area
- 70 m²
- Land area
- —
- Bedrooms
- 2
-
- Available
Stationsweg 60 b
9201GP Drachten
€ 305.000 k.k.
A+++Save as favorite- Living area
- 63 m²
- Land area
- —
- Bedrooms
- 1
Reviews (187)
Review platforms
BronscoresTotal score
187 total reviews

Funda
85 reviews on Funda

102 reviews on Google
-
Kamgras 104
10Wij hebben een hele fijne ervaring gehad tijdens de aankoop van onze woning. Er kwamen veel nieuwe dingen op ons af, maar we kregen steeds duidelijke uitleg, eerlijk advies en snelle hulp wanneer we vragen hadden. Daardoor voelde het hele proces veel overzichtelijker en rustiger. We zijn erg blij met de begeleiding en zouden deze makelaar zeker aanraden.
-
Stelpswyk 1
10Translated by AIThe team has helped us perfectly with the purchase and sale, a certain recommendation for everyone who wants to get into the housing market.
-
Hooglandswyk 119
8Translated by AIGreat, and expert feels great where the need is. And knows how to get the best for you from the market
-
Amarens Van Breden
10Translated by AIA fine and professional team that is always ready for you. The communication was pleasant and everything was handled reliably and carefully. Thank you for the nice cooperation!
-
Yoshka Alma
10Translated by AITop communication
-
Kaylee Veenstra
10Translated by AIVery satisfied with this real estate agent! From the first contact, the communication was clear, professional and pleasant. The team takes the time, thinks actively along and is always available for questions. The knowledge of the local market is excellent and you can tell from the advice and strategy. The sales process runs smoothly and transparently, with clear explanations at each step. No empty promises, but realistic expectations and clear agreements that are also followed through. That gives confidence. A committed, expert and reliable real estate agent who I would definitely recommend to anyone looking for quality and personal service.
-
Mary Efde
10Translated by AINice contact, nice valuation of our house had.
-
Irma
10Translated by AIFriendly, Good service, helpful, pleasant experience
-
Dineke Wijbenga
10Translated by AIGood advice was received by phone from Noorderlicht Makelaars
-
Michael Koopmans
10Translated by AIThick recommender! A real estate agent with a lot of knowledge, patience & very fine communication.
-
Daphne Altenburg van Baarle
10Translated by AIVery nice help and good real estate agent.
-
Barbara Renssen
10 -
vergunningencheck
10Translated by AIWe have experienced the contact with Noorderlicht as very pleasant, especially Meins was very nice to deal with and very professional. In short, a recommendation for both purchase and sale! Martijn & Barbara Renssen
-
Marieke Dwarshuis
10Translated by AIExcellent service from start to finish. The team at Noorderlicht Makelaars is expert, involved and always easy to reach. They really think along, communicate clearly and have fully taken care of us. Definitely a recommendation!
-
Joselien Wijnsma
10Translated by AIThe viewing of the apartment was nice and I even got the option to do a second viewing. Also clear communication In short: very satisfied!
-
Johannes Muller
10Translated by AIVery pleasant reception and clear information during the viewing.
-
Paula Efdé
10Translated by AINice team! Had an informative conversation. Well helped.
-
Sjouke Bleeker
10Translated by AIVery positive about Noorderlicht Makelaars.
-
Harry Noordhof
10Translated by AIAt last, a real estate agent who takes care of you and thinks with you and protects you from mistakes, very knowledgeable, top! Takes all the time and nothing is too much, not even after 15 fruitless viewings, patiently waiting for the needle in the haystack and immediately hit.
-
dennis ramcharan
10Translated by AIReal estate agents who do more than just buy/sell. They take all the worries off your hands and think about the smallest details. Truly a recommendation.