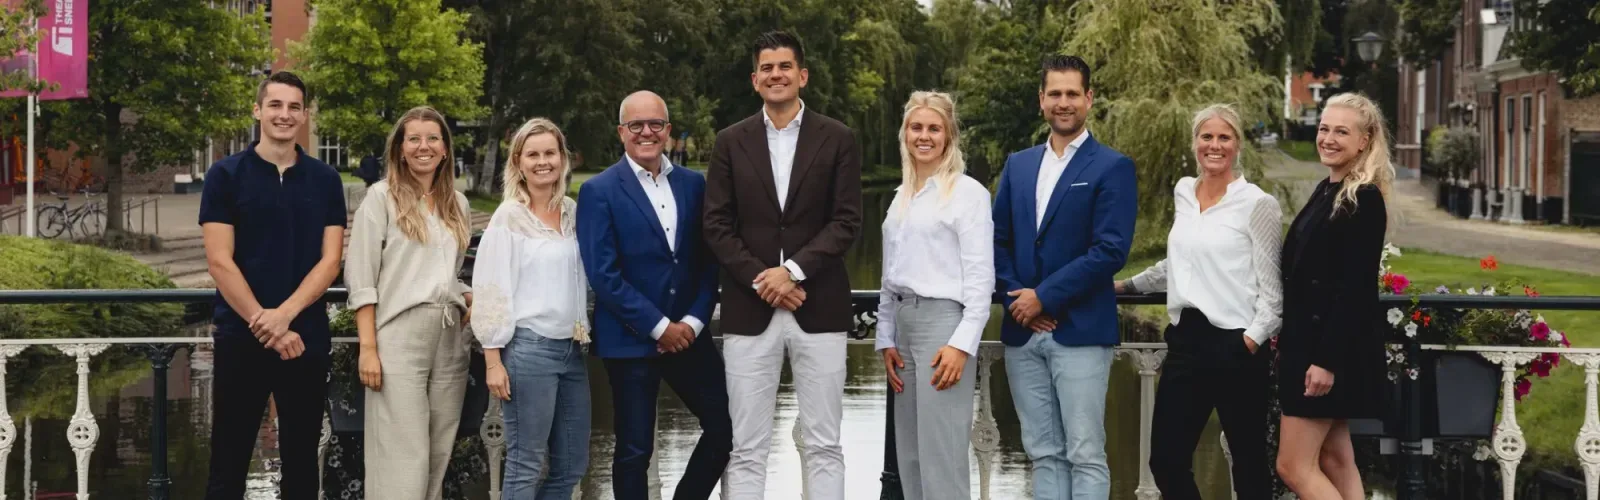
Vastgoedboutique UNYK -uw persoonlijke makelaar-
"-your personal broker-"
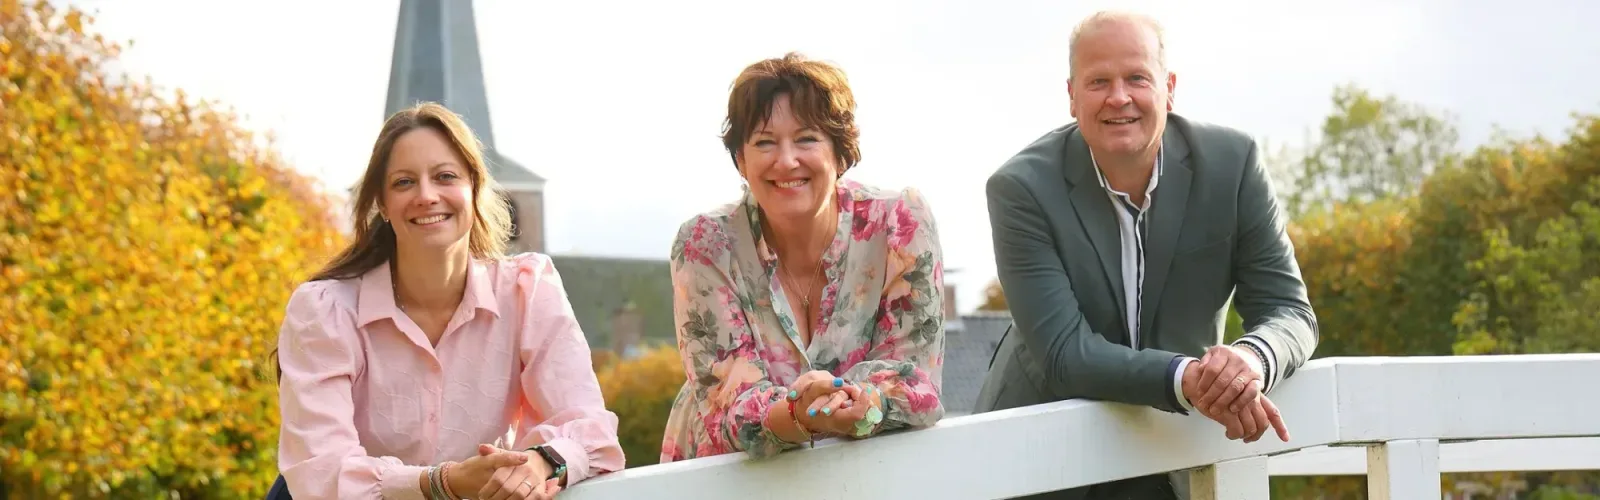
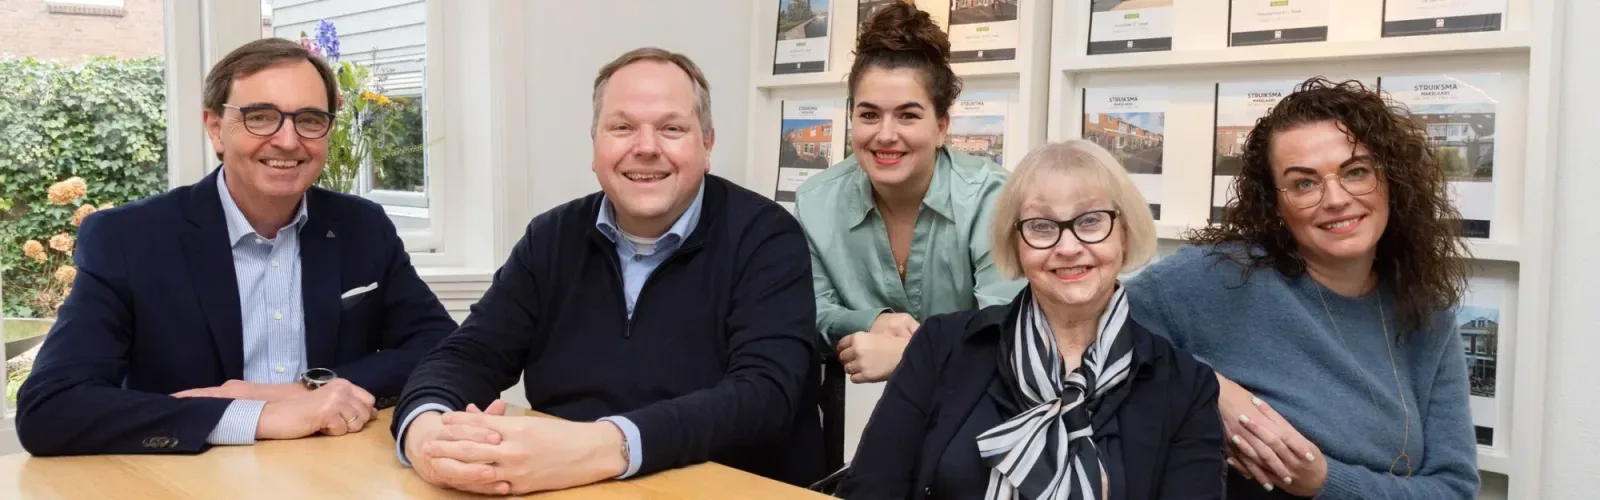
Vastgoedboutique UNYK makelaardij staat voor persoonlijk advies en gedetailleerde kennis van de regio Sneek. Wij combineren passie voor vastgoed met een klantgerichte aanpak om uw wensen te realiseren. Onze dienstverlening omvat verkoop, verhuur, aankoop en aanhuur van woningen en landbouwgrond. Wij werken met een transparante en betrouwbare werkwijze, gestaafd op onze expertise in recreatievastgoed, woningstyling en agrarisch vastgoed....
Current housing stock
-
- Available
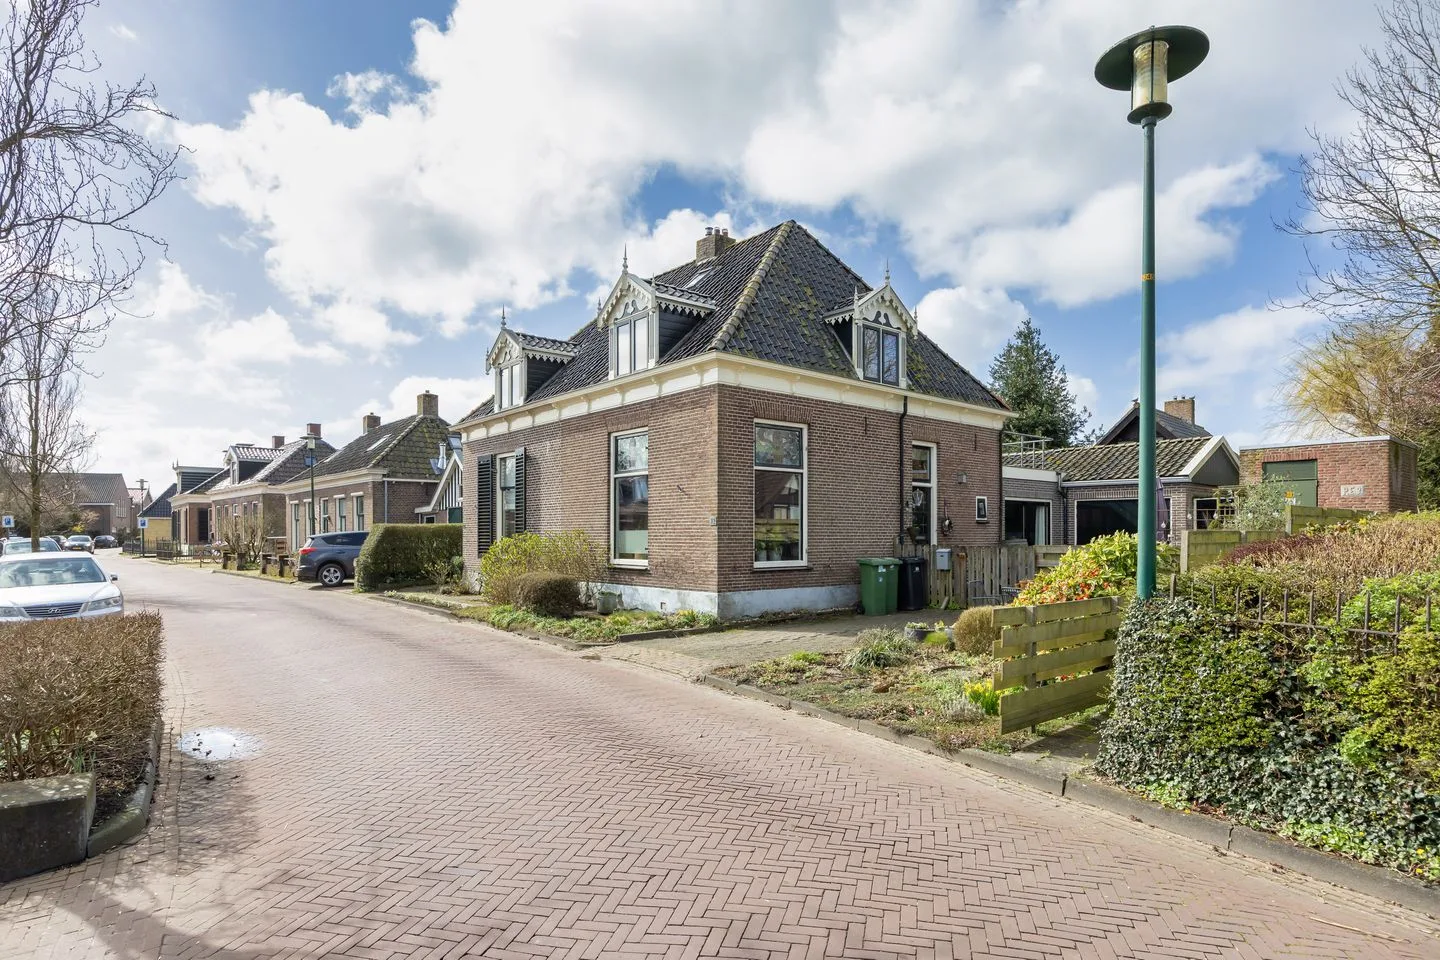
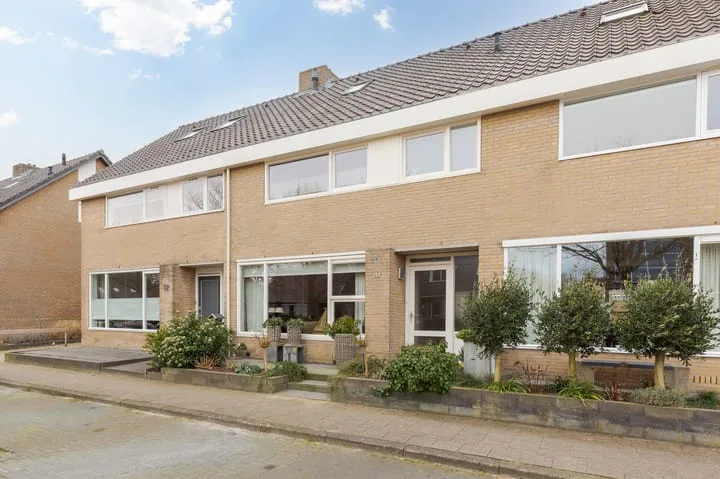
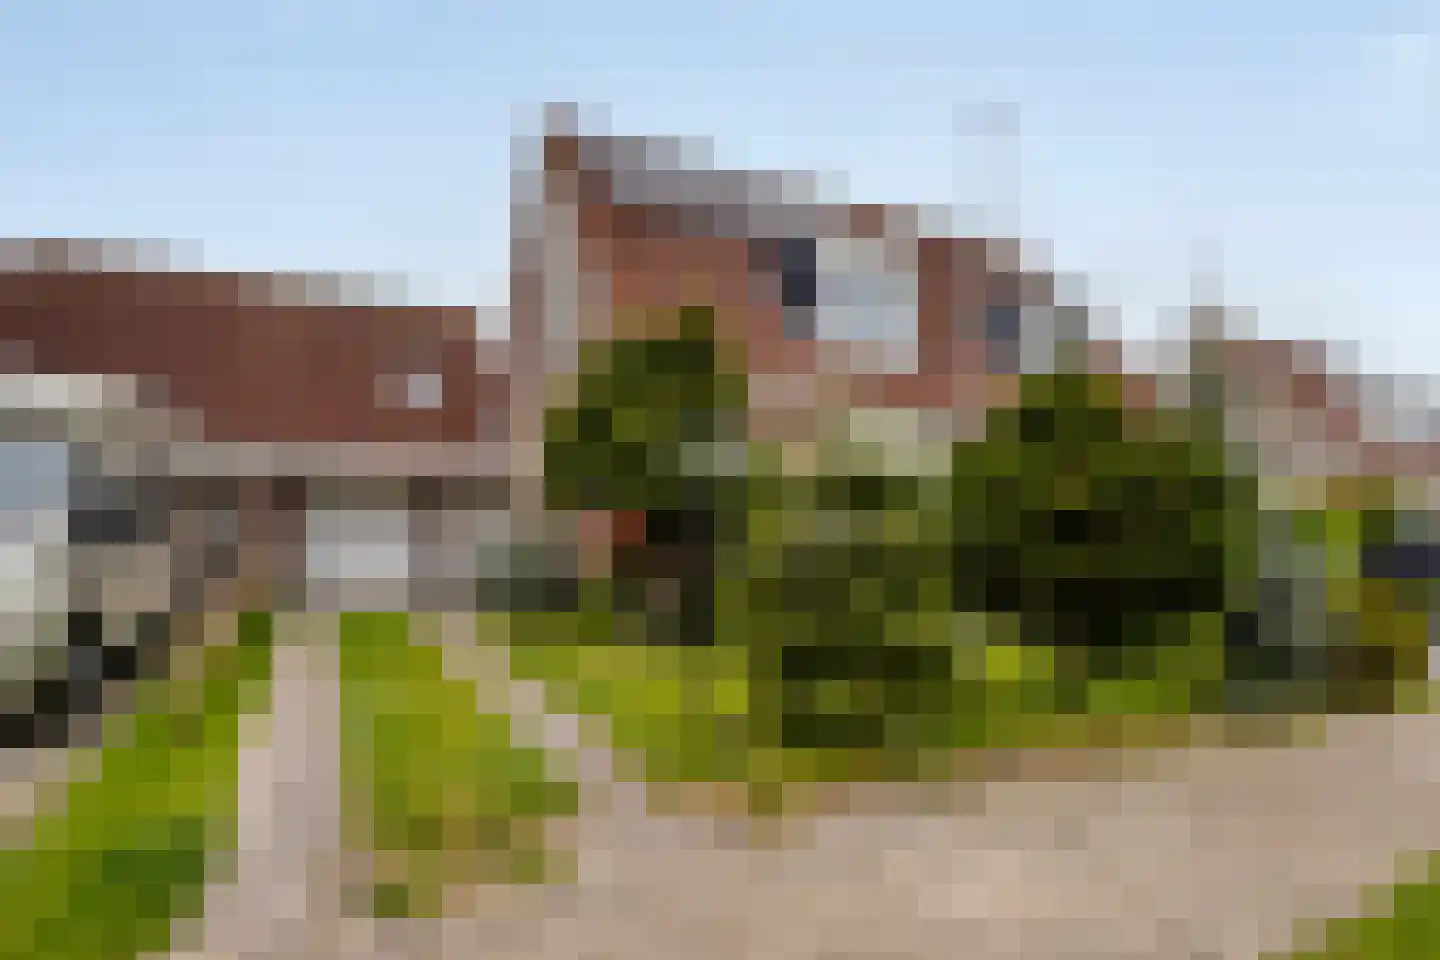
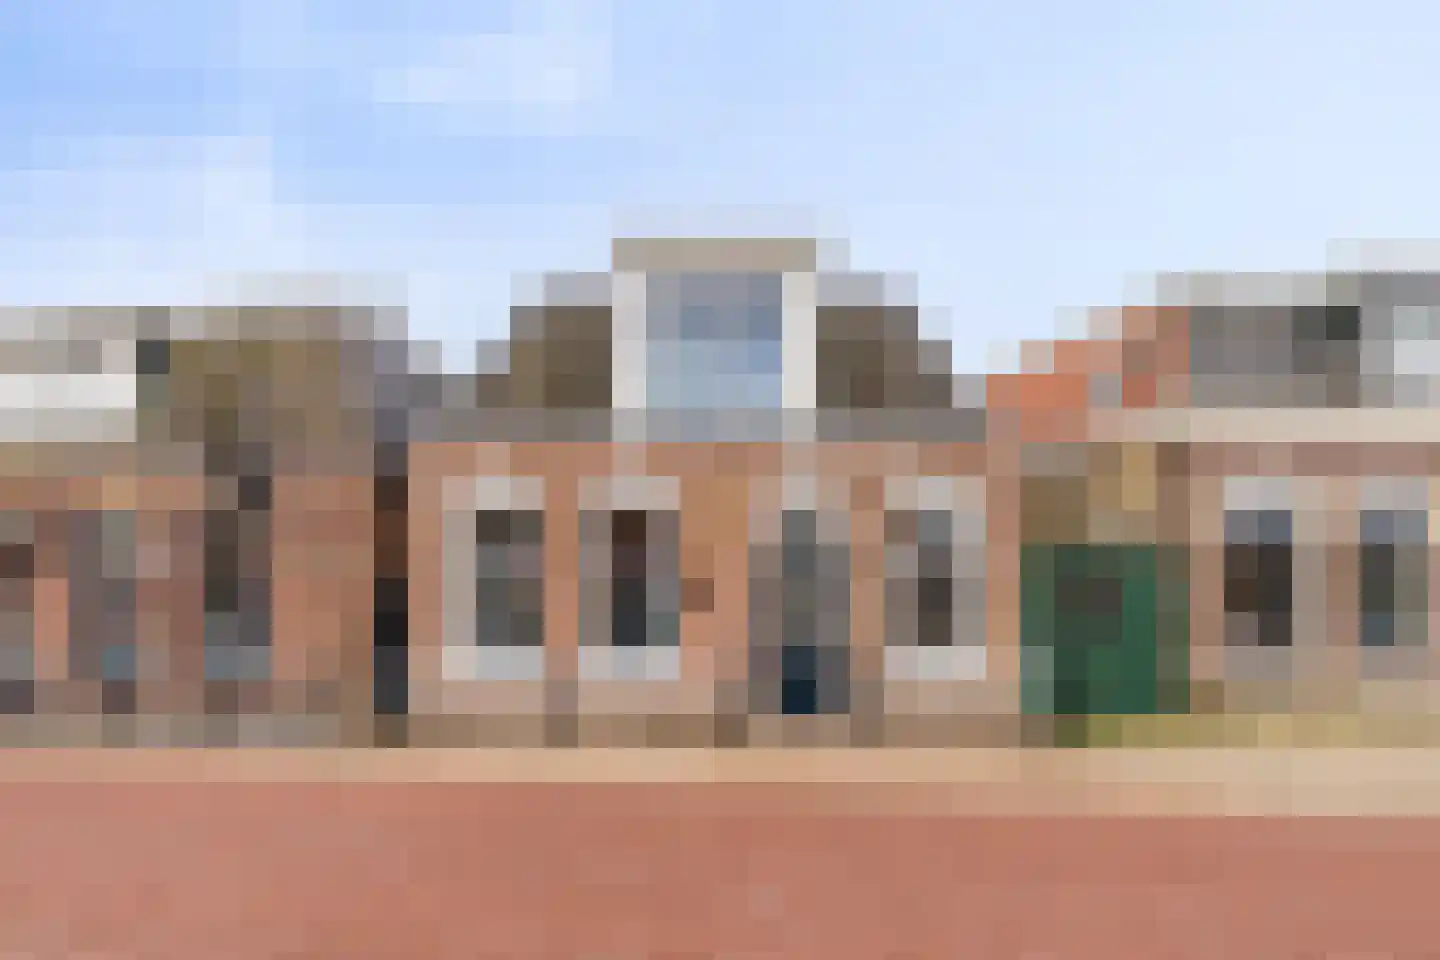
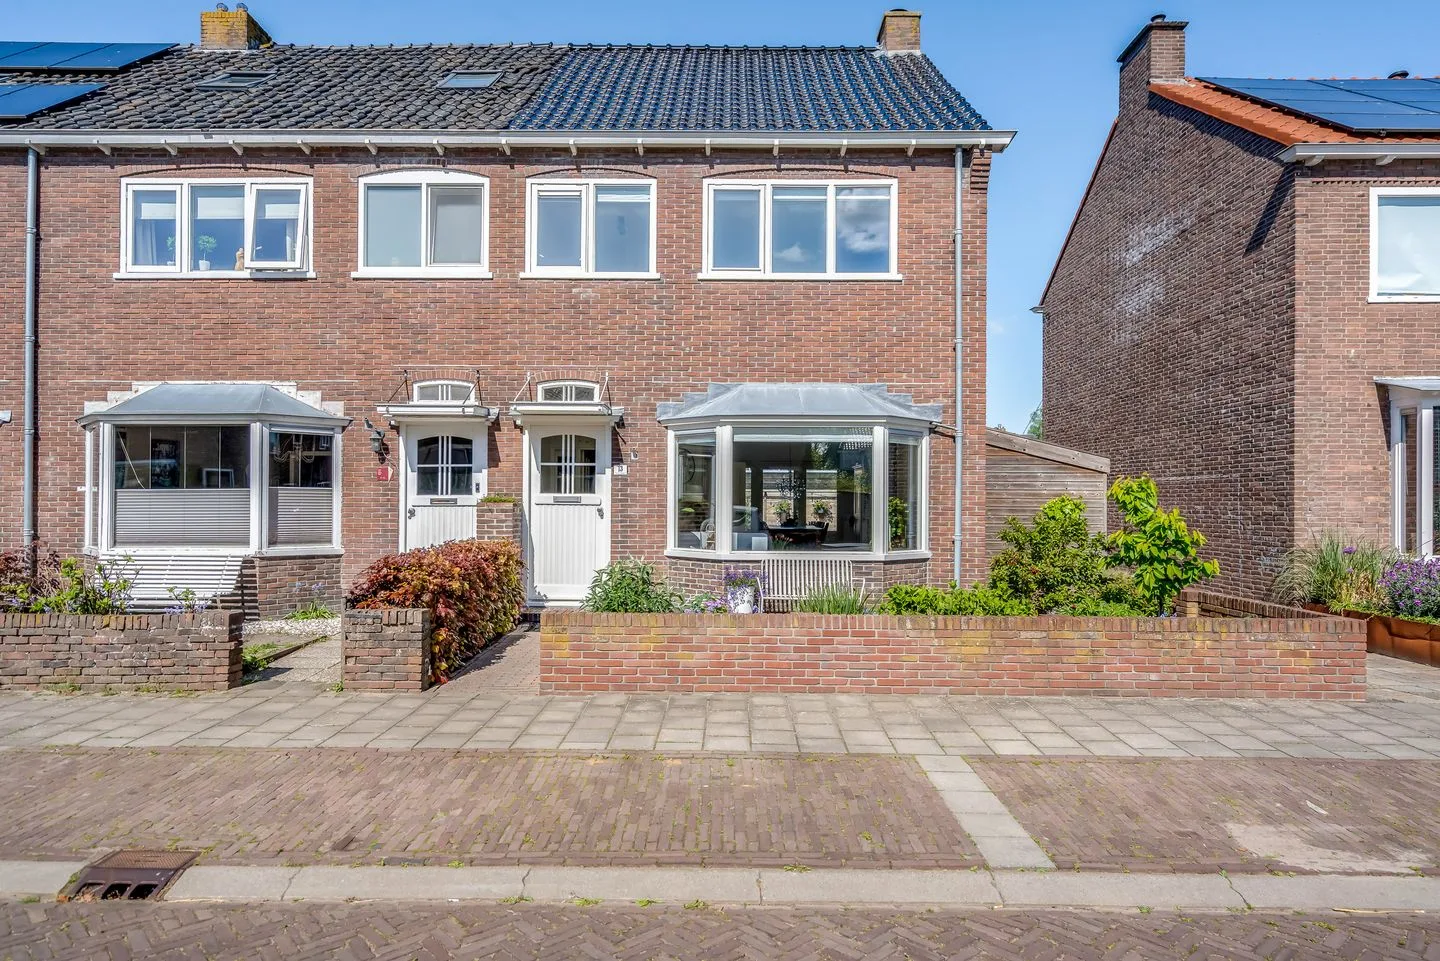
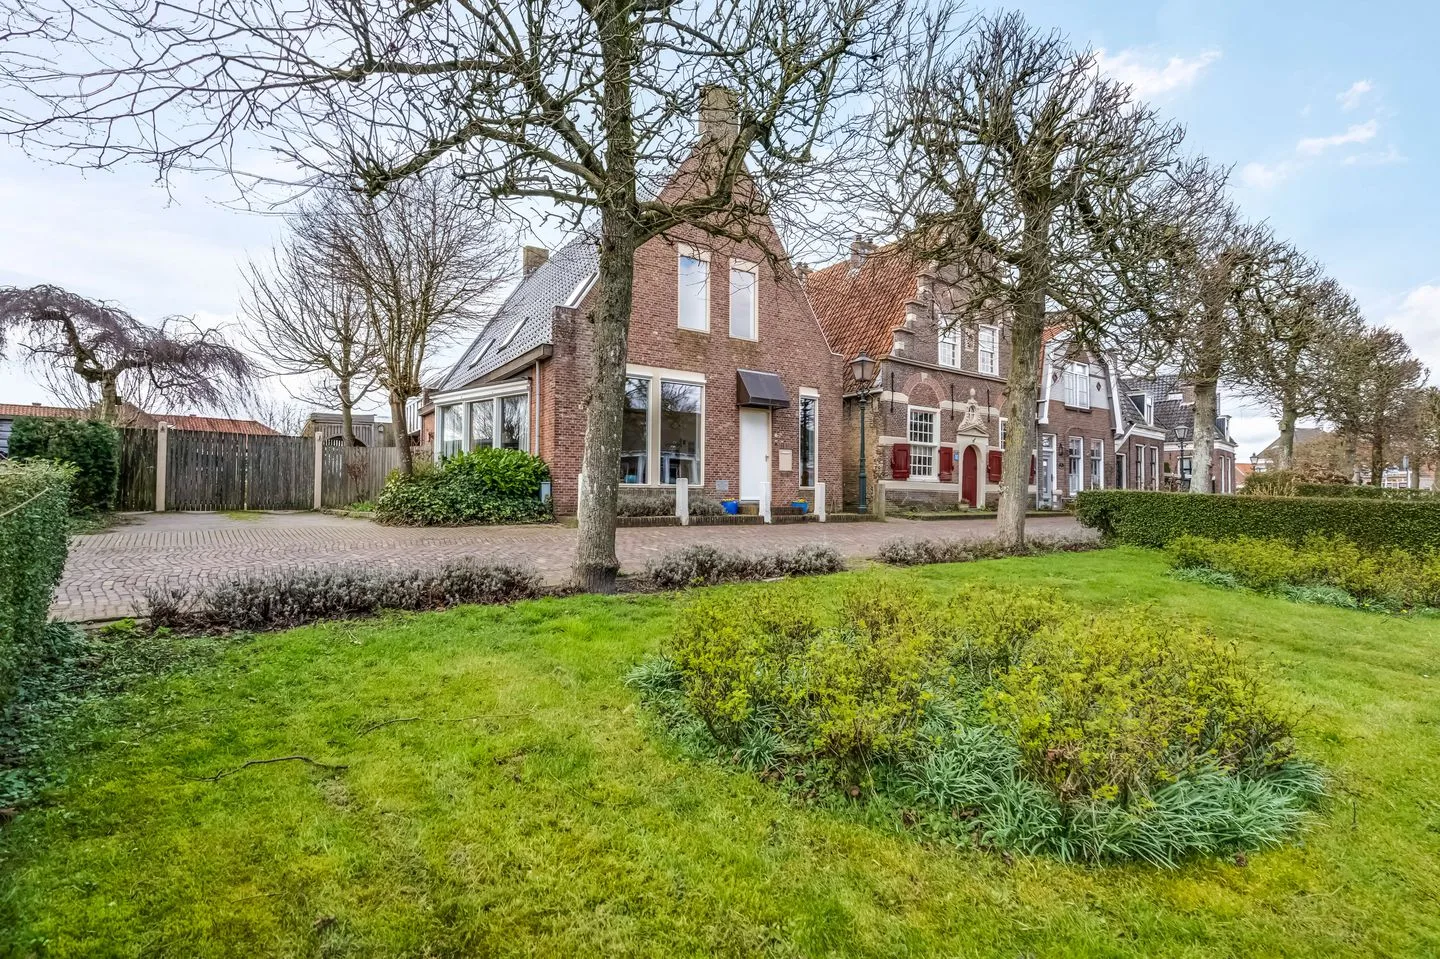
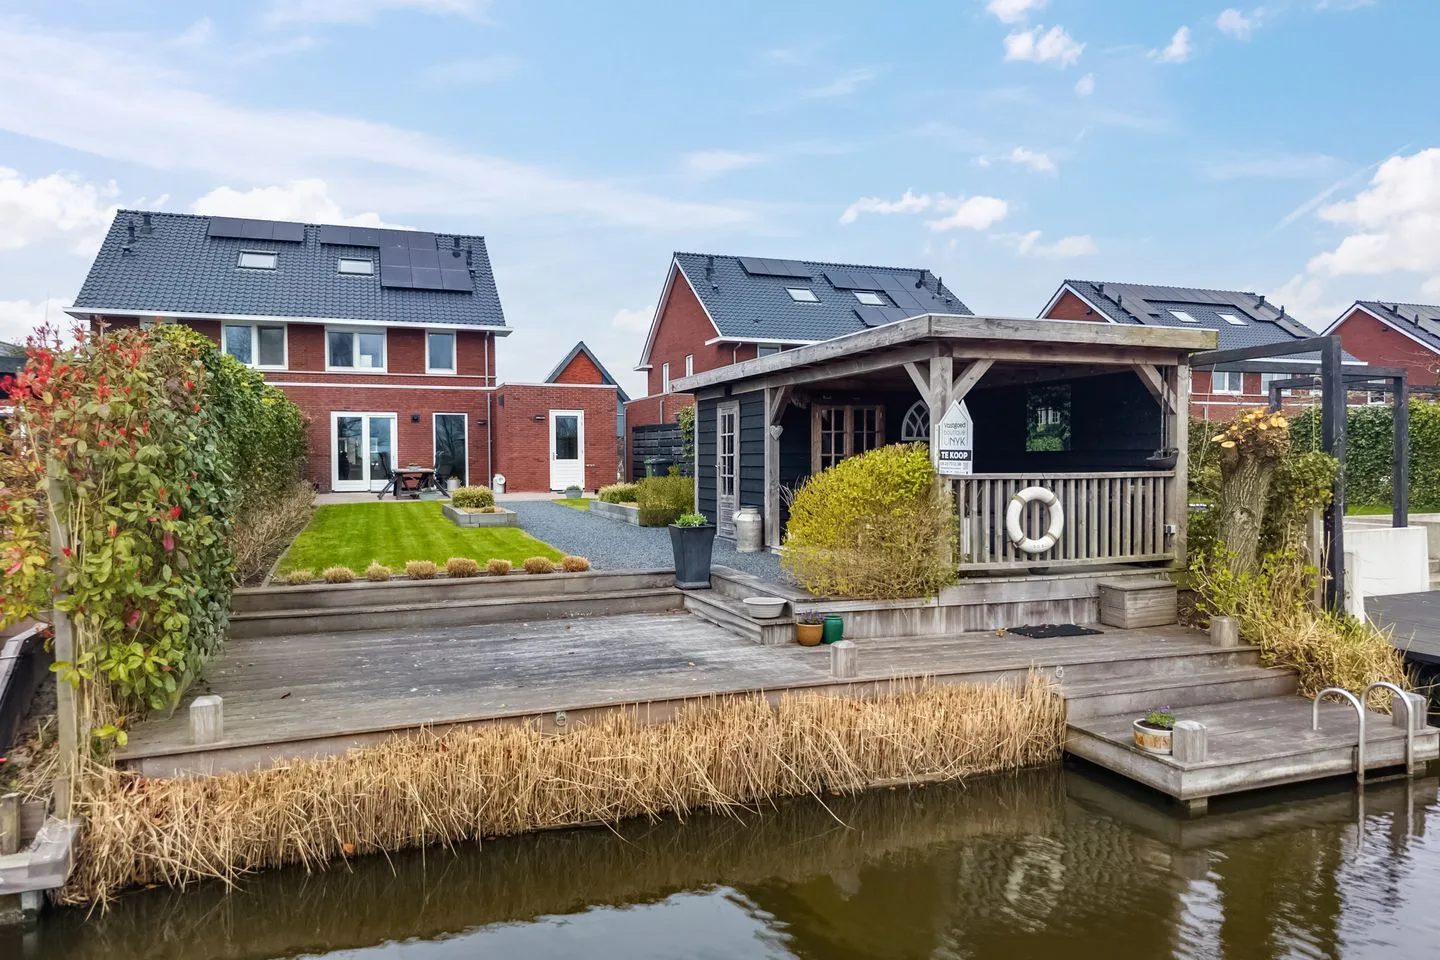
Lohmanstraat 13
8603AS Sneek
€ 395.000 k.k.
€ 3.347/m²
BSave as favorite- Living area
- 118 m²
- Land area
- 177 m²
- Bedrooms
- 4
-
- Available
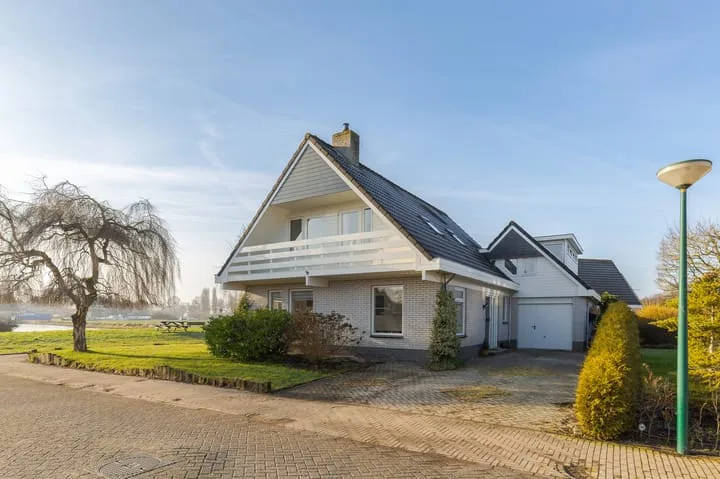
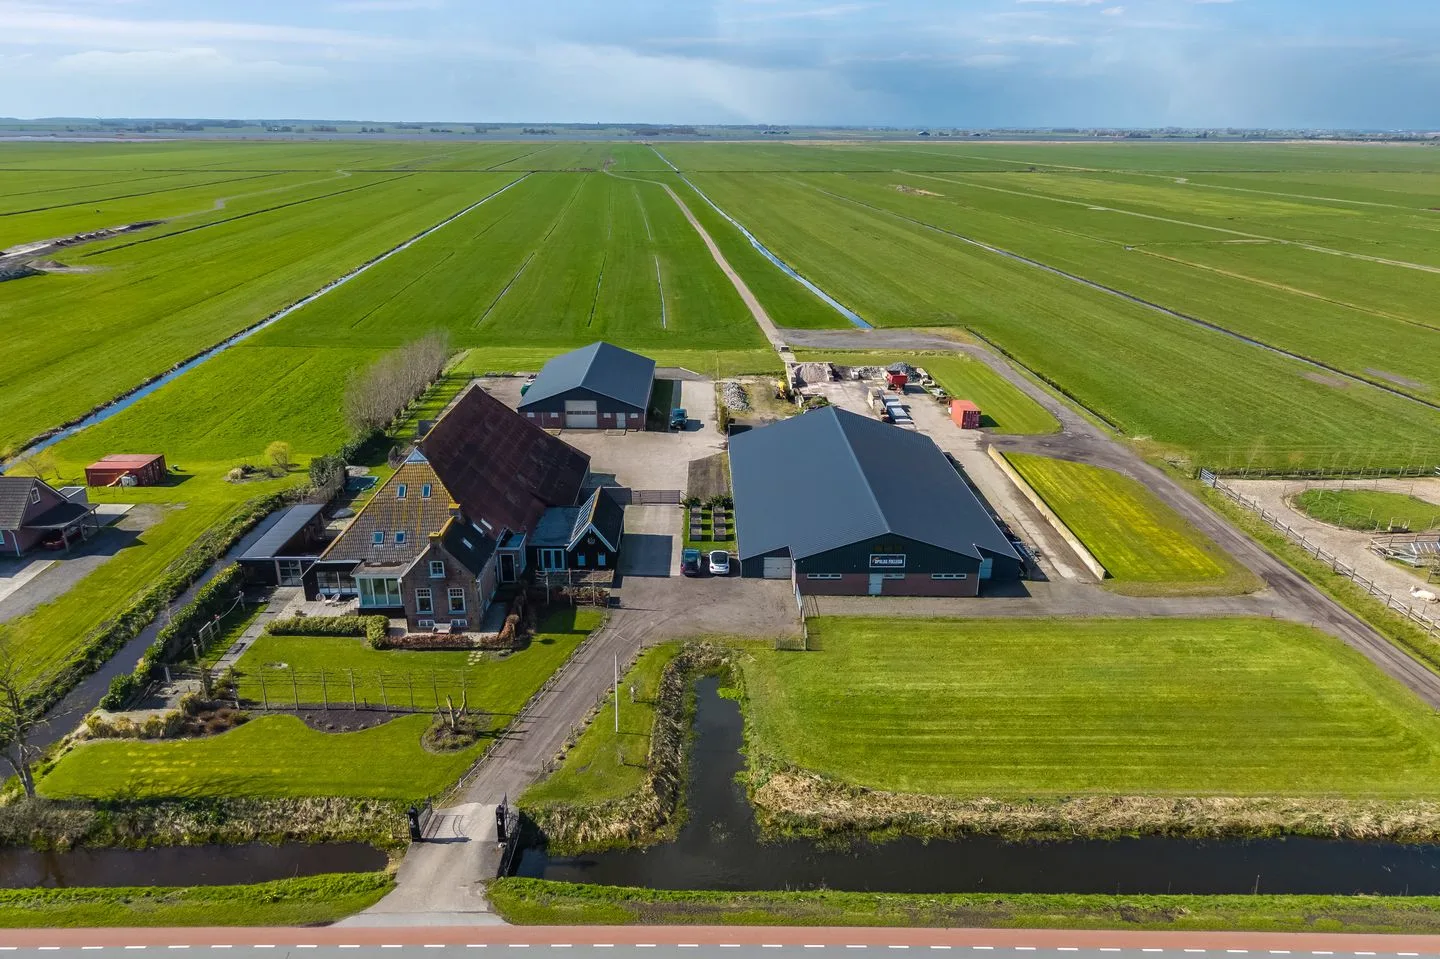
Straatweg 1
8535WG Follega
€ 1.495.000 k.k.
€ 3.883/m²
CSave as favorite- Living area
- 385 m²
- Land area
- 12000 m²
- Bedrooms
- 4
-
- Available
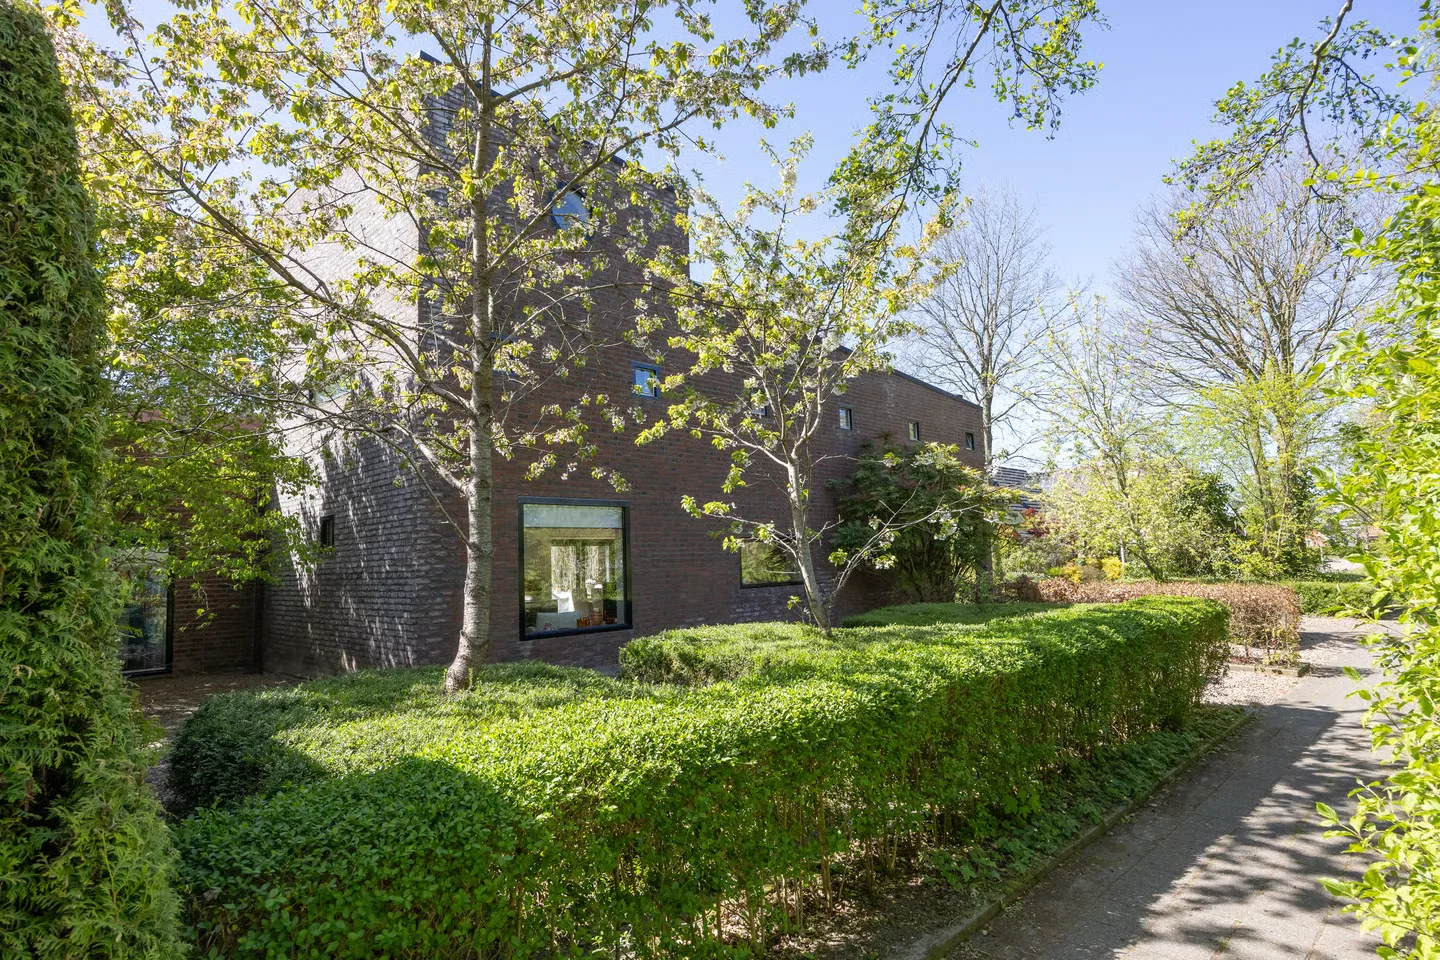
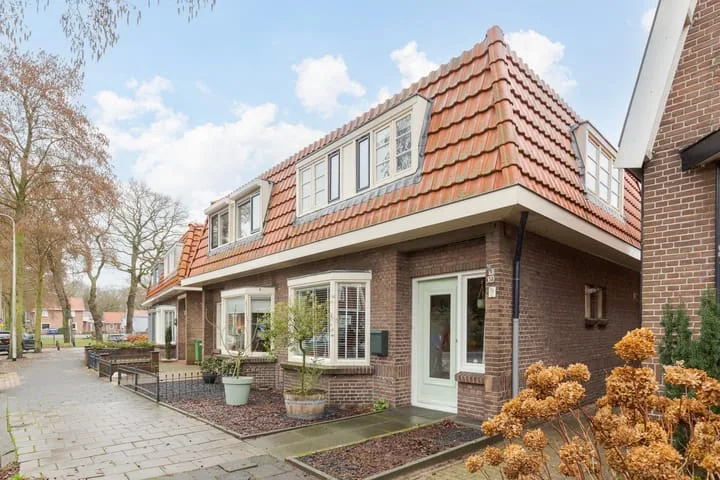
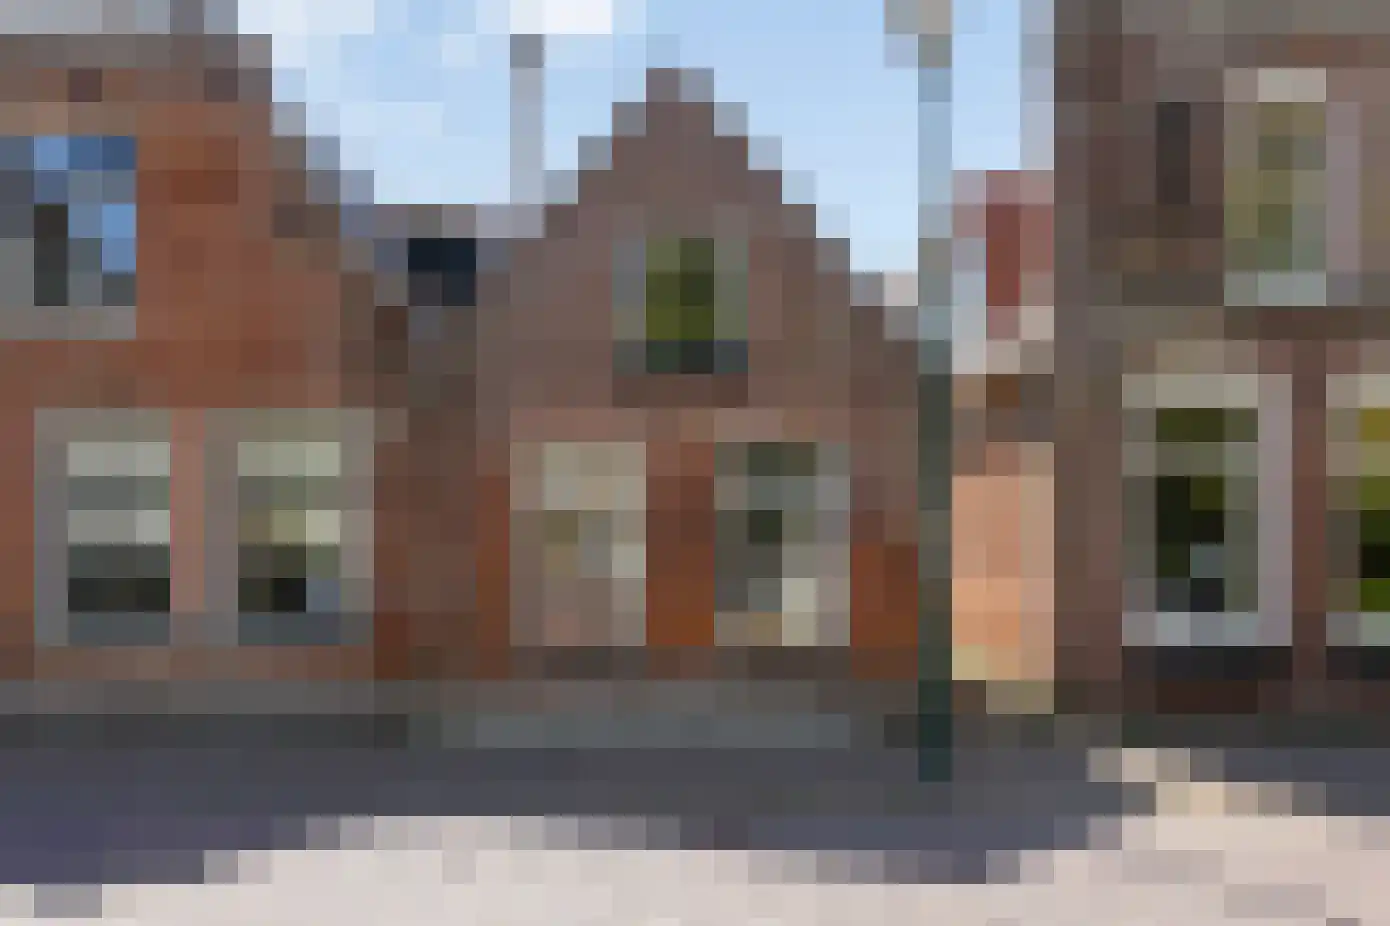
Eegracht 33
8651EG IJlst
€ 959.000 k.k.
€ 2.812/m²
ASave as favorite- Living area
- 341 m²
- Land area
- 1297 m²
- Bedrooms
- 8
-
- Available
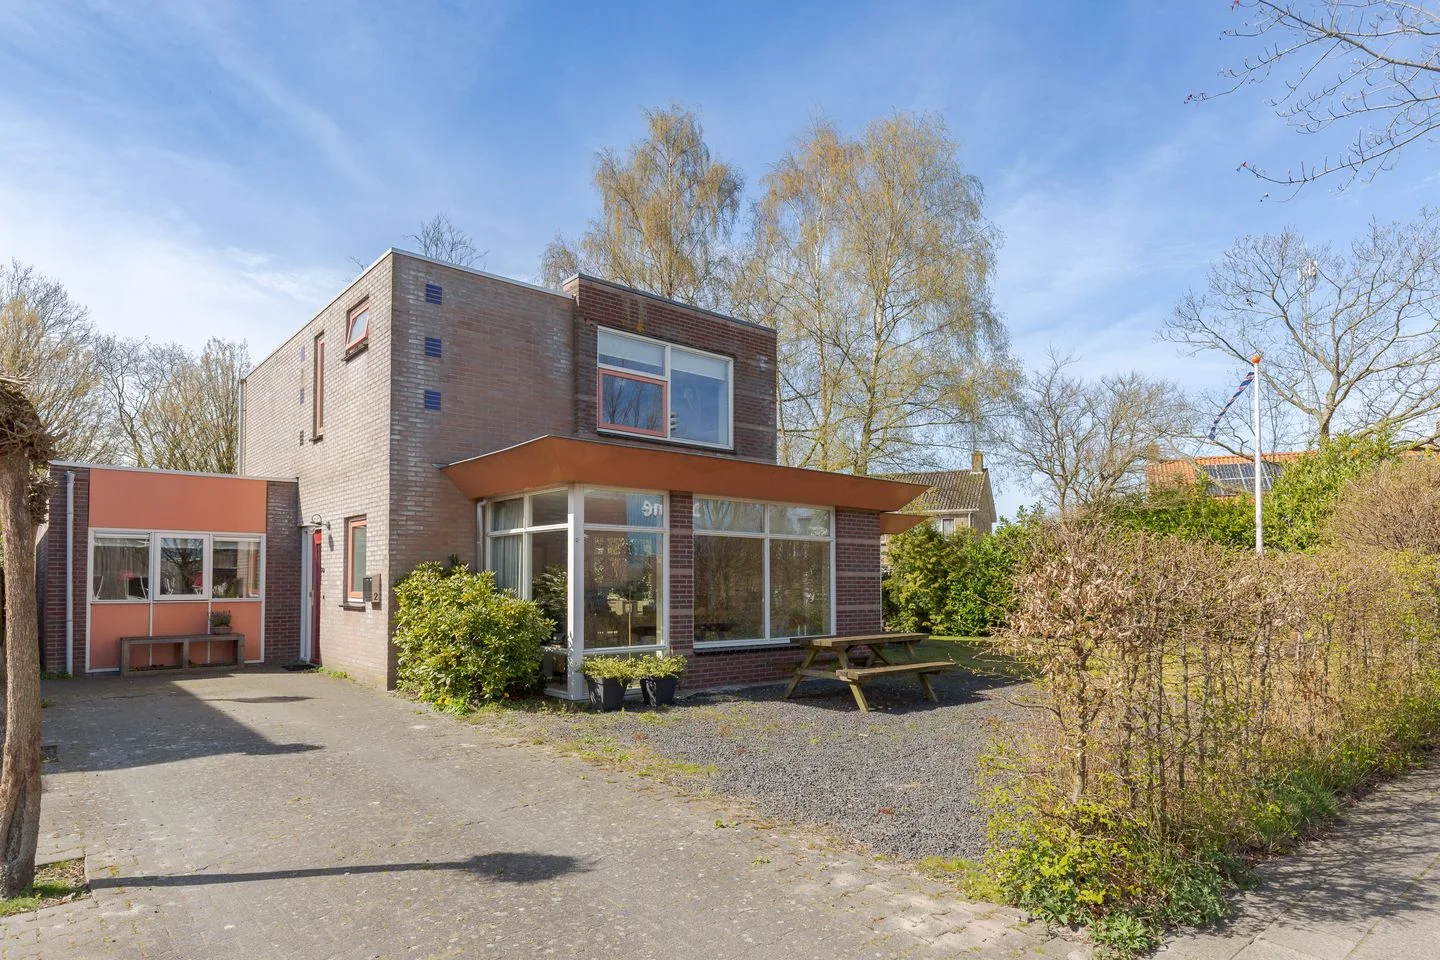
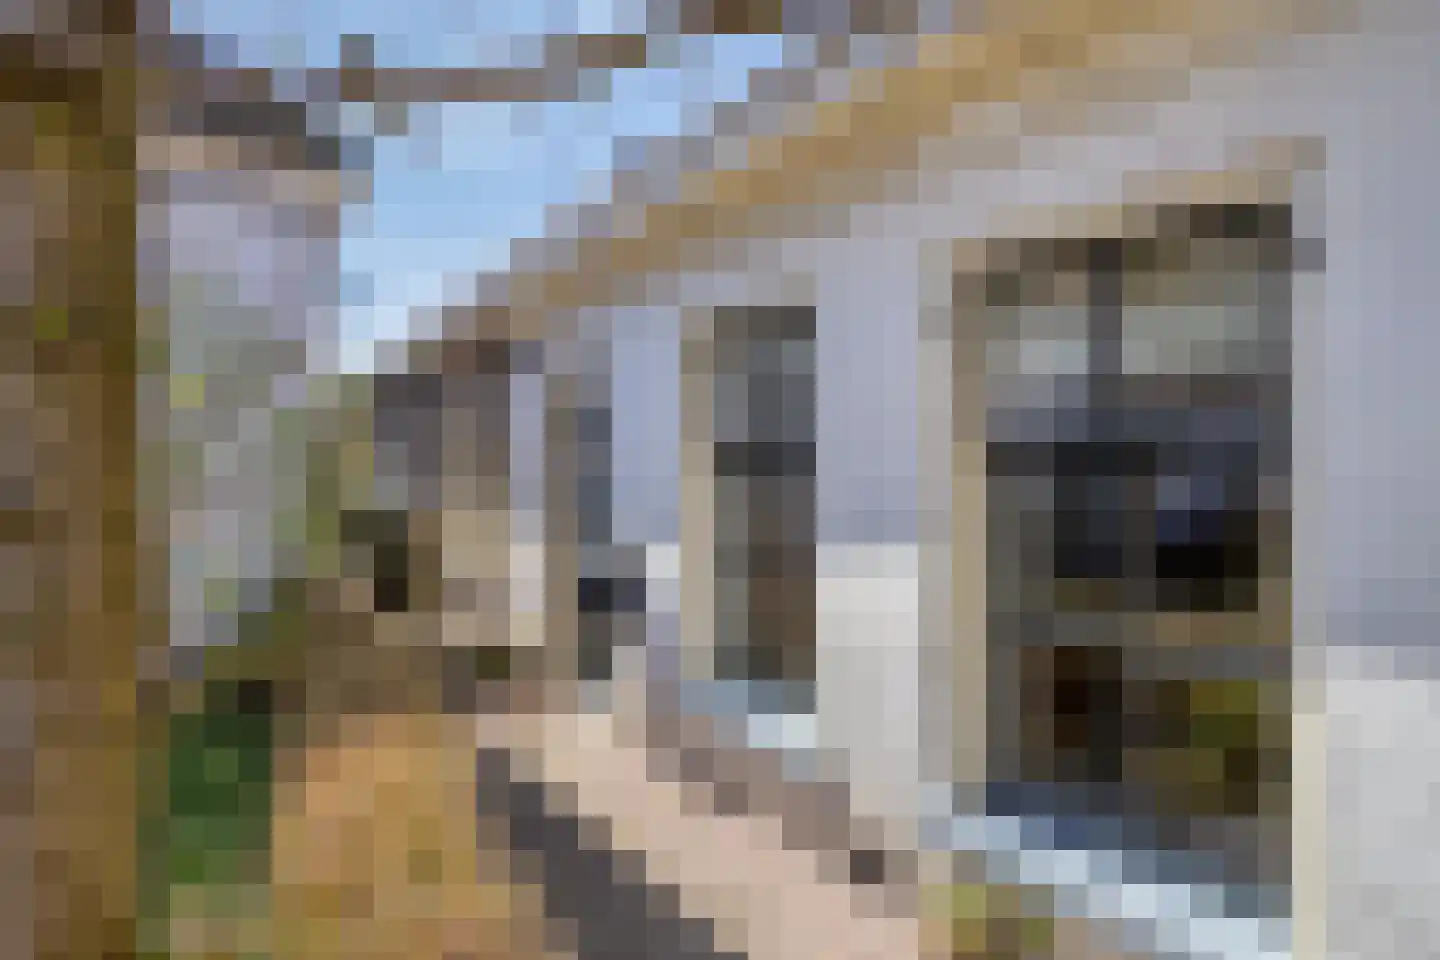
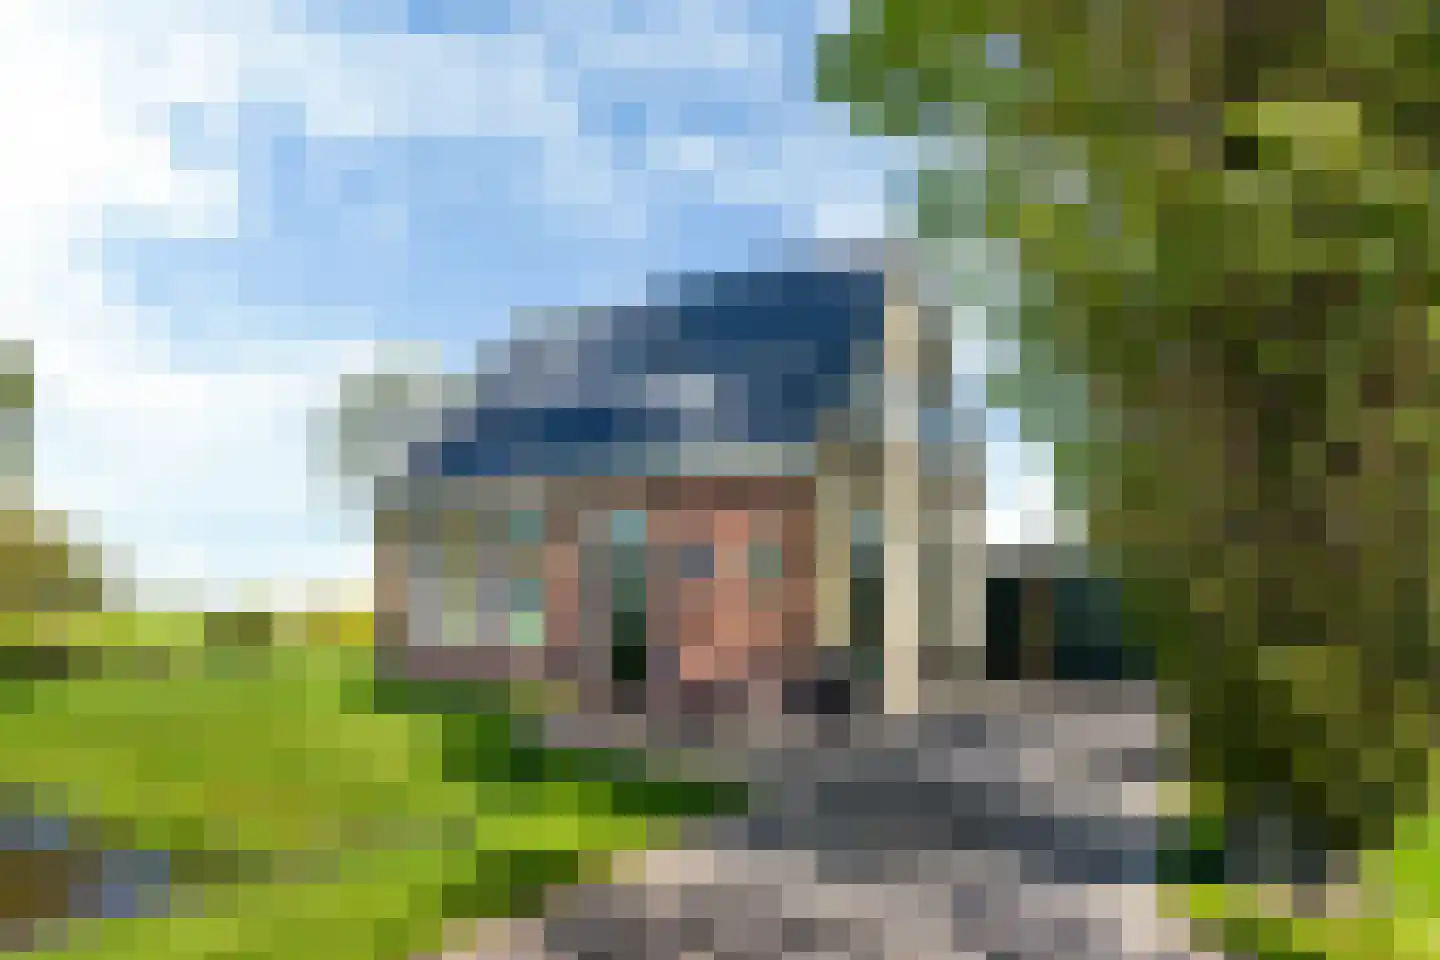
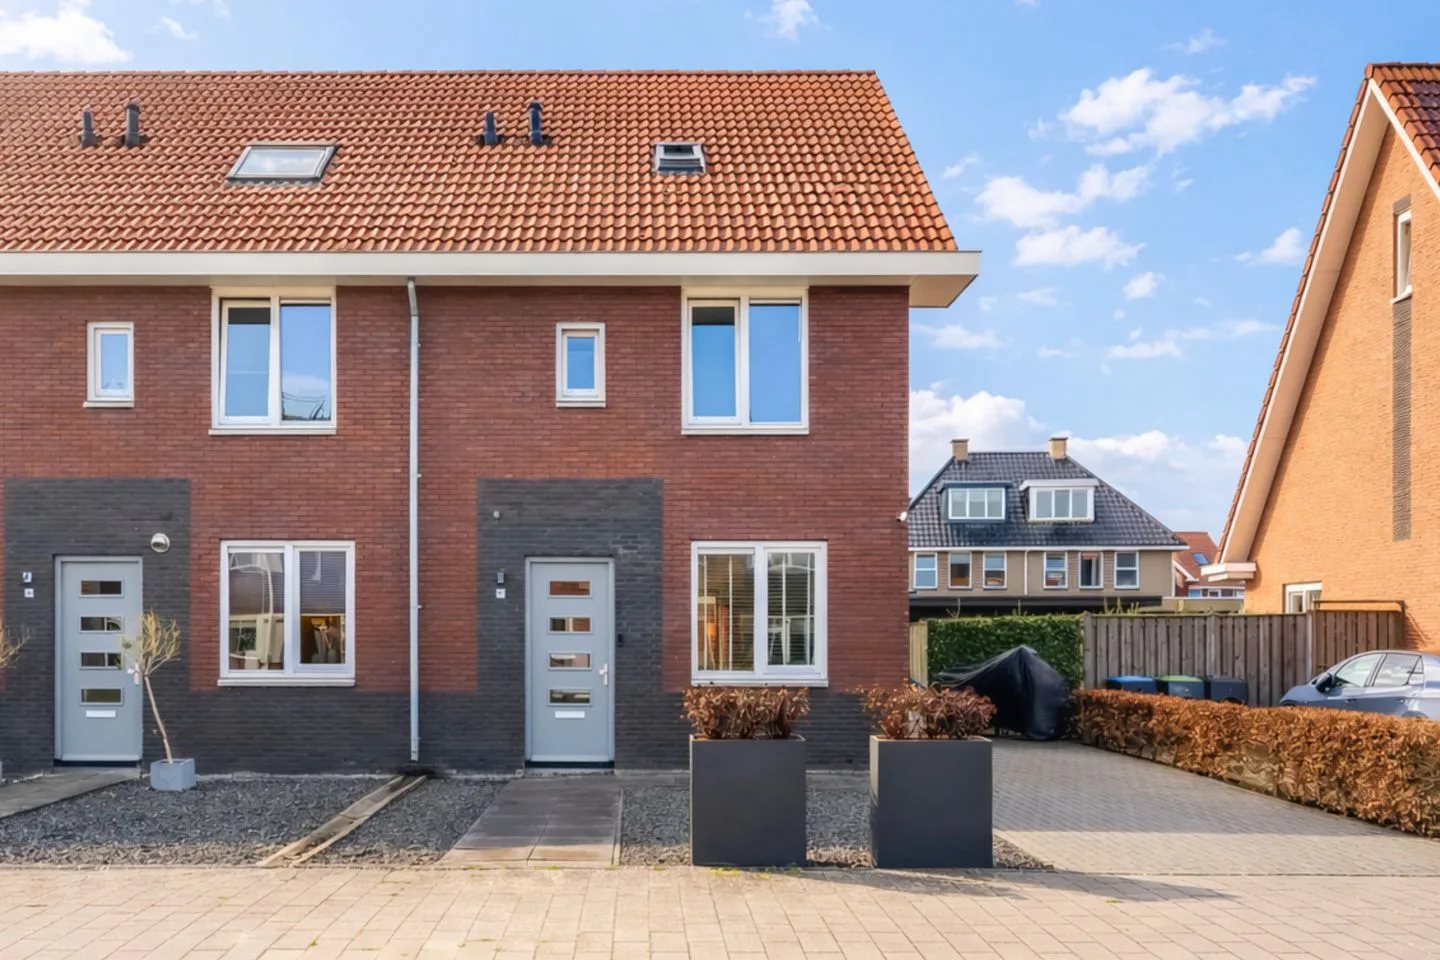
Kastanjeleane 90
8531ZA Lemmer
€ 499.000 k.k.
€ 4.265/m²
ASave as favorite- Living area
- 117 m²
- Land area
- 281 m²
- Bedrooms
- 4
-
- Available
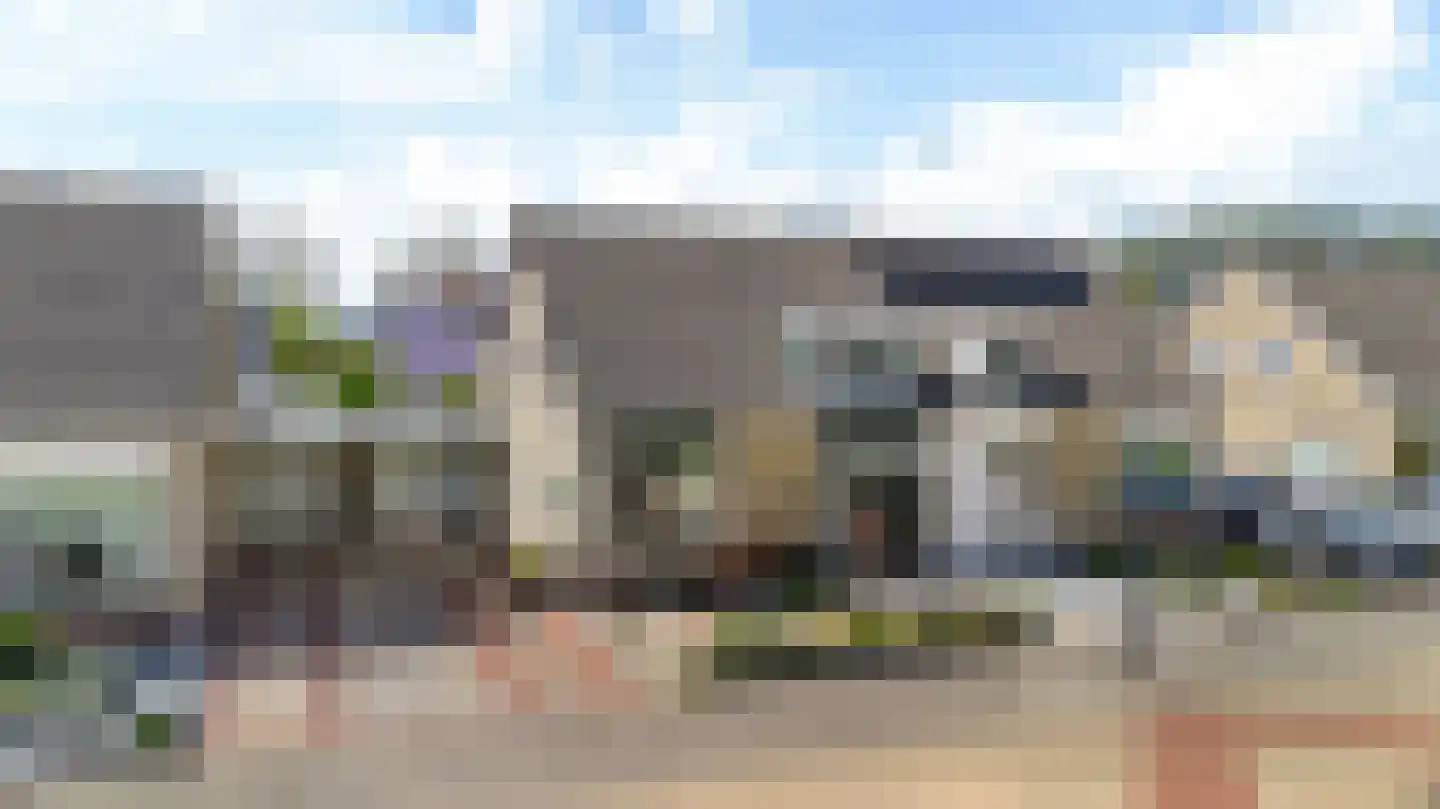
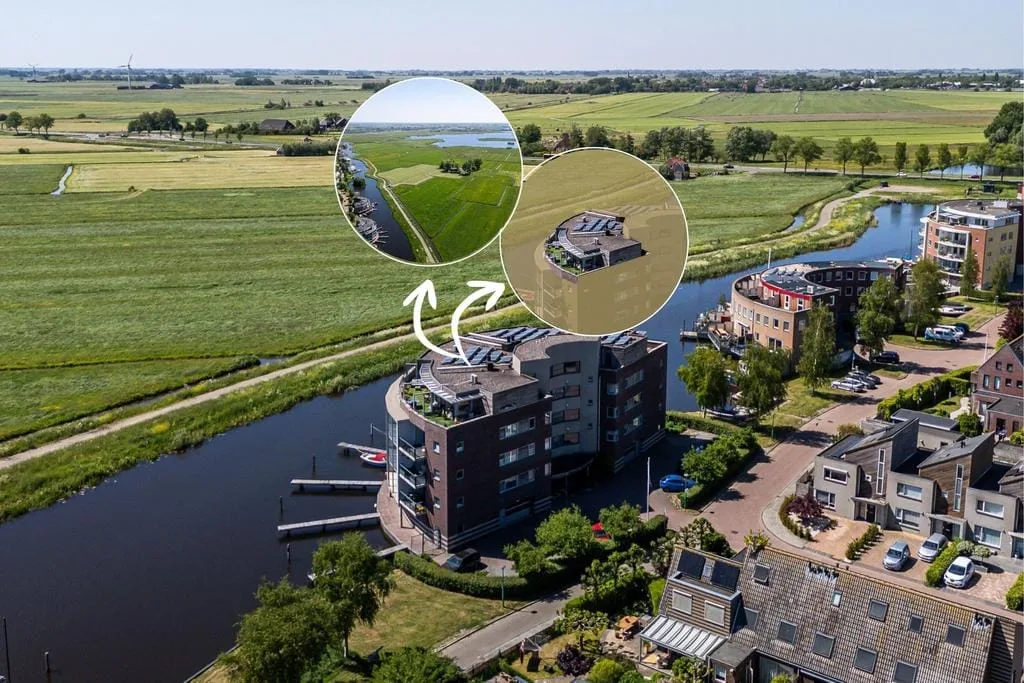
Apollovlinder 72
8607HV Sneek
€ 750.000 k.k.
€ 5.000/m²
ASave as favorite- Living area
- 150 m²
- Land area
- —
- Bedrooms
- 3
-
- Sold
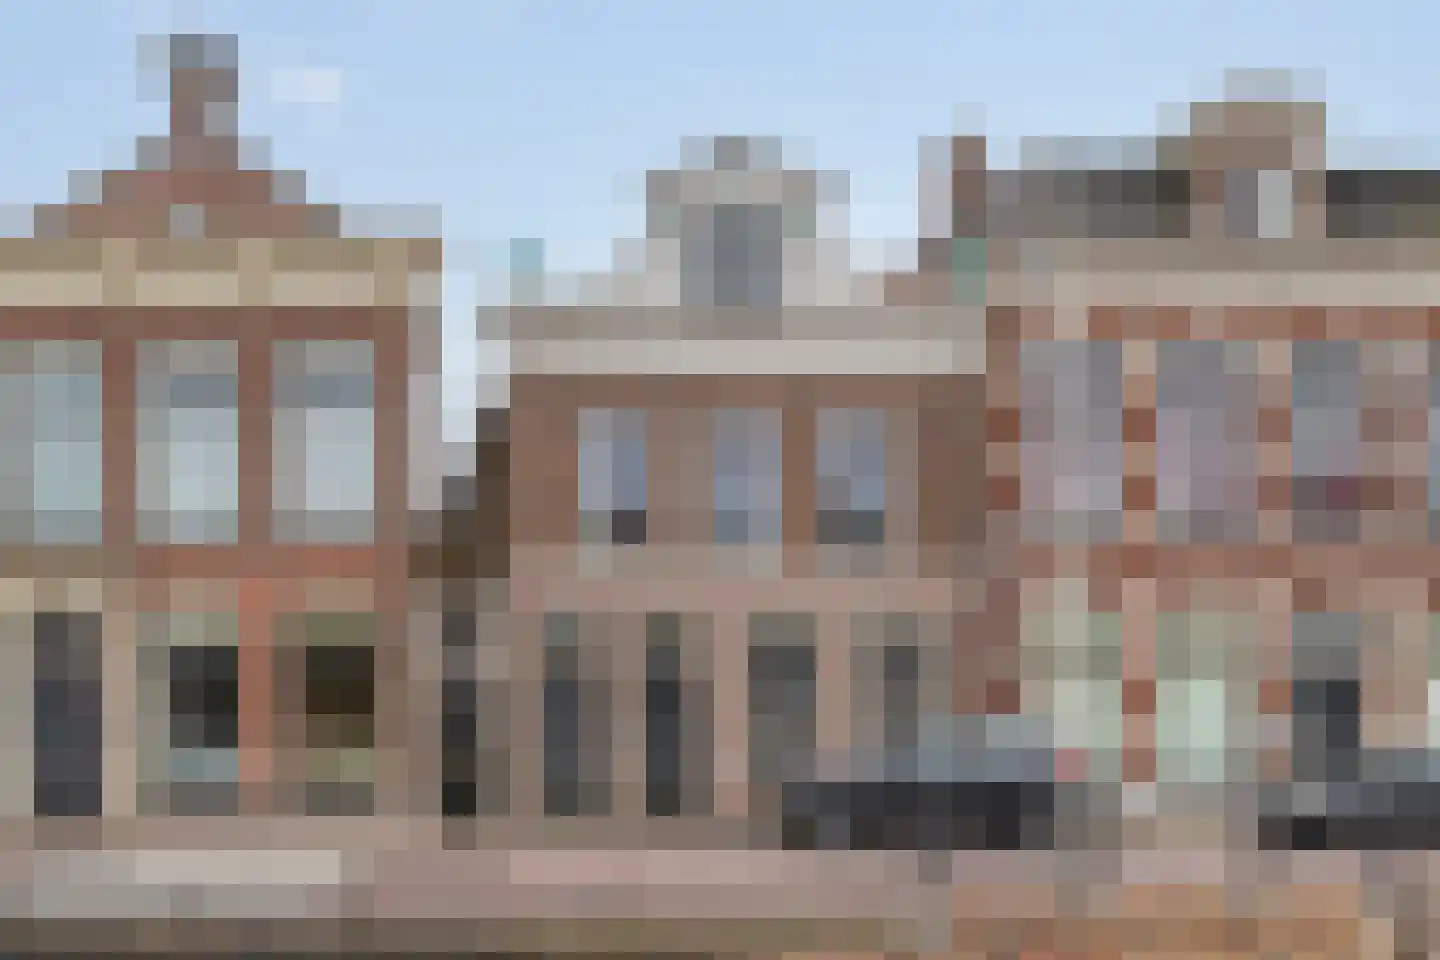
Hans Deinumstrjitte 17
8711LK Workum
€ 599.000 k.k.
€ 3.915/m²
ASave as favorite- Living area
- 153 m²
- Land area
- 474 m²
- Bedrooms
- 4
Reviews (104)
Review platforms
BronscoresTotal score
104 total reviews

Funda
65 reviews on Funda

39 reviews on Google
-
Joep Mens
10Toen wij bij een woning in Friesland een aanprijzing zagen van een mevrouw die in haar mantelpak op een supplank kwam aanvaren hadden wij meteen zoiets van ‘die makelaar moeten we hebben’. Met een enorm enthousiasme werd een fraaie woning beschreven. Niet veel later volgde een eerste kennismaking in een restaurant in Sneek en die was zeer hartelijk. Neeltje is een vrolijke en enthousiaste makelaar en draait niet om de feiten heen. Zij opperde ook meteen om mee te gaan kijken naar een woning waar wij interesse in hadden en stipte daar met haar vakkennis enkele potentiële problemen in het pand aan. Na de bezichtiging hadden wij al snel zoiets van ‘dit huis moet hem worden’ en zo zijn we met Neeltje en de wederpartij gaan onderhandelen. Ondanks wat strubbelingen met de verkopende makelaar bleef Neeltje altijd heel netjes en heeft ons vervolgens soepel begeleid door het gehele aankoopproces. Neeltje is ook ná het hele traject contact blijven houden met ons. Wij zouden haar een lichtpunt willen noemen in een makelaarswereld vol met grijze muizen. Absolute aanrader voor wat betreft de service en zeker ook wat betreft haar tarieven gedurende het hele gebeuren.
-
Roea Priem
10Translated by AINeeltje has a pleasant, personal approach. Very accessible in contact. Whole positive experience. Definitely a recommendation!
-
Ronald Molog
10Translated by AINeeltje has successfully sold our home in Echtenerbrug. What we find pleasant about her is her personal approach and the expertise of the housing market in Friesland. In addition, she does not have a 9:00 to 17:00 mentality and is also well reachable on weekends. In short, a nice, expert real estate agent to work with.
-
Kromme Warren 7
10Translated by AINeeltje has successfully sold our house in Echtenerbrug. What we find pleasant about her is her personal approach and the expertise of the real estate market in Friesland. In addition, she does not have a 9:00 to 17:00 mentality and is also well reachable on weekends. In short, a nice, expert real estate agent to work with.
-
Hans Deinumstrjitte 17
10Translated by AIYou're a top and unique person. What a nice personal guidance in a process that is overwhelming for most people. You're a recommendation for everyone.
-
De Fûke 19
10Translated by AII am very satisfied with Neeltje, an amazing and involved real estate agent who puts in 100% effort. She has a smooth personality, positive aura, and you quickly feel at home with her. I can't think of a better real estate agent. We had an instant click, and that works super well from both sides! Through Neeltje I also found my new home, she knew what I wanted and what suited me. I am super grateful to her for that ❤️. I knew right away, I want Neeltje for the sale va…
-
Stationsstraat 3
10Translated by AINeeltje is the most competent and professional real estate agent I've had to deal with so far. She is always reachable by phone and/or Whatsapp even after 5 PM and also on weekends. At every viewing, she personally made sure that everything looked perfect (which of course is the seller's task) Furthermore, Neeltje is very active on the 'socials' in a good way. Her tip about having an inspection done by the monument warden is extremely valuable...
-
Marije Stilma
10Translated by AINeeltje has helped us with buying our first home. As a first-time buyer, you naturally have many questions but with Neeltje you can ask anything. Neeltje listened carefully and attentively to our wishes and boundaries. Through her expert guidance, she gave us valuable advice. She is sharp during viewings and helps you see the full picture. In this she is honest and sincere. We are very satisfied with Neeltje's help! If you're talking about 'your personal real estate agent', then Neeltje from Vastgoedboutique UNYK makes this promise come true!
-
Tramstrjitte 24
10Translated by AINeeltje has helped us with the purchase of our first home. As a first-time buyer, you naturally have many questions but with Neeltje you can ask anything. Neeltje listened carefully and attentively to our wishes and boundaries. Through her expert guidance, she gave valuable advice. She is sharp during viewings and helps you see the full picture. In this she is honest and sincere. We are very satisfied with Neeltje's help!
-
Prinsessekade 16
10Translated by AIWe got in touch with Neeltje because we bought our new house through her and then decided to let her handle the sale of our house on the Prinsessekade. We have experienced her as; very knowledgeable and extremely enthusiastic both as a real estate agent and as a person.
-
Meerkoet 22
10Translated by AIAn excellent real estate agent. Very pleasant and professional guidance. Would not recommend any other real estate agent. Always plenty of time and thinks with the seller.
-
Wieke Dijkstra
10Translated by AIAn spontaneous conversation with Neeltje about how we could best sell our house turned out to be the starting point of a successful journey! Shortly after, the right match was found and the property was sold without any hassle or unnecessary pressure. Neeltje is enthusiastic and involved, and the personal contact we had was experienced as very pleasant. The guidance was professional with short lines and quick switching where necessary. We look back on this with a very good feeling and can definitely recommend Vastgoedboutique UNYK.
-
Meerweg 4
10Translated by AII can't imagine a better real estate agent, quick to switch to short lines. Sense of detail and knowledge of the current market.
-
P.J. Troelstrastraat 4
10Translated by AISincerely recommended for the sale and purchase of your home! For us now no longer a sale and purchase, but we would definitely choose again real estate agent Neeltje Oostra from Vastgoedboutique UNYK. A lot of personal attention for you as a seller. And, just as much attention for the interested parties for your home, which makes the - still exciting - sale/purchase a pleasant experience with an optimal result! We have a lot of experience and can say; this real estate agent…
-
Frieswijkstraat 10
10Translated by AIThe contact with Neeltje was very pleasant. She is attentive and knowledgeable, always responds quickly, thinks along and is helpful with everything that comes into play when selling a house. Very thorough for each other, I am very happy that I chose this real estate agent and wholeheartedly recommend her!
-
Tsjerkebuorren 48
9Translated by AIWe are very satisfied with the professional support and pleasant communication with Neeltje. Short lines, a personal touch and excellent reachability. It's because we have now found our dream house that we would start cooperation with her again.
-
Uilke Boonstralaan 28
10Translated by AIFantastic real estate agent, always everything in consultation, the best real estate agent in Friesland. She is there for you with advice and support.
-
Amber Minnema
10Translated by AII am super satisfied with Vastgoedboutique UNYK who helped me find my first purchase property. She was very involved and was always ready to answer my questions. Thanks to her expertise and fine communication I have now found the perfect house!
-
Leliestraat 5
10Translated by AINeeltje is a very nice real estate agent. She is highly involved, thinks along and really stands up for your interests. I am very happy that she wanted to do the negotiations for me, because they can sometimes still be quite tough in the oversupplied housing market in 2025, and then you really have to keep your head cool. We experienced some adventures, but it worked out! A nice new place in Sneek to make my home.
-
't Bosk 55
10Translated by AII am super satisfied with Vastgoedboutique UNYK who helped me find my first purchase property. She was very involved and was always ready to answer my questions. Thanks to her expertise and fine communication I have now found the perfect house!