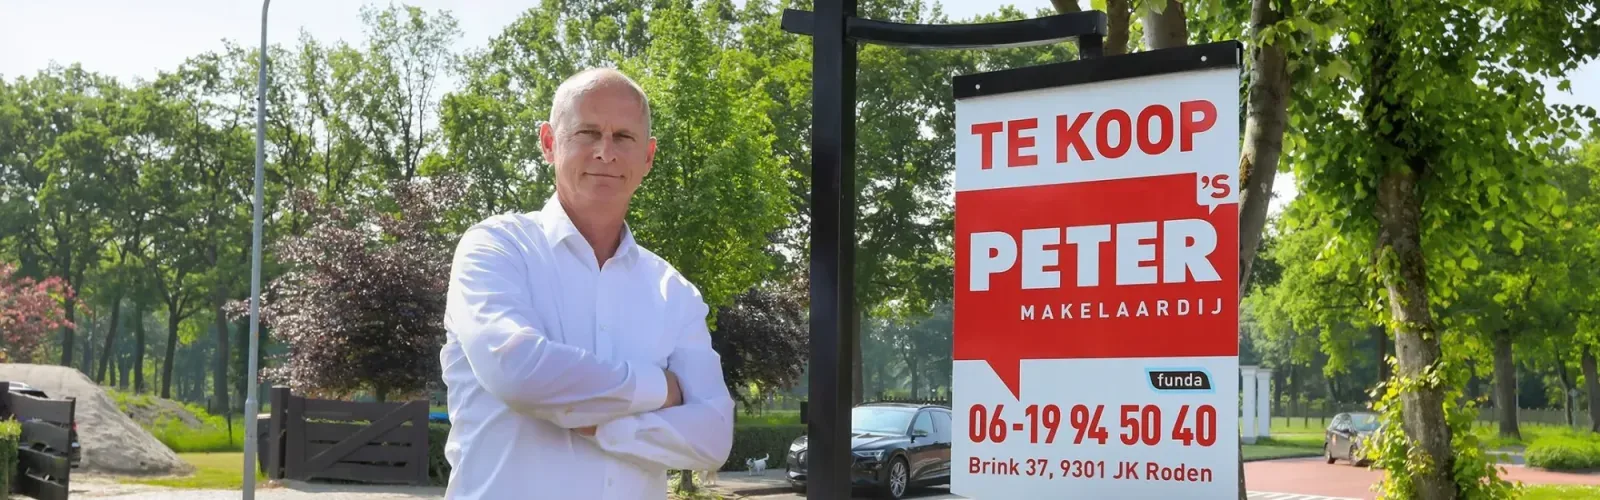
Peter's Makelaardij
Selling a home is a process that requires attention and expertise. Every situation has its own nuances, from the market value to the seller's wishes. We help you with a personal and goal-oriented advice to choose the right strategy. With a targeted approach, we ensure that your home is in the best position to sell quickly and at an achievable price. Our experience ensures transparency and trust, so that you fully understand every step o...
Current housing stock
-
- Available
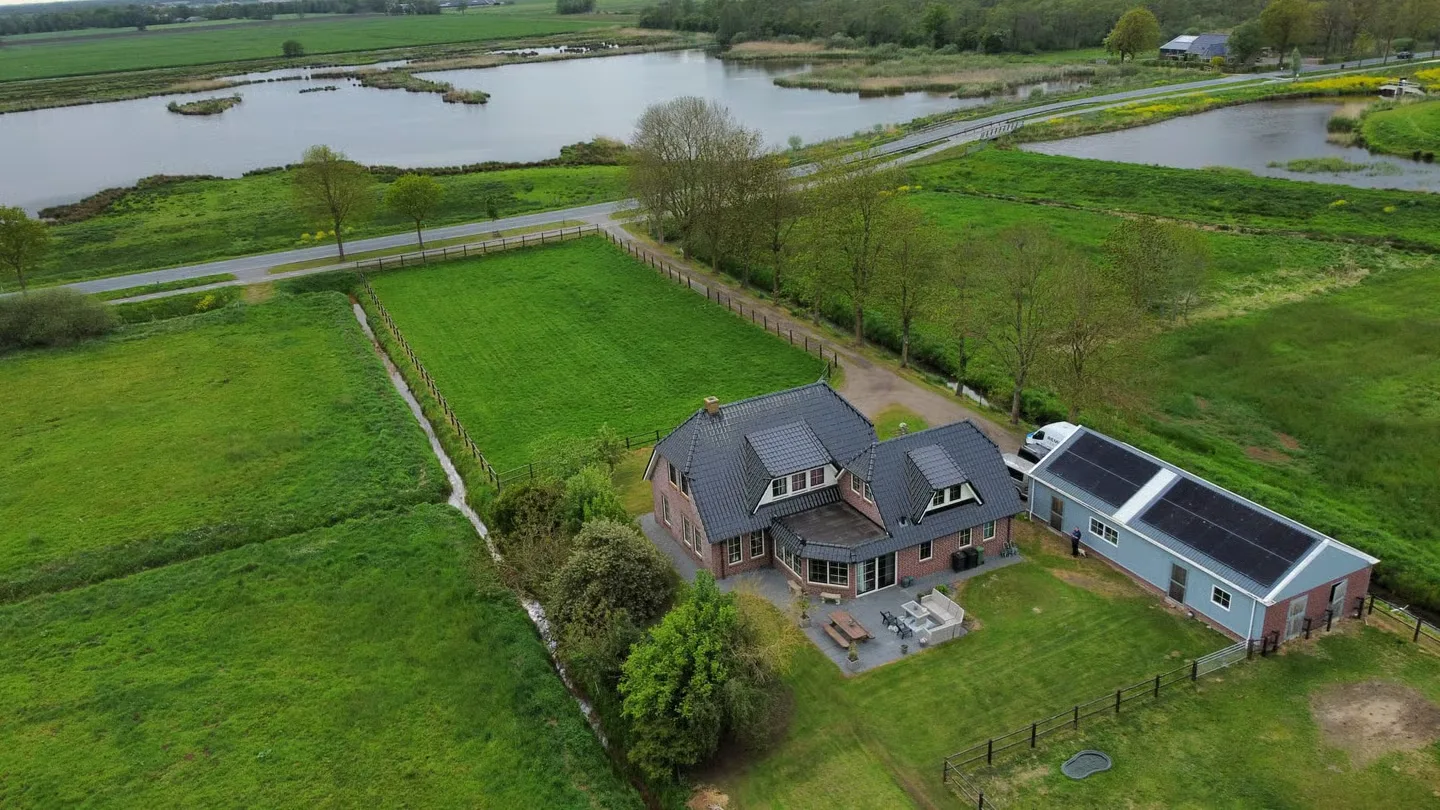
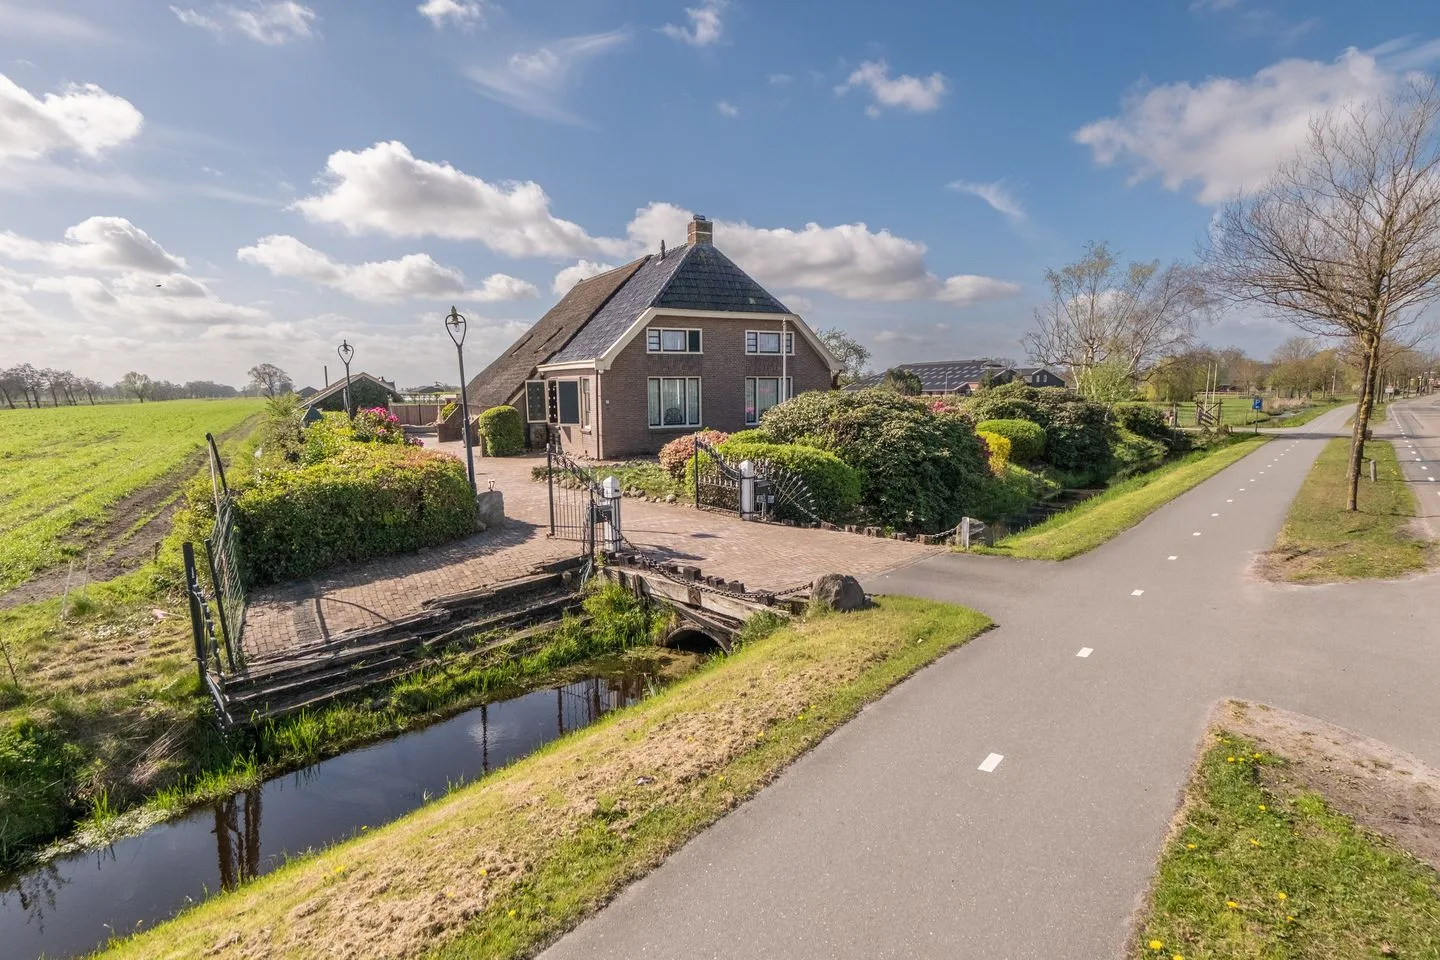
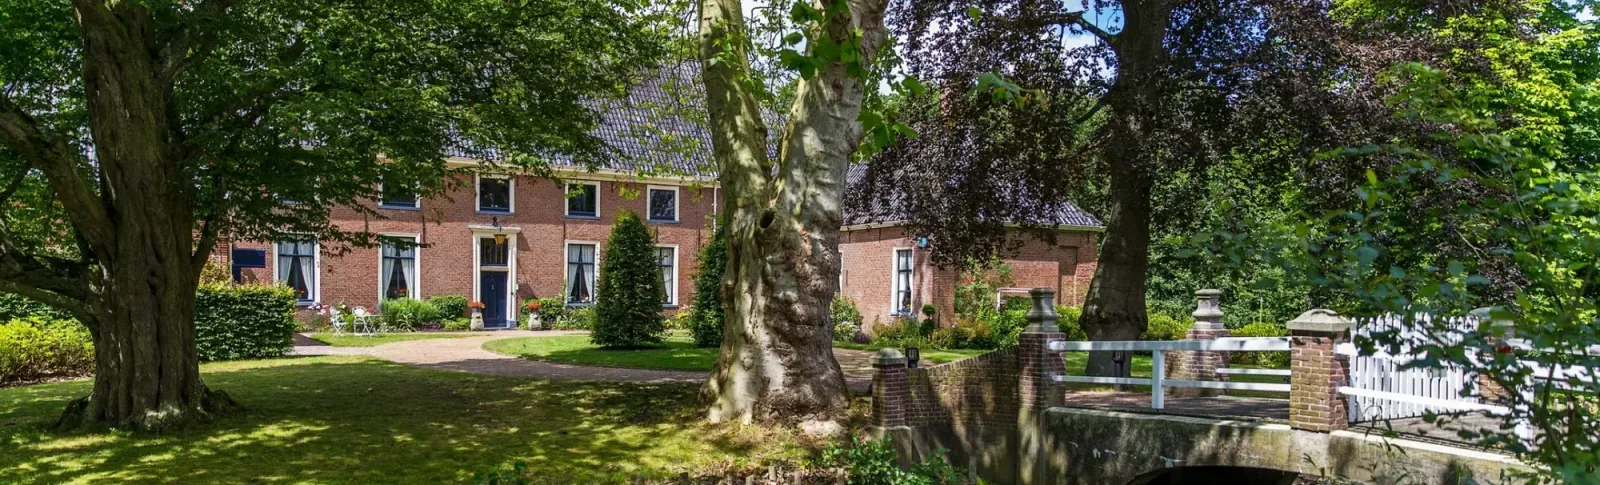
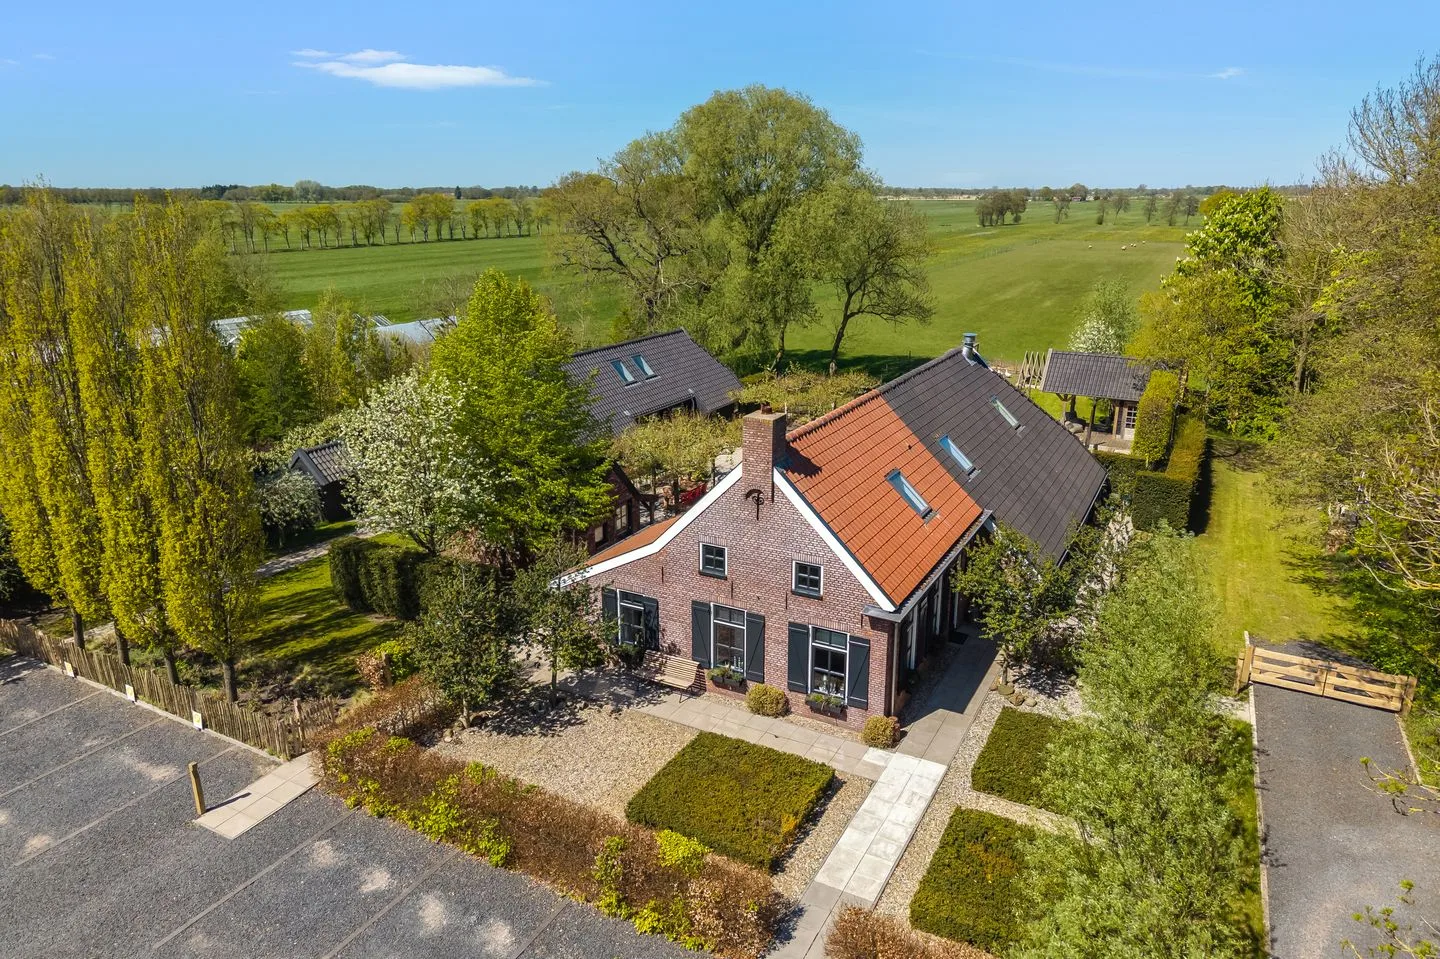
Achtersteweg 6
9315TA Roderwolde
€ 1.295.000 k.k.
€ 3.960/m²
ASave as favorite- Living area
- 327 m²
- Land area
- 13120 m²
- Bedrooms
- 4
-
- Available
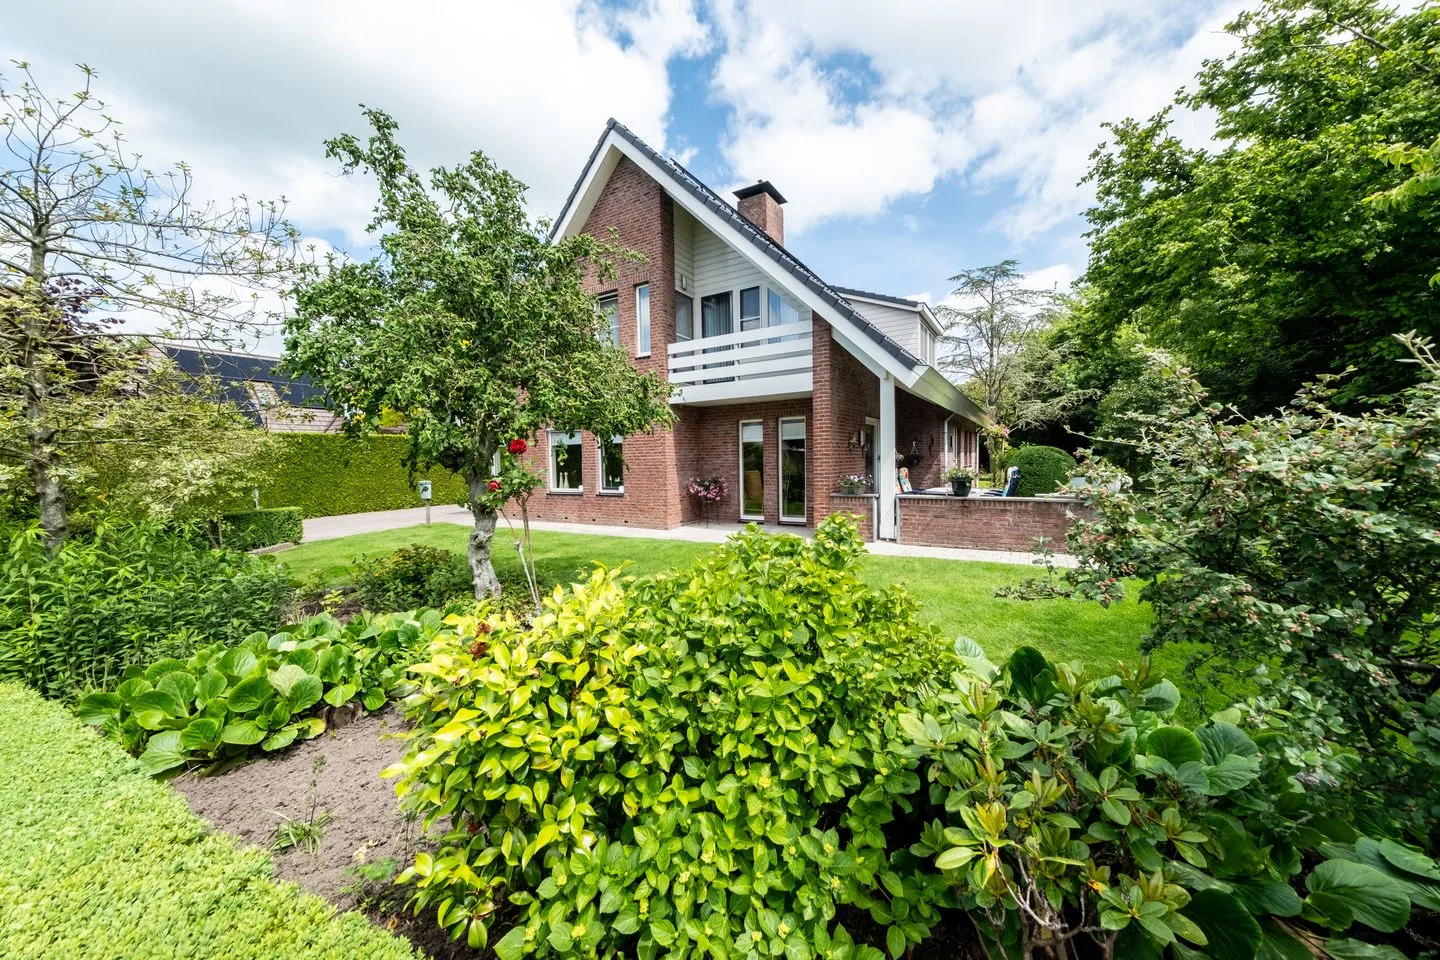
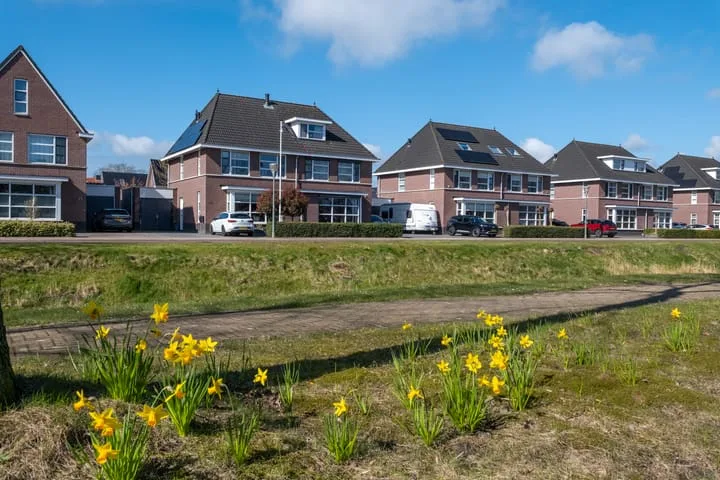
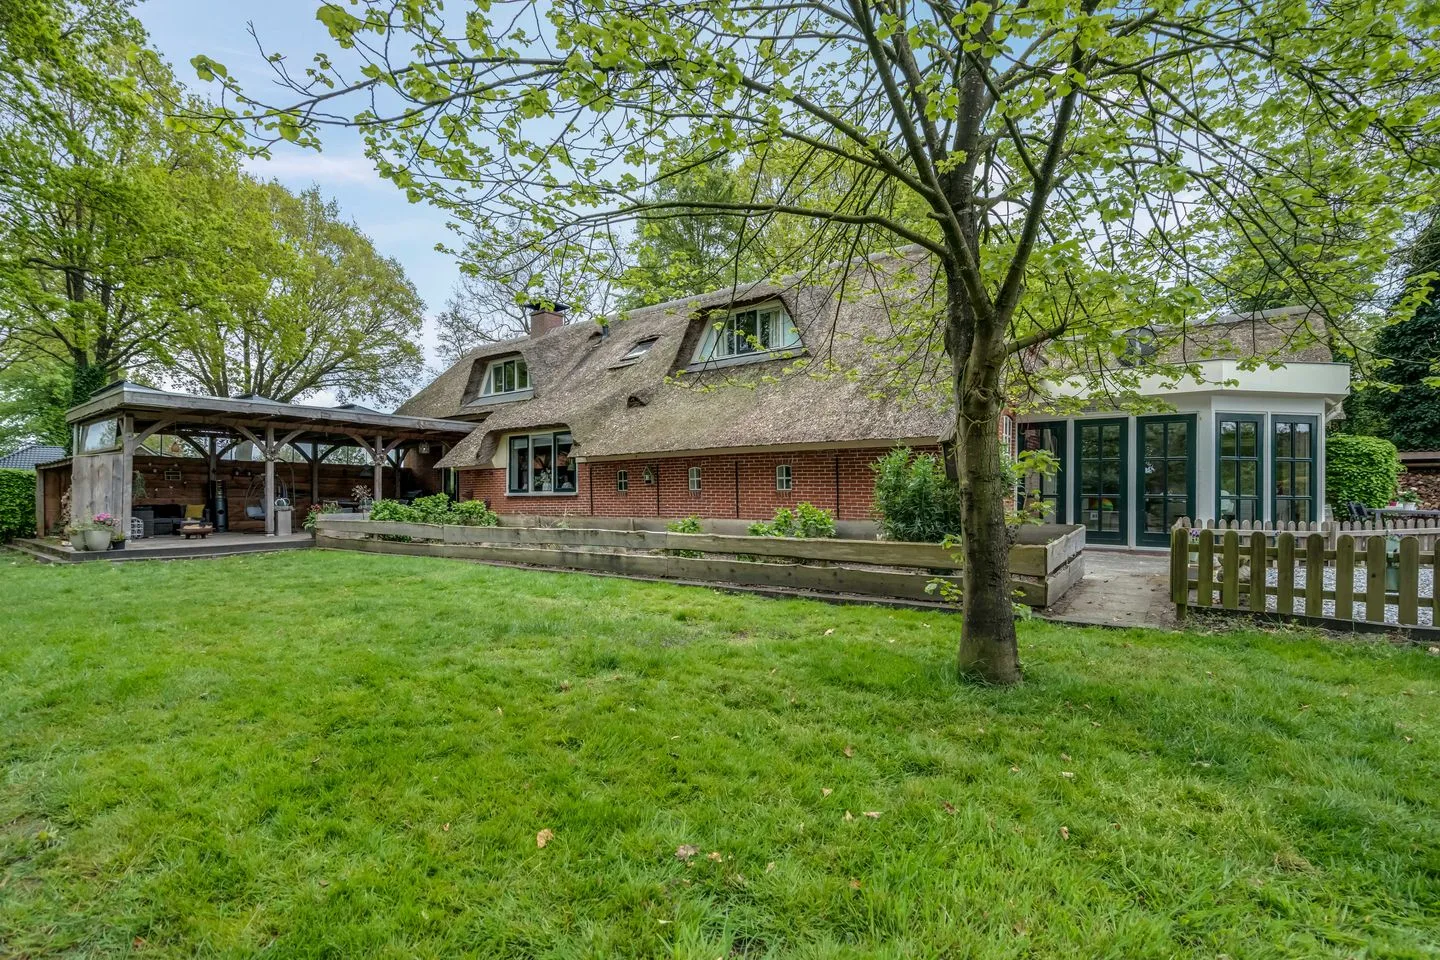
Oostindie 19
9354TD Zevenhuizen
€ 875.000 k.k.
€ 2.956/m²
CSave as favorite- Living area
- 296 m²
- Land area
- 2125 m²
- Bedrooms
- 7
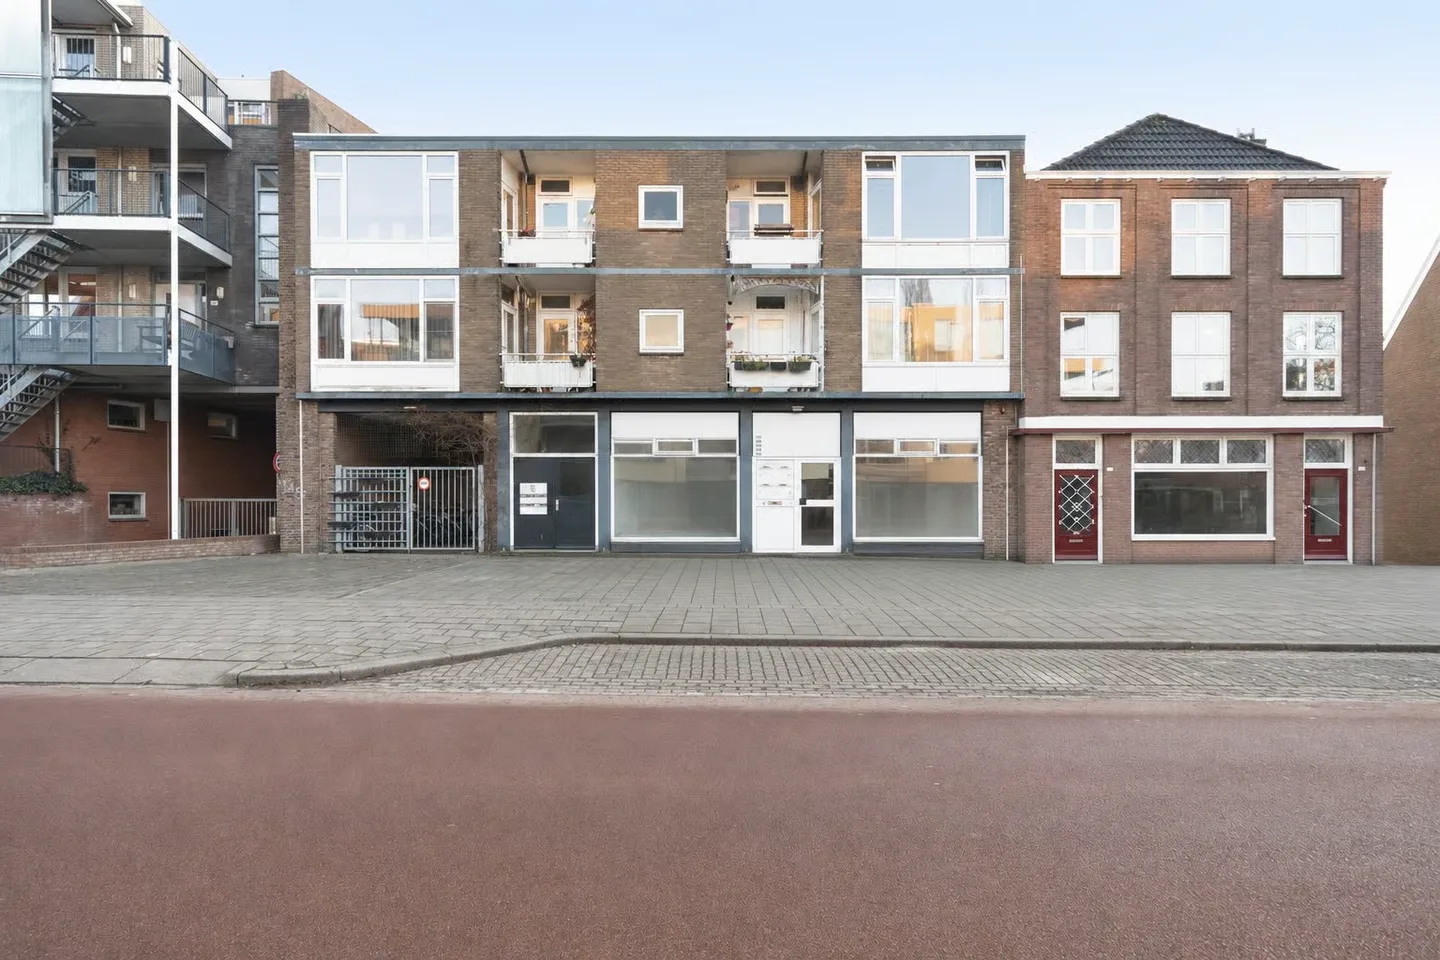
-
- Available
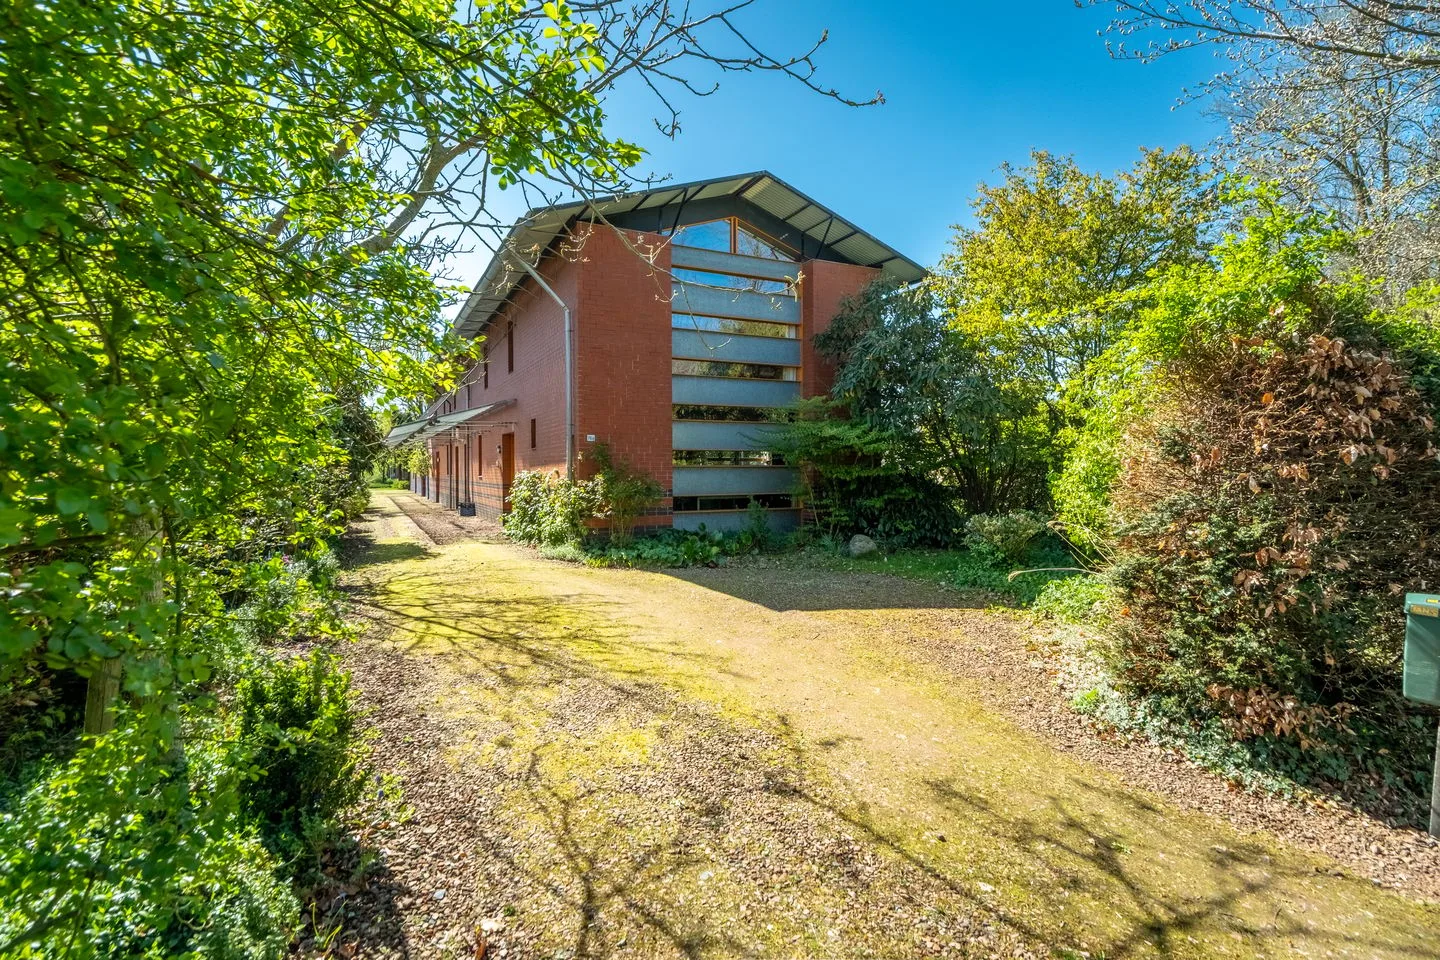
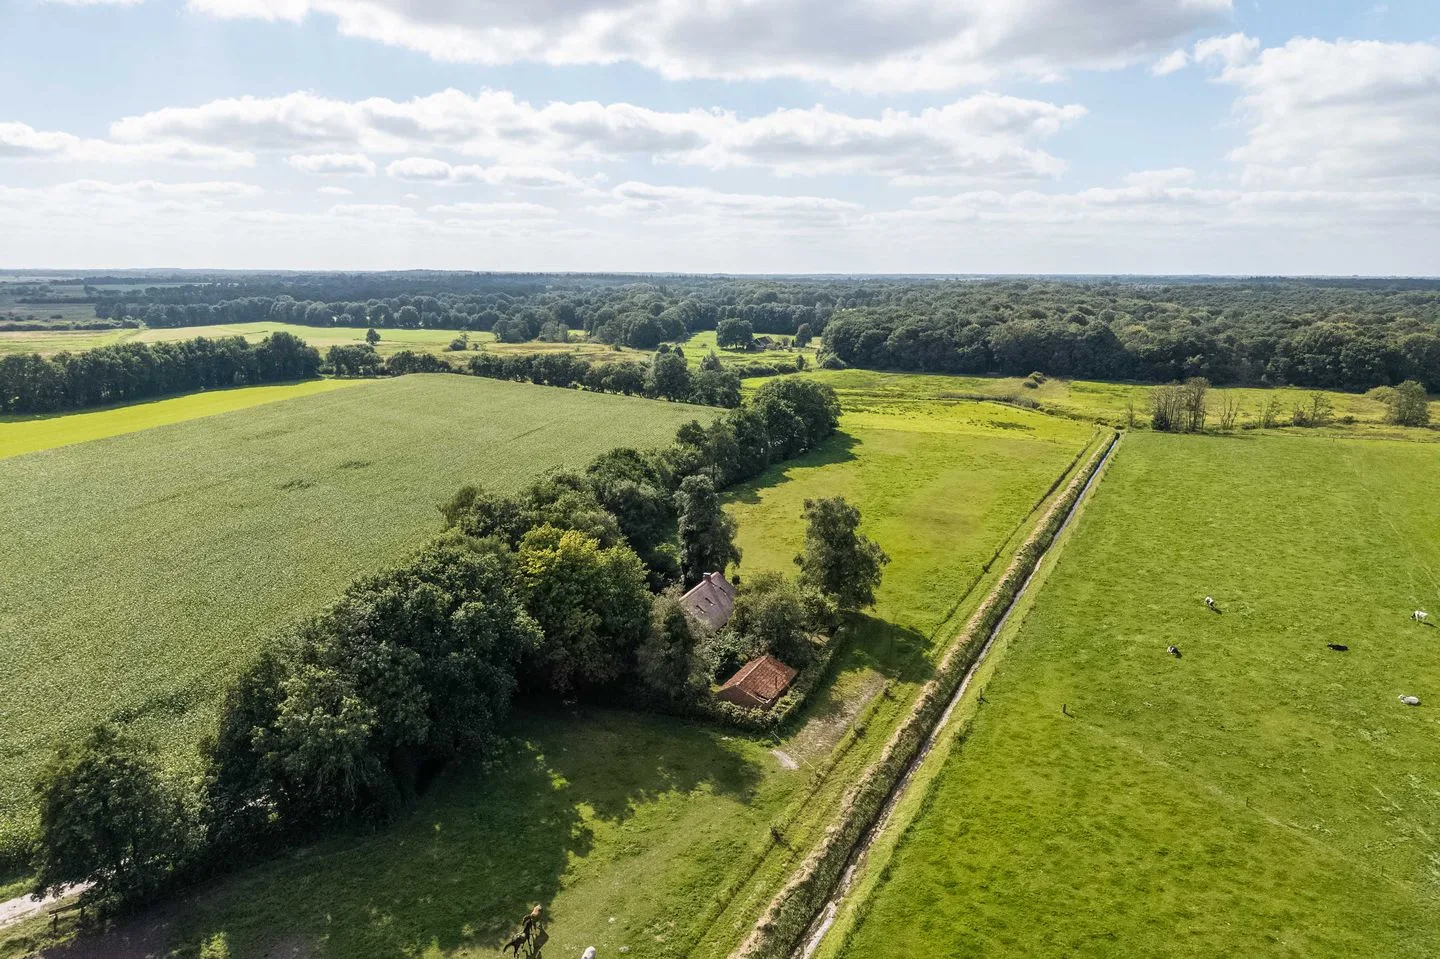
Zuidesch 5
9304TW Lieveren
€ 799.000 k.k.
€ 6.603/m²
CSave as favorite- Living area
- 121 m²
- Land area
- 1410 m²
- Bedrooms
- 2
-
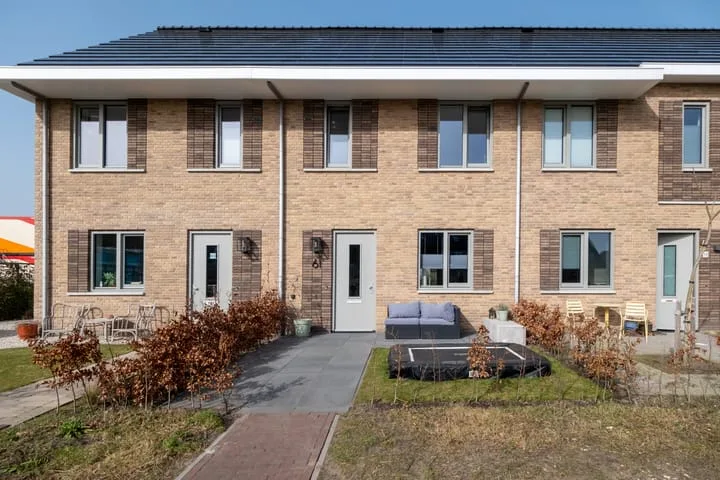
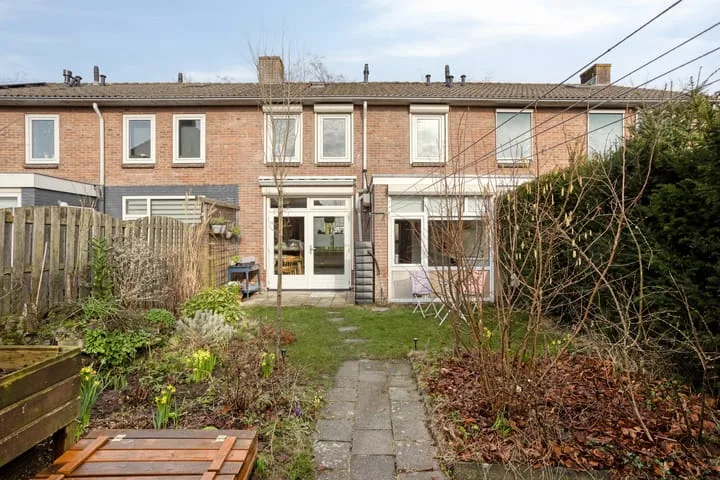
- Available
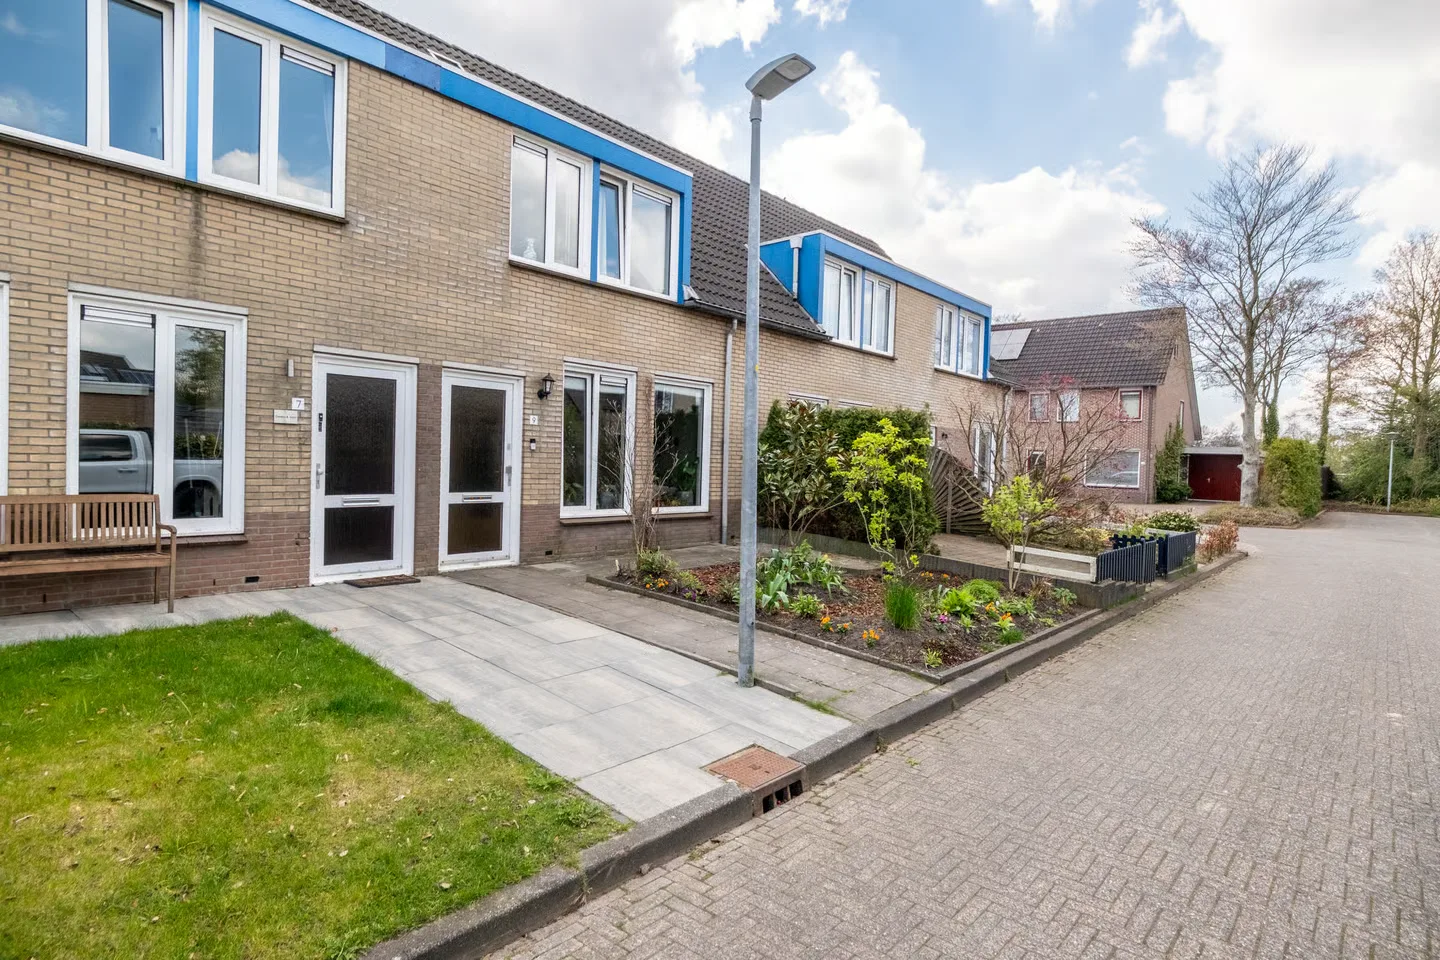
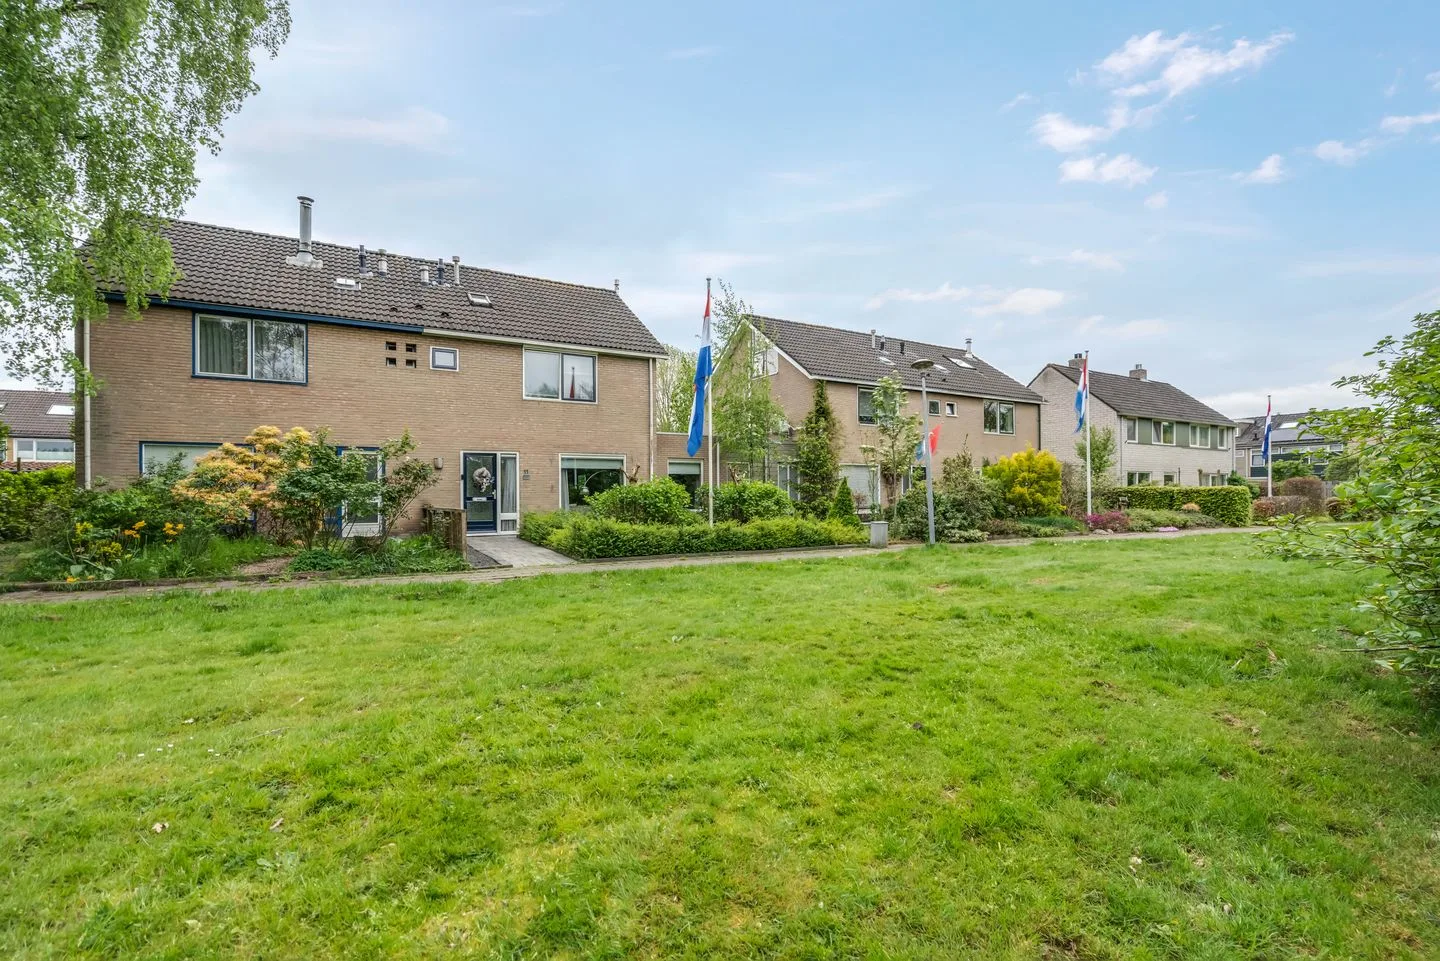
Slangenborg 11
9301VC Roden
€ 489.000 k.k.
€ 3.135/m²
BSave as favorite- Living area
- 156 m²
- Land area
- 282 m²
- Bedrooms
- 4
-
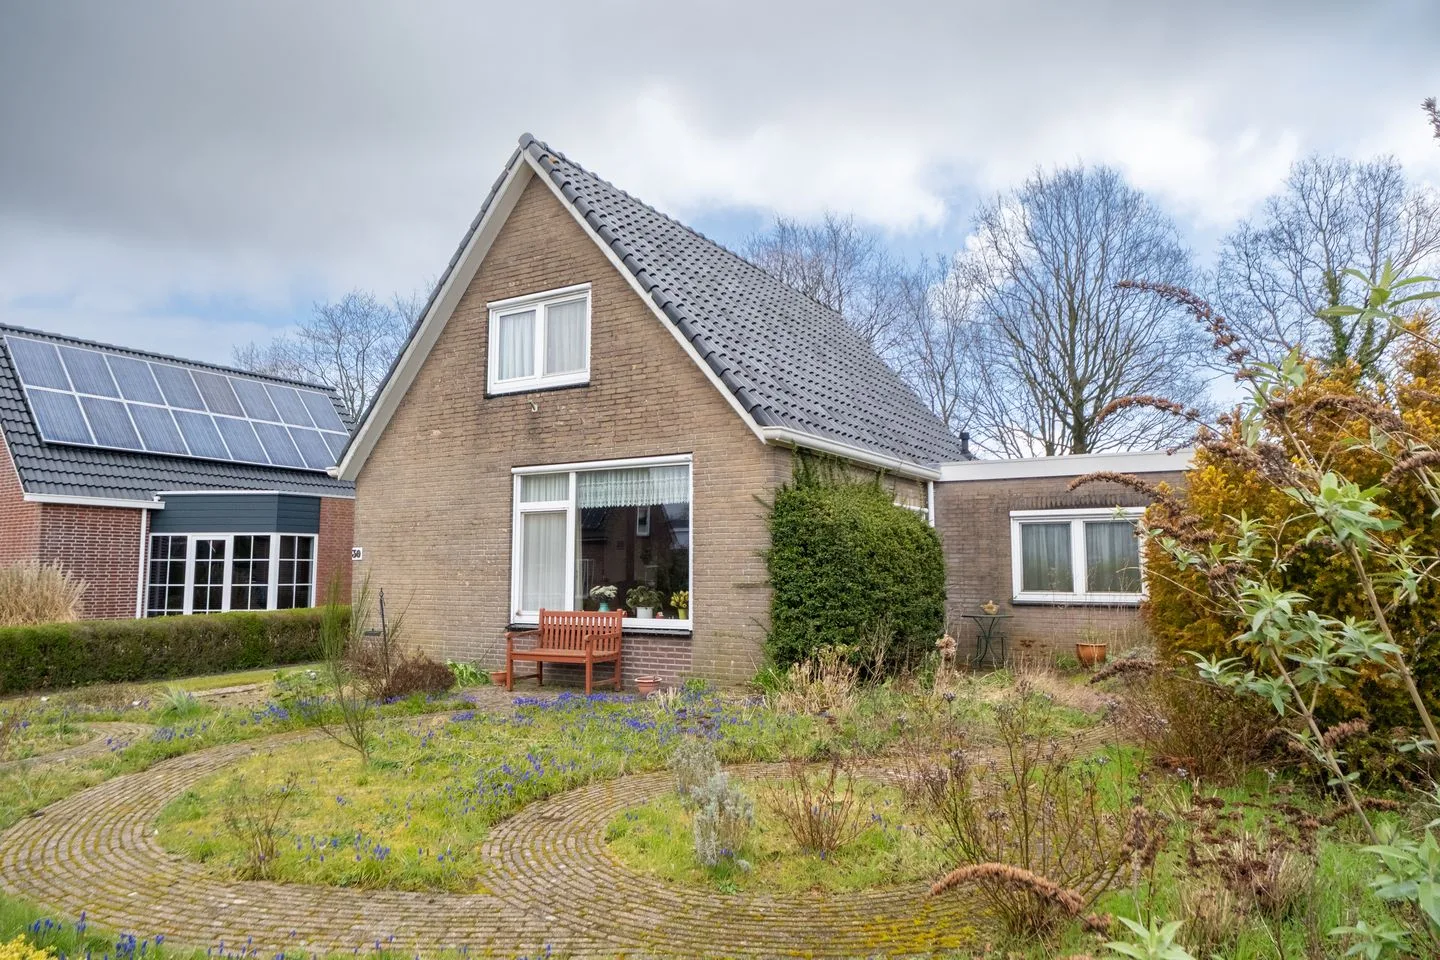
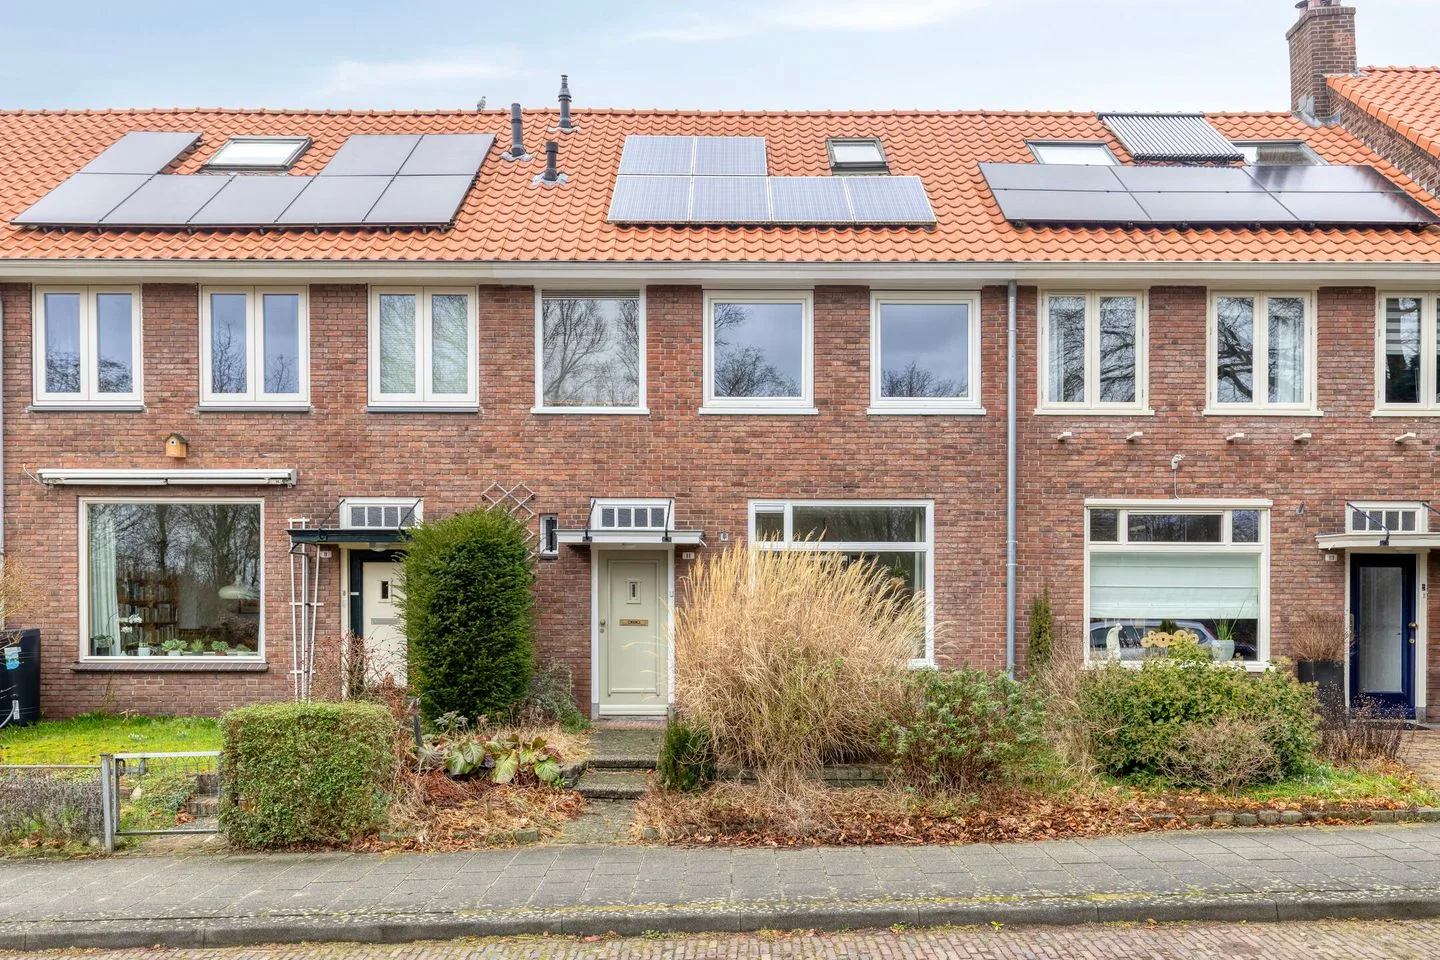
- Available
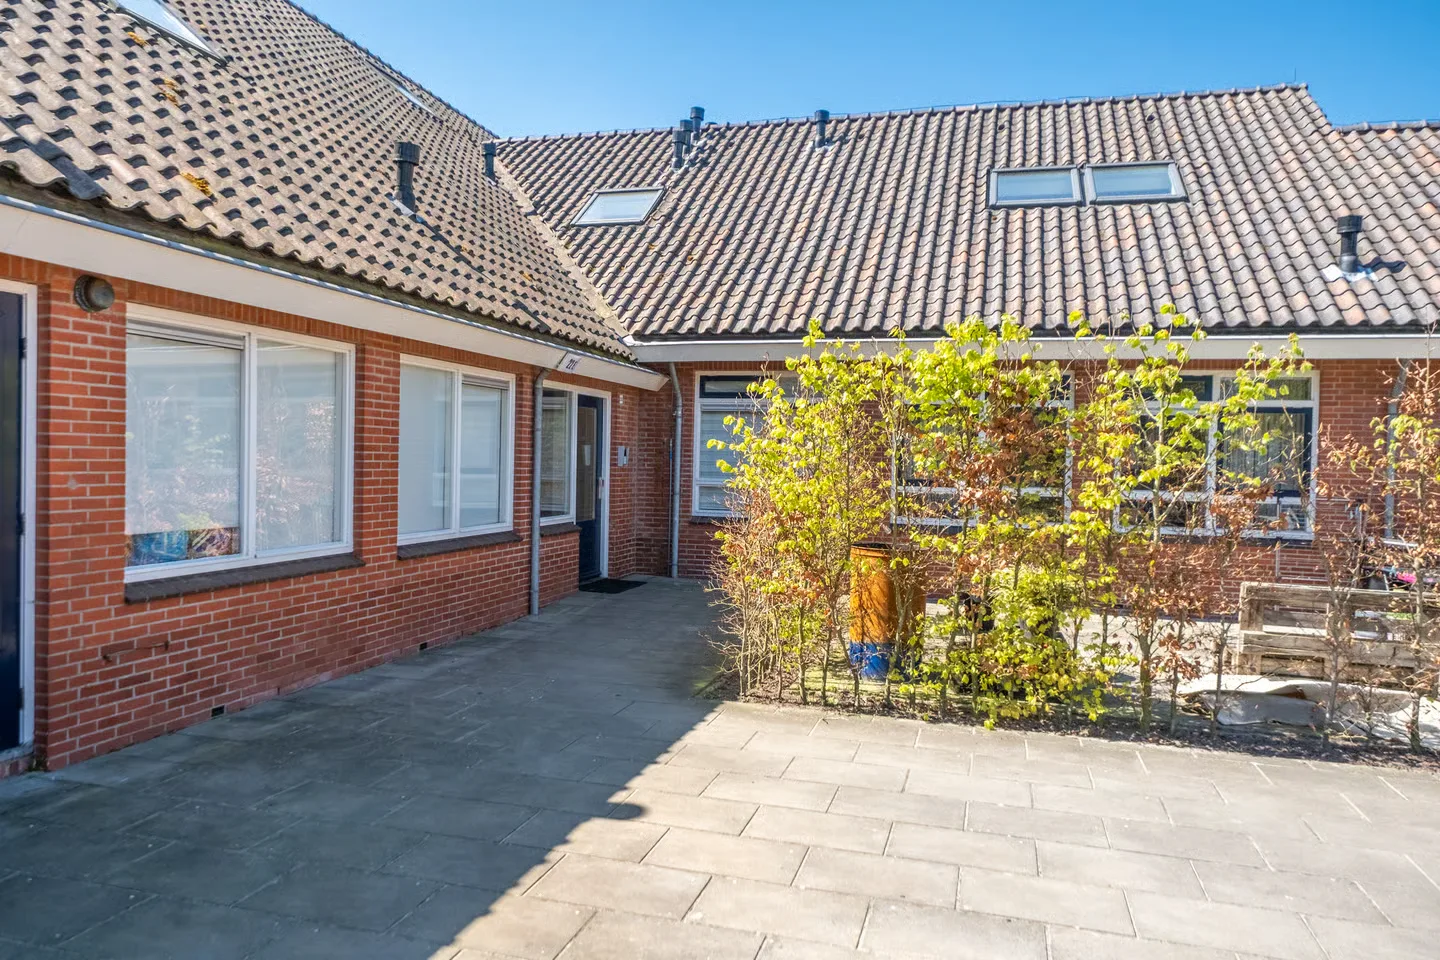
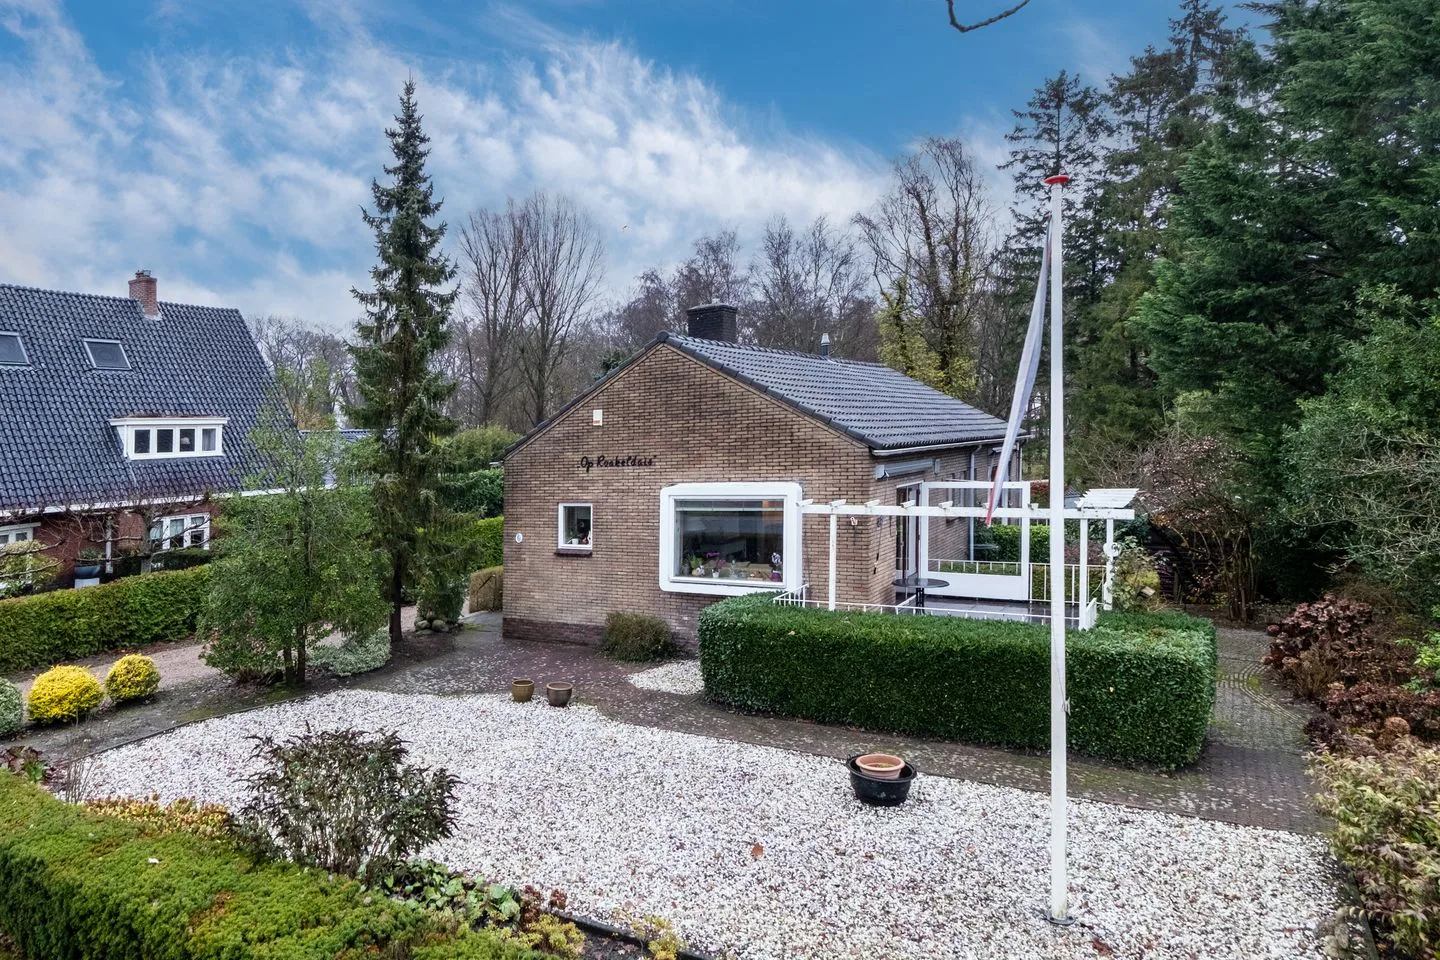
Hoofdstraat 32
9342PC Een
€ 475.000 k.k.
€ 3.831/m²
CSave as favorite- Living area
- 124 m²
- Land area
- 785 m²
- Bedrooms
- 2
-
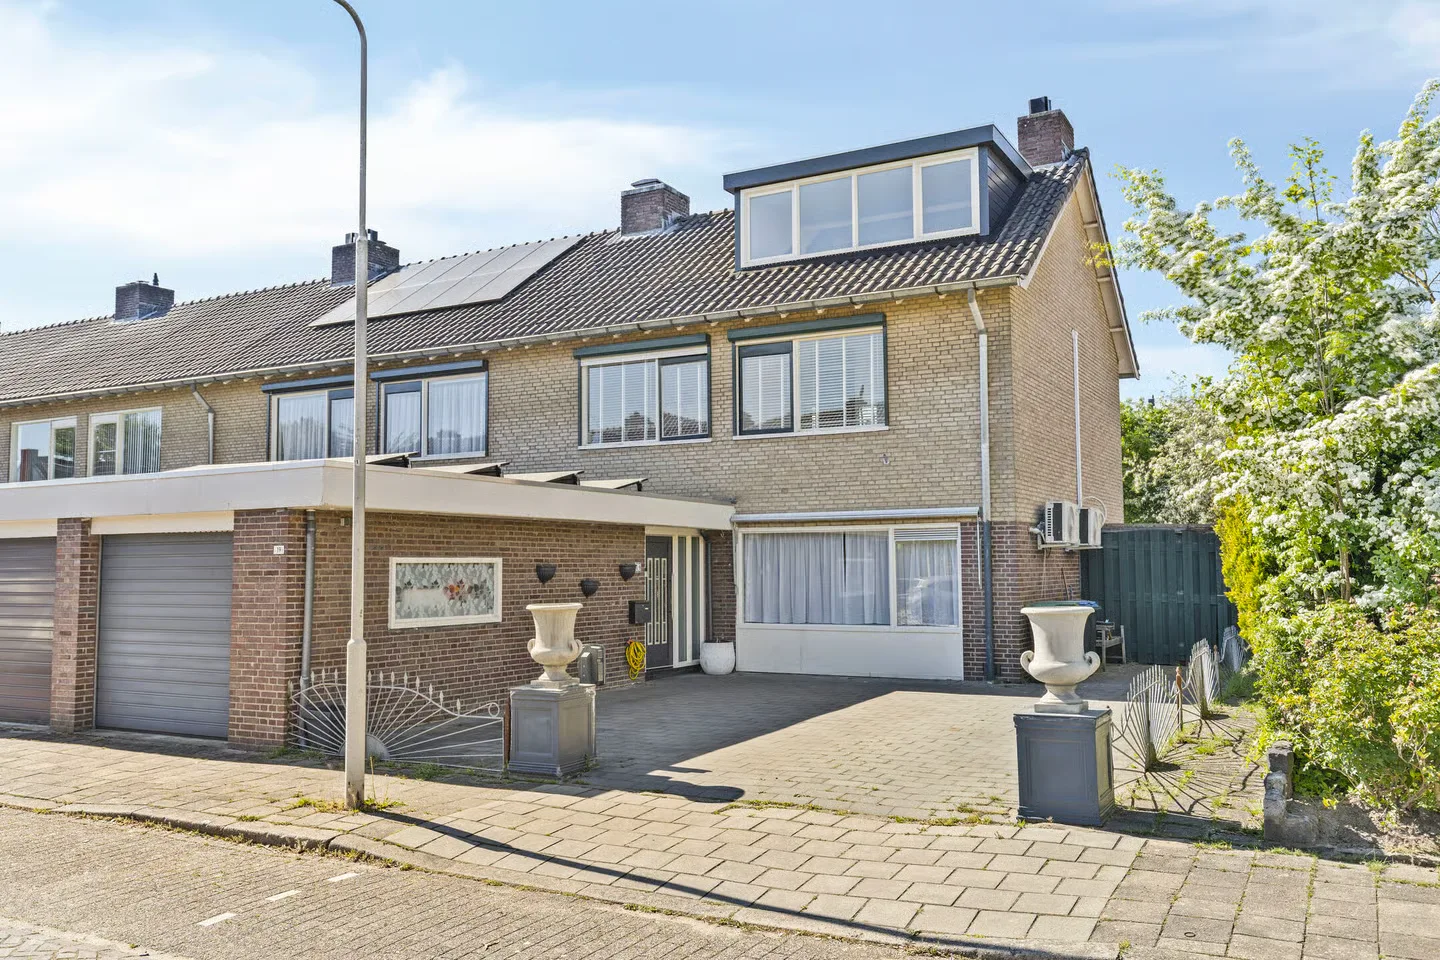
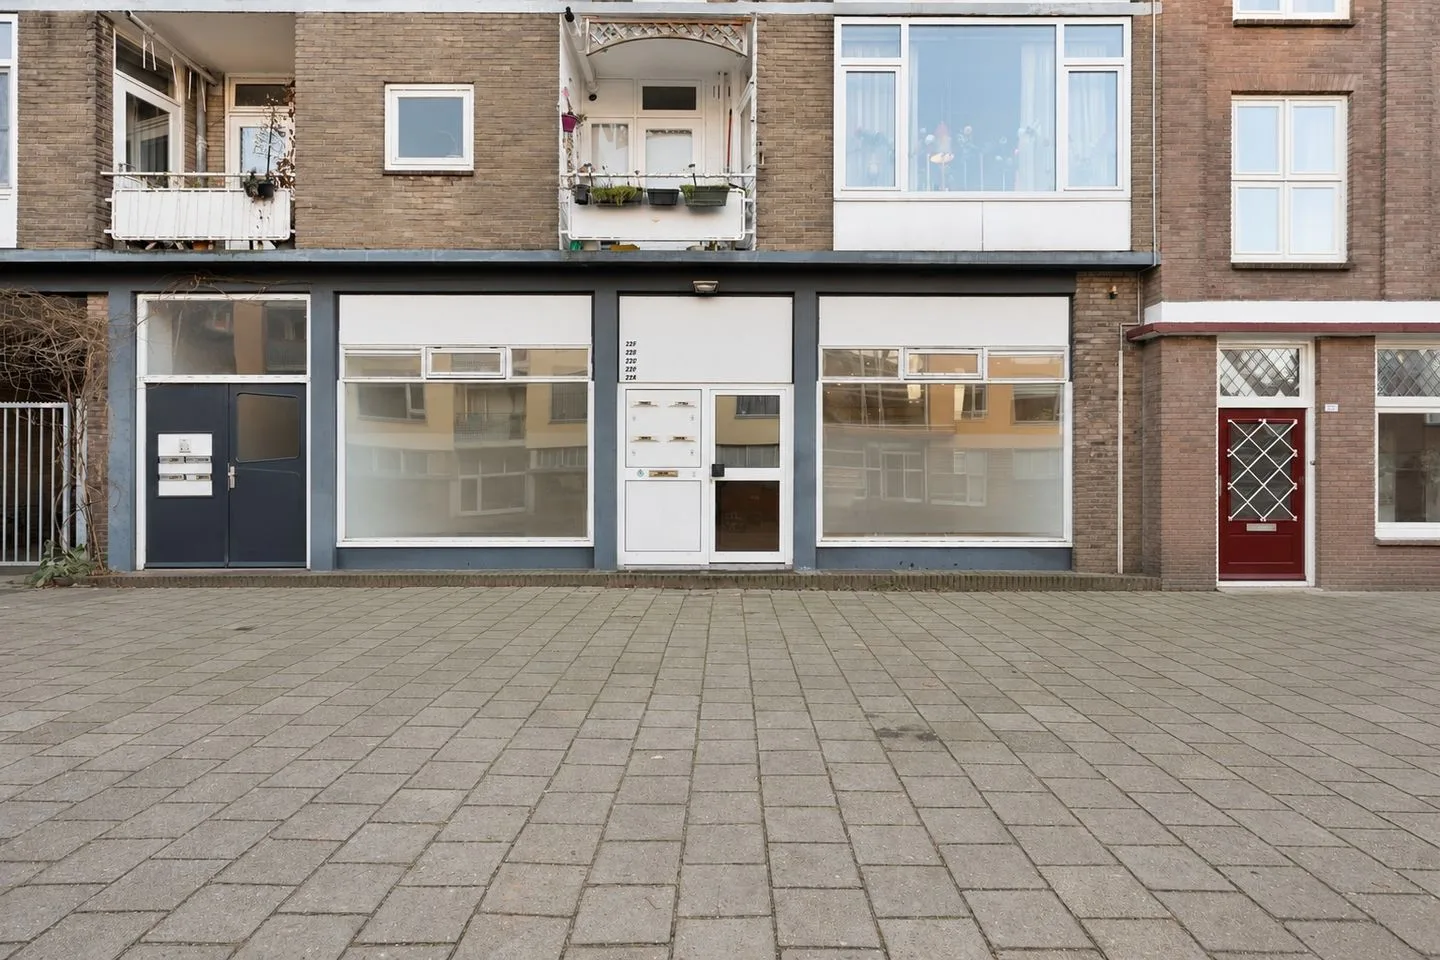
- Available
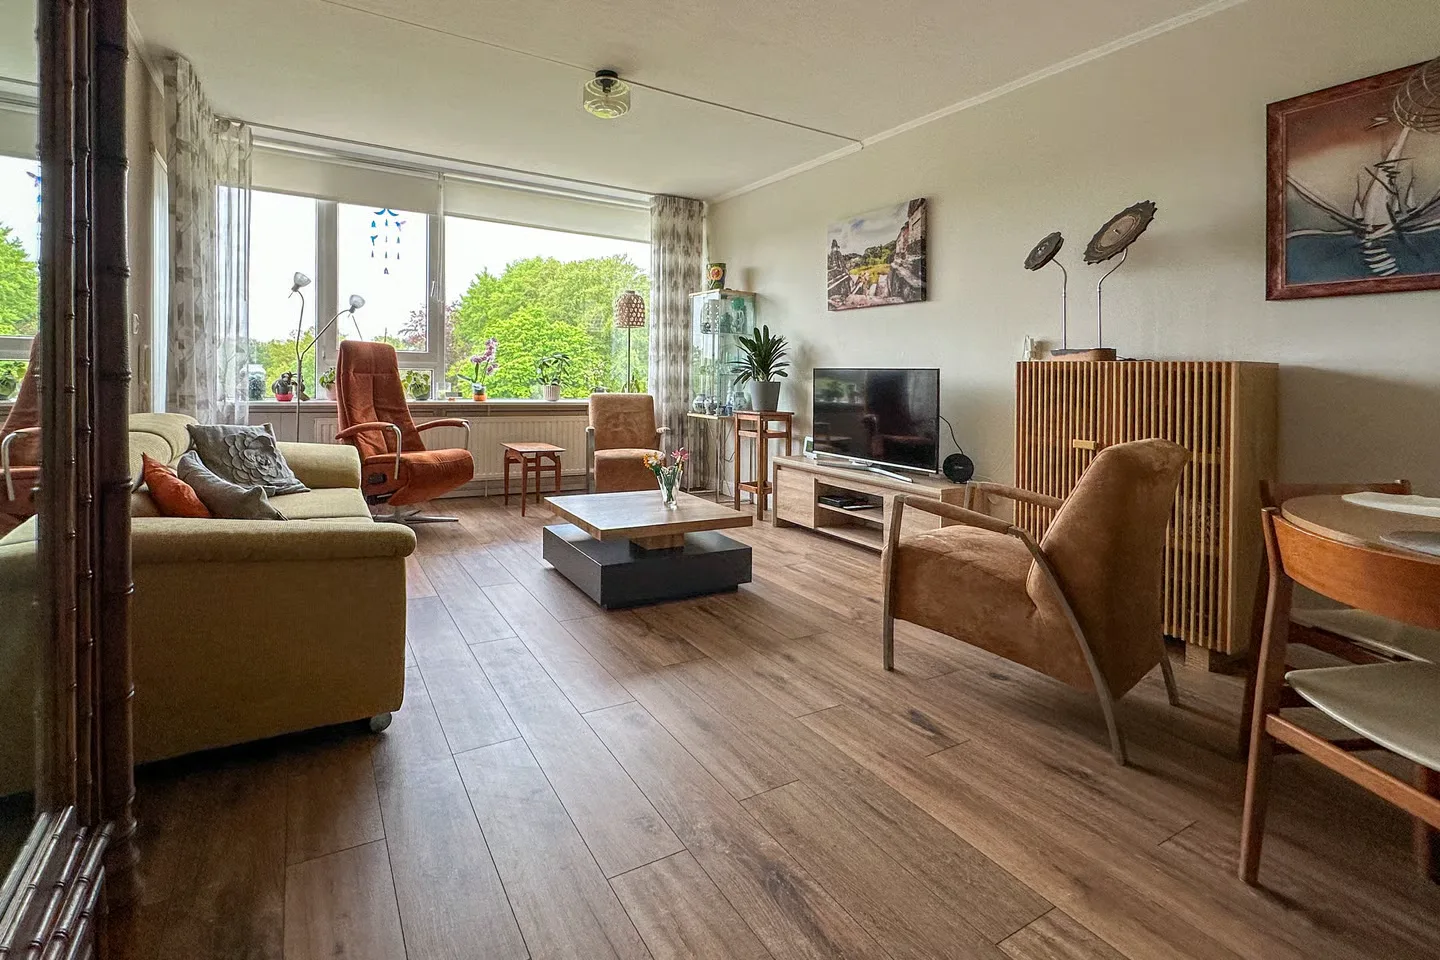
Nieuweweg 18
9301GR Roden
€ 525.000 k.k.
€ 4.268/m²
CSave as favorite- Living area
- 123 m²
- Land area
- 665 m²
- Bedrooms
- 4
Reviews (80)
Review platforms
BronscoresTotal score
80 total reviews

Funda
58 reviews on Funda

22 reviews on Google
-
Kastelenlaan 173
10We hebben de dienstverlening van Peter en team als zeer kundig en professioneel ervaren. Het heeft geleid tot een snel en geweldig verkoopresultaat, dikke prima!👍 Robert & Diana
-
Stefan Praamstra
10 -
Kanaalstraat 29 D
9Translated by AIGreat experience with my real estate agent! The communication was quick and clear, so I always knew where I stood. In addition, the knowledge really stood out; they thought along well and everything was handled professionally. That gave a lot of confidence during the entire process. Definitely a recommendation!
-
Stinsenweg 29
10Translated by AIClear and clear agreements made with the real estate agent and his staff. Good communication. In my opinion, very good and nice cooperation.
-
Roer 246
10Translated by AIPeter and his colleagues take full control and go all out for it. No nonsense, just action. Super.
-
Auwemalaan 1 3
10Translated by AIWe have experienced contact with Peter and his colleagues as very pleasant. Straightforward advice, short lines and clear communication. We would certainly recommend Peter's Real Estate Agency!
-
de Hulst 27
10Translated by AIOur home sold quickly. Communication with all staff at Peter's real estate agency was professional and smooth.
-
Ceintuurbaan Noord 17
8Translated by AIThe contact went smoothly. This real estate agent is highly recommended. Friendly and with questions you could quickly get to the right person.
-
Stobbenven 14
8Translated by AIThey had a good introduction conversation and they have taken good care of us. One point for improvement is that they gave the buyer access to the house without our permission and that's not the intention. Further, we can recommend this real estate agent.
-
Kerkstraat 5
10Translated by AIEverything went very smoothly nice photos Sold quickly have helped well when I did not know something very satisfied
-
Brink 3
9Translated by AIGood contact, quick processing. Top real estate agent. Fin to do business with this real estate agent. Nice sales real estate agent.
-
De Voorzoom 19
10Translated by AIVery good contact with the real estate agent. Gives good tips and is very knowledgeable. I can definitely recommend this real estate agent.
-
Gouwland 12
10Translated by AIThe contact with the real estate agent was very pleasant. From the first moment, the communication was clear, friendly and professional. We received quick answers to our questions and were well kept informed throughout the entire process. The real estate agent actively thought with us and gave expert advice, which gave us a lot of confidence. Thanks to the involvement and commitment we experienced the entire journey as very positive.
-
Kamille 31
9Translated by AIWent very well. Nice photos, quickly filling the agendas? All in all very satisfied. Will recommend them wholeheartedly.
-
Beek en Bosch 41
10Translated by AIClear and pleasant communication. The guidance of the apartment sale was experienced as very positive.
-
Jan Fabriciuslaan 11
10Translated by AIThe contact, consultation and advice have been very well received. With this information we have been very well assisted.
-
Zulthereschweg 45
10Translated by AIThe contact went very well! Peter is a really nice real estate agent. I will definitely recommend him as a real estate agent
-
Stinsenweg 78
10Translated by AIVery knowledgeable, professional and sober real estate agent. Very pleasant to work with, approachable and quick to respond. Clear in the working method and supports the selling party very well. Business-savvy and strategically smart.
-
den Dam 2
10Translated by AIPeter knows what he's talking about and is very knowledgeable. The contact with his colleagues is also very good.
-
Oosternielandsterweg 6
10Translated by AIMeaningful, expert, reliable, easily accessible, market-savvy, flexible, good negotiation results.