Makelaardij Kuilema

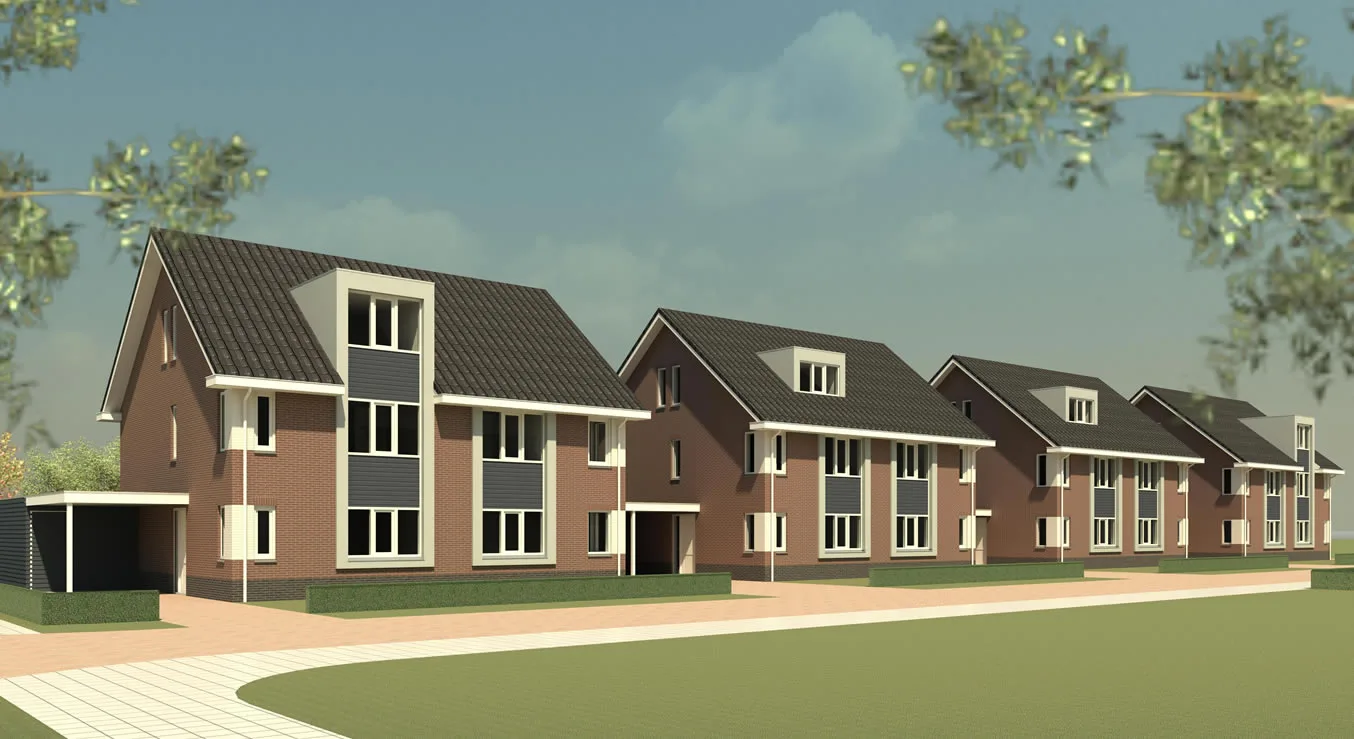
In Groningen, Makelaardij Kuilema offers reliable and personal real estate services. We combine knowledge of the region with a customer-oriented approach to help you with buying, selling or valuing your home. Our experience and passion for the profession ensure a calm, focused search or sales process. We provide service in the form of sales, purchases and valuations. Our approach is transparent and focused on your wishes, supported by r...
Current housing stock
-

- Available
Grevingaheerd 171
9737SK Groningen
€ 345.000 k.k.
€ 3.632/m²
ASave as favorite- Living area
- 95 m²
- Land area
- 139 m²
- Bedrooms
- 3
-

- Sold subject to confirmation
Rembrandtweg 40
9761HT Eelde
€ 395.000 k.k.
€ 2.883/m²
BSave as favorite- Living area
- 137 m²
- Land area
- 189 m²
- Bedrooms
- 4
-

- Purchased
van Houtenstraat 6
9801KJ Zuidhorn
€ 399.000 k.k.
€ 2.433/m²
BSave as favorite- Living area
- 164 m²
- Land area
- 301 m²
- Bedrooms
- 5
-

- Purchased
Dierenriemstraat 79
9742AB Groningen
€ 239.000 k.k.
€ 3.186/m²
CSave as favorite- Living area
- 75 m²
- Land area
- —
- Bedrooms
- 2
-

- Purchased
Siersteenlaan 367 e
9743ER Groningen
€ 309.000 k.k.
€ 4.753/m²
ASave as favorite- Living area
- 65 m²
- Land area
- —
- Bedrooms
- 2
-

- Sold
Siersteenlaan 468 23
9743ES Groningen
€ 325.000 k.k.
€ 3.316/m²
ASave as favorite- Living area
- 98 m²
- Land area
- —
- Bedrooms
- 2
Reviews (12)
Review platforms
BronscoresTotal score
12 total reviews

12 reviews on Google
-
José Grabiel Luis Cordova
10Translated by AIWe are extremely happy that we found Michael and Natasja. They helped us with a lot of patience and dedication in finding the perfect house, and the communication was excellent throughout the entire process. Their high level of expertise, combined with a friendly and personal approach, made our search for our future home a real success story. We are very satisfied and wholeheartedly recommend Makelaardij Kuilema to anyone considering buying a new house.
-
Richa Pandey
10Translated by AII am extremely grateful to Kuilemma Makelaars for their help in finding my house in Groningen. The entire team was friendly, patient and highly professional. They took the time to understand my wishes and supported me at every step, making what could have been a stressful process smooth and manageable. Their expertise, clear communication and personal attention really made the difference. I wholeheartedly recommend them to anyone looking for a reliable and honest real estate agent in Groningen. Thank you very much for everything!
-
Richard Jaeggi
10Translated by AIGood and clear communication with the real estate agent. The house was sold quickly and for a good price. The real estate agent was well-informed about the housing market and property prices in our area. We were and are satisfied.
-
Erik Bouman
10Translated by AISo far twice we have received the good service from Michael of real estate agency Kuilema. The first time when purchasing, we already noticed the personal approach and good care and reliable handling. The second time we had him as a sales agent and again we could leave everything to him, from A to Z everything was arranged and until the end we were very satisfied with both the business as well as the personal approach! Absolute recommendation!
-
Anneke Wolters
10Translated by AIWe are incredibly pleased with the help of Real Estate Agent Kuilema, in the purchase of our apartment. They thought along with us, gave helpful tips and arranged everything quickly and smoothly. Thanks to real estate agent Kuilema, we found exactly what suits us! In short: professional, friendly and involved. Highly recommended!
-
Daniël Verkade
10Translated by AITop realtor! I bought my apartment in Groningen with Michael and sold it again 4 years later. Both the purchase and sale went perfectly! During the purchase, Michael prevented me from making mistakes and fully earned his fee. During the sale, we maintained very short lines of communication and Michael guided me from A to Z. I say; buying/selling a house in the Groningen region = call Michael!
-
Jeroen Oostmeijer
10Translated by AIA top realtor who really knows what he's talking about. The contact was pleasant and personal from the beginning. He truly gives you the feeling that your interest is his interest. But he also doesn't lose sight of the interests of all parties involved, both when buying and selling, being treated fairly and informed by him. He finds it important to really promote his profession. That’s why he also teaches real estate in addition to practicing as a realtor – this says a lot about his character, in my opinion. He enjoys negotiating as long as it's fair and according to the rules of the game. Would I recommend him to others? The answer to this can only be a resounding yes. If you’re looking for a good realtor, look no further.
-
corien hakvoort
10Translated by AIVery happy with the collaboration with real estate agency Kuilema! In a sometimes difficult search, I am very pleased with how honest and well you helped us! It's nice that we are personally looked at what is best! Thanks for the pleasant contact and your help!!!!
-
Leo Hakvoort
10Translated by AIWe were fantastically helped by Mr. Kuilema. We have viewed many apartments. Mr. Kuilema always gave good and healthy advice on whether or not to choose the apartment. For example, location in the neighborhood, condition of the apartment, any additional costs for later. Also regarding the different bids we made, they were all done in good consultation without losing your common sense. Mr. Kuilema has always looked from our (customer) perspective. He never pushed anything on us. Despite it being a previously agreed amount. He helped us top-notch. And didn't quickly talk us into something to earn his money that way. So, in short. Top purchasing agent.
-
Tristan Lambert
10Translated by AIYou are in good hands with this broker from the first introduction to after, in our case, the purchase of a home. A warm, professional and knowledgeable approach. Quick communication, doing more than strictly necessary and keeping all promises: recommended!
-
Susan S
10 -
G.R. Jongbloed
10