StinseMaat makelaardij

StinseMaat Real Estate stands for reliable and detailed service in the real estate industry. With a solid business knowledge, an extensive network and experience in the local market, we ensure a personal approach that puts your wishes at the center. Our experience and knowledge of the region make us a reliable partner when selling, buying or valuing your home. We combine years of experience with an informal working atmosphere to guide y...
Current housing stock
-

- Available
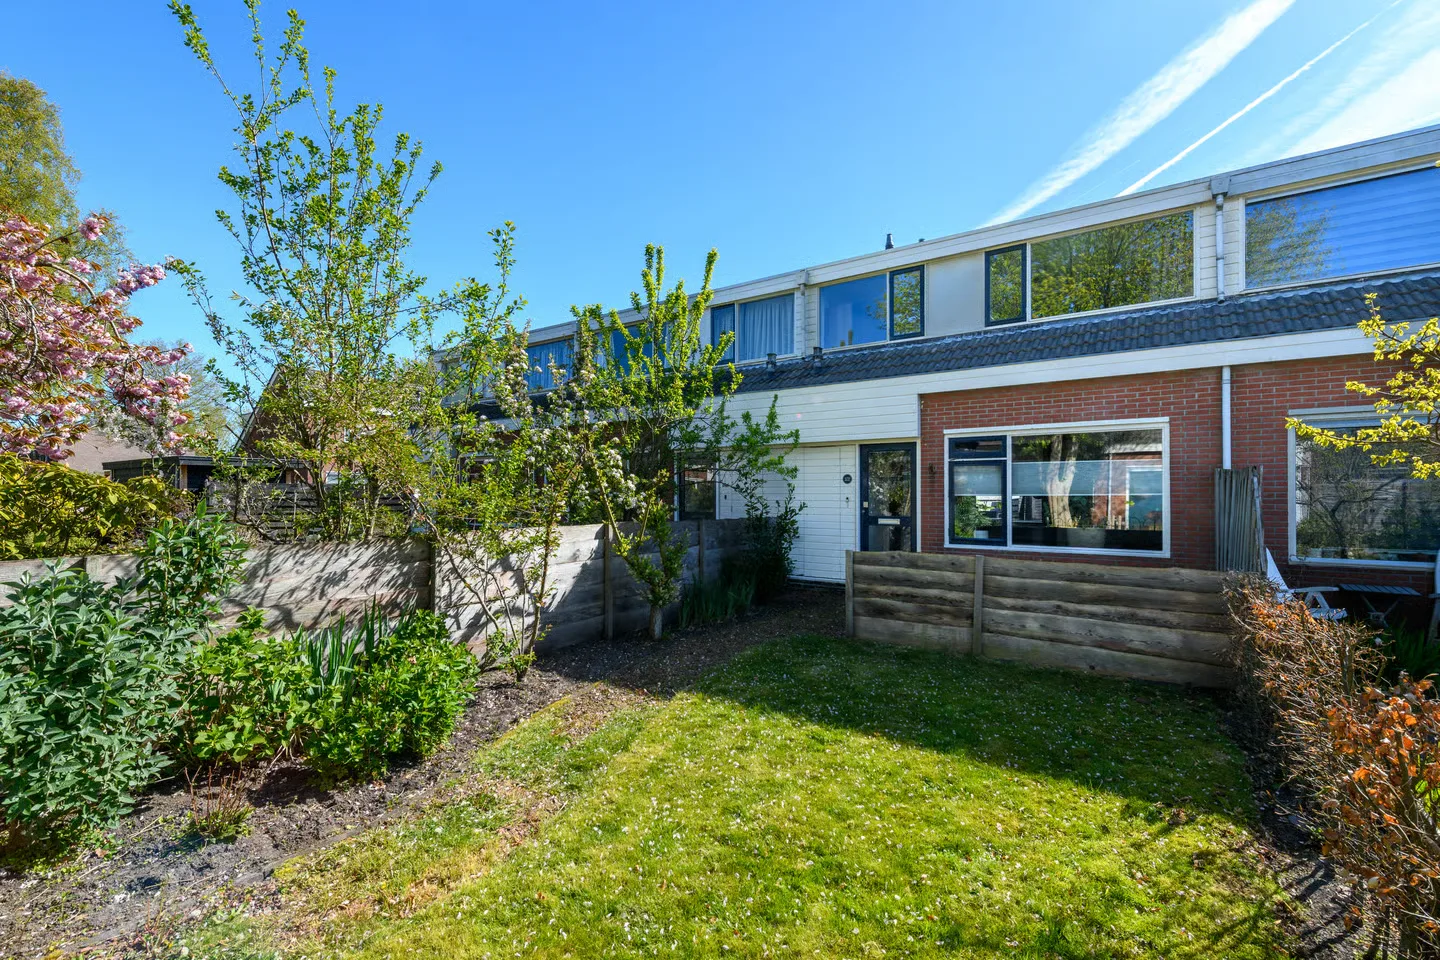
De Finne 17
8404GR Langezwaag
€ 275.000 k.k.
CSave as favorite- Living area
- 113 m²
- Land area
- 175 m²
- Bedrooms
- 4
-

- Available
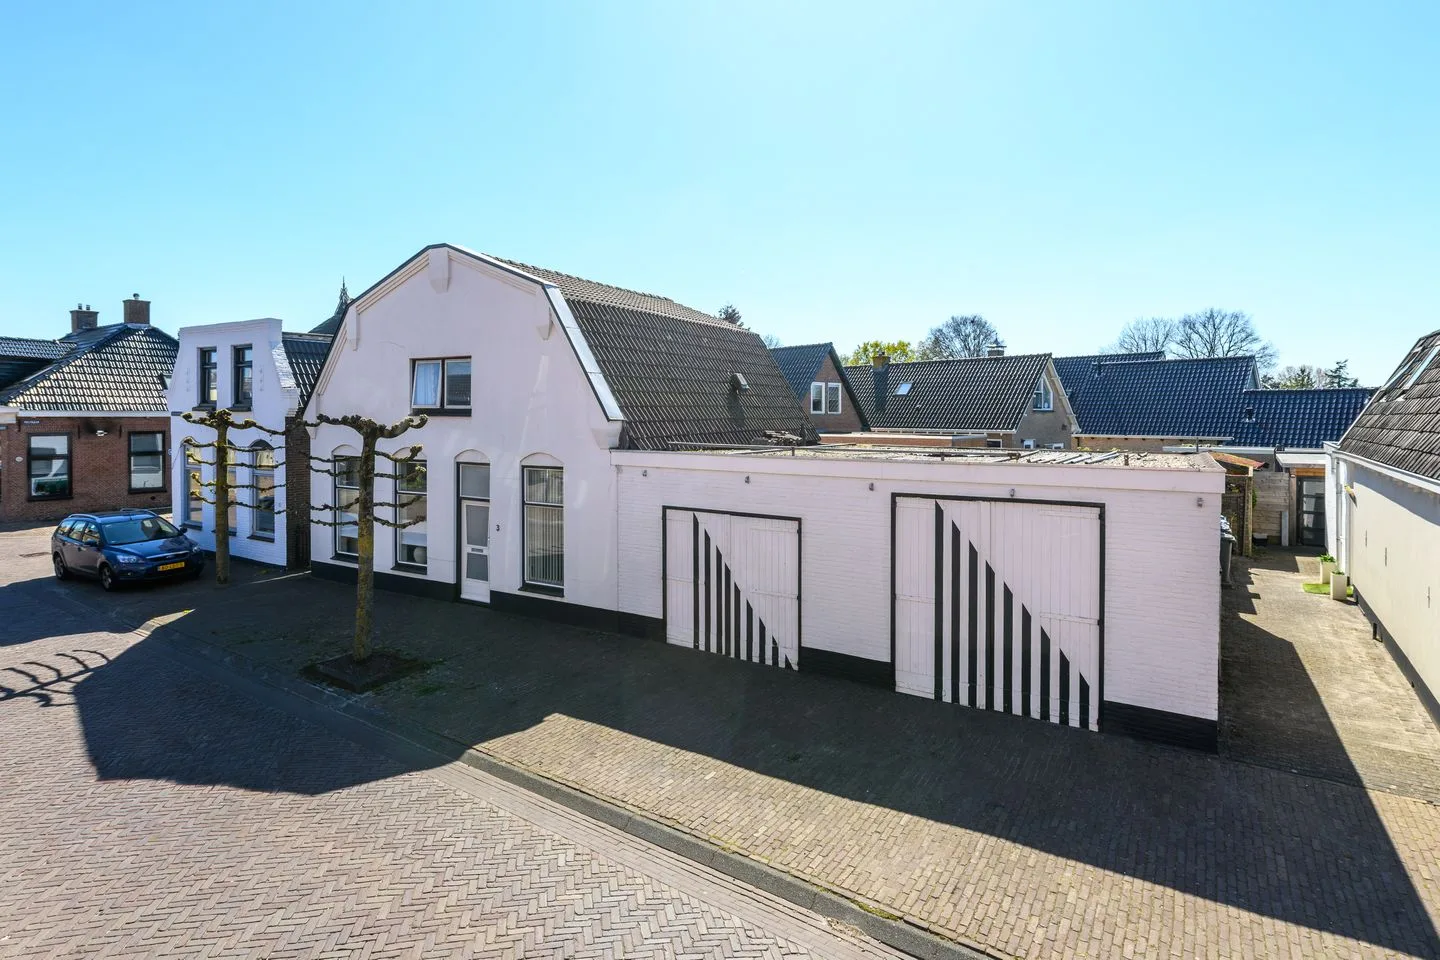
Prof dr Cleveringastraat 13
8442LN Heerenveen
€ 589.000 k.k.
ASave as favorite- Living area
- 157 m²
- Land area
- 350 m²
- Bedrooms
- 4
-

- Available
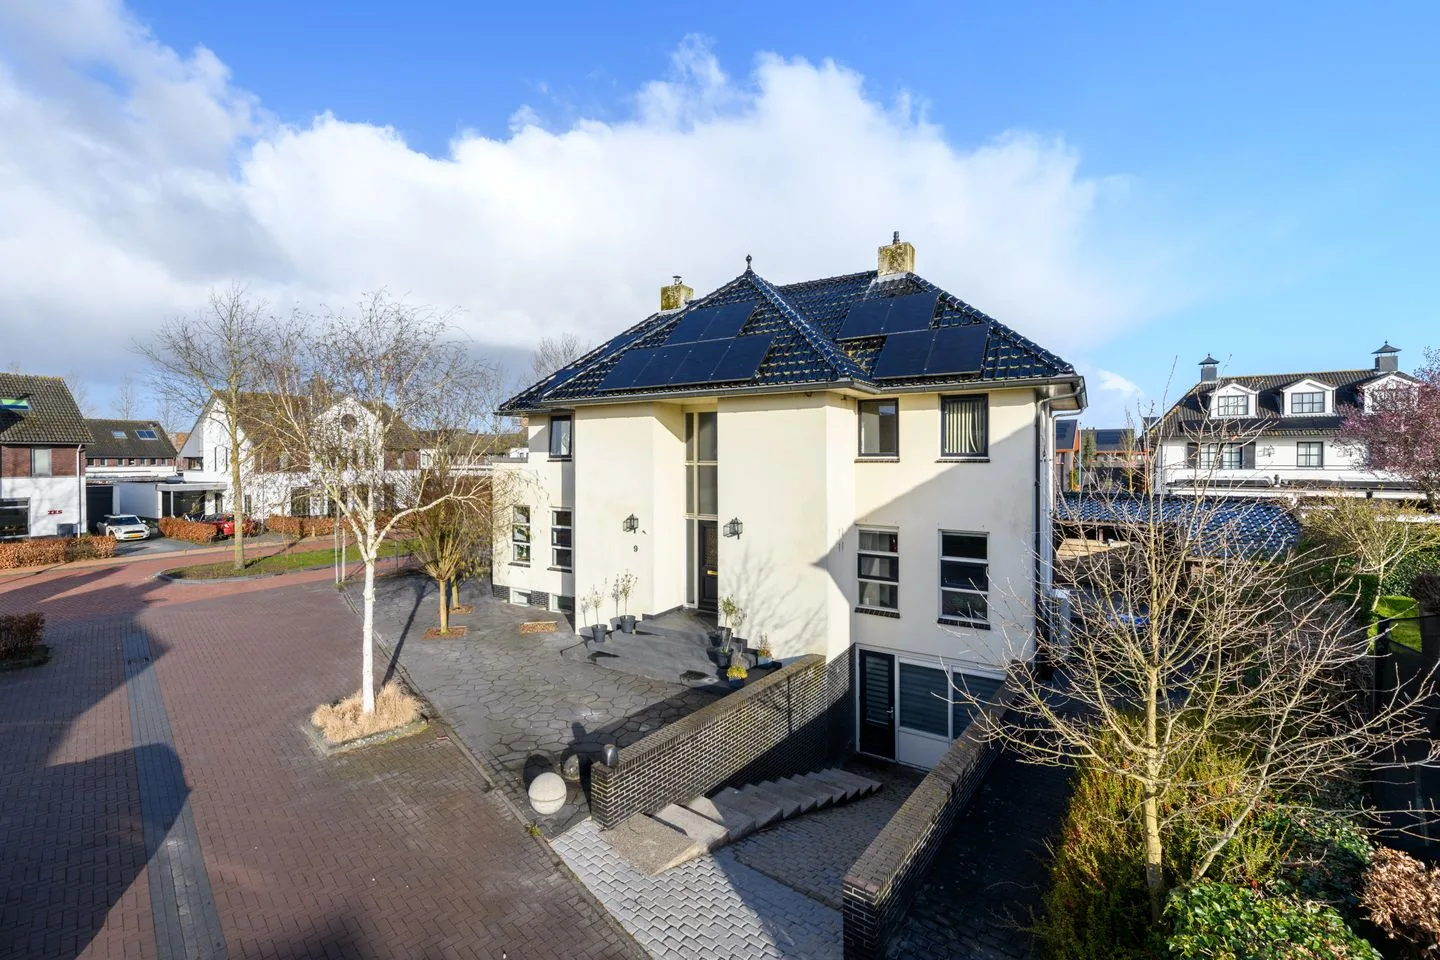
Burgemeester Falkenaweg 106
8442LJ Heerenveen
€ 550.000 k.k.
ASave as favorite- Living area
- 150 m²
- Land area
- 516 m²
- Bedrooms
- 4
-

- Available
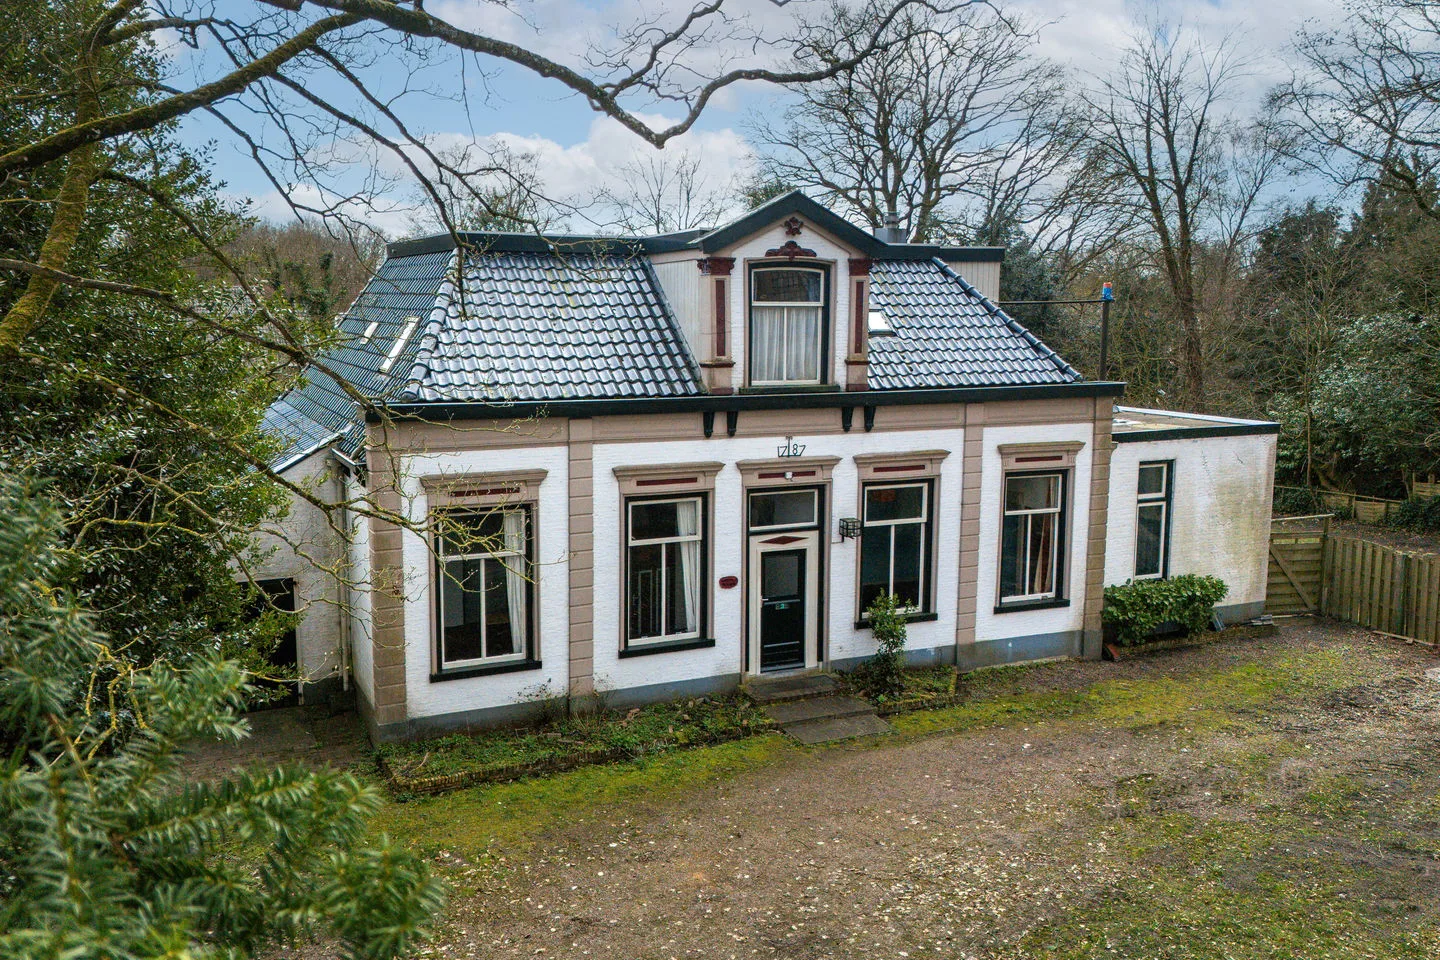
Schoterlandseweg 45 E
8451KA Oudeschoot
€ 739.000 k.k.
BSave as favorite- Living area
- 242 m²
- Land area
- 555 m²
- Bedrooms
- 5
-

- Available
Azaleastraat 16
8441DN Heerenveen
€ 349.000 k.k.
€ 3.356/m²
ESave as favorite- Living area
- 104 m²
- Land area
- 313 m²
- Bedrooms
- 3
-

- Available
Wiidswâl 23
8465PS Oudehaske
€ 645.000 k.k.
€ 3.193/m²
BSave as favorite- Living area
- 202 m²
- Land area
- 904 m²
- Bedrooms
- 4
Reviews (33)
Review platforms
BronscoresTotal score
33 total reviews

Funda
19 reviews on Funda

14 reviews on Google
-
Lijsterbeslaan 1
8Translated by AIWell and pleasant run from start to finish. Both when buying and when selling your own home
-
Regenboog 24
10Translated by AIWe bought a house that was for sale at Stinsemaat. Because of the professional and honest approach of Kees Wondergem during this purchase process, we decided to also sell our own home through Stinsemaat. We have absolutely no regrets about this, Kees has helped us excellently with the sale and achieved a very good sales result. He kept us informed throughout the selling process about the progress. In addition, he quickly and adequately answered all our questions...
-
Skâns 6
10Translated by AIEverything went perfectly. In communication, it could have been a bit faster from time to time, but that will undoubtedly be due to the busyness. This had no further influence on the sales.
-
Ereprijs 6
10Translated by AIStinsemaat has met al onze verwachtingen. Het contact en de adviezen hebben wij als zeer prettig ervaren.
-
Akkersplein 52
10Translated by AIAfter my girlfriend and I bought a house that Stinse Maat had for sale, I also gave them the task of selling my house. Kees has accompanied us excellently here and the communication was also very good here. So I will definitely recommend Stinse Maat in my own circle.
-
Deel 8
9Translated by AIListens well and thinks along. Keeps in regular contact to provide updates. Is very involved in the entire process and explains things well.
-
Tjotter 15
10Translated by AIWe are very satisfied with the help we received during our housing search and purchase via Stinsemaat Real Estate. Kees is very knowledgeable, reliable, persistent and knows exactly what would suit us. We therefore wholeheartedly recommend Kees to everyone looking for a home in Heerenveen.
-
Herenwal 155
9Translated by AIKees Wondergem of StintseMaat has excellently guided and advised us. We have gladly used his advice and services! In short: Excellent real estate agent!
-
Herenhof 6
9Translated by AIExcellent contact, clear agreements, honest opinion. For me this is the fourth time I have bought and sold with this real estate agent.
-
Hotze de Roosstrjitte 18
10Translated by AIKees van Stinsemaat real estate sold our house. From beginning to end I was guided through this process and many things were taken out of my hands. I was involved in the entire process. Kees is clear and concise in his communication. Appointments are all kept well and feedback is provided. Kees involved me in the process through good information provision, removed the 'feeling of stress' from me so that the sales process was not unpleasant or a 'burden'. Kees has…
-
Troubadour 2
10Translated by AIContact with the real estate agent went well. It was clearly explained beforehand which sales strategies there are and the most suitable strategy was chosen. Good advice was received in this regard. Well guided from beginning to end with advice for the sale. The property sold to our satisfaction.
-
Kattebos 160
8Translated by AIEverything went exactly as wished! I can recommend everyone Kees Wondergem from Stinsemaat. We were kept informed everywhere and everything was done in consultation.
-
Tormentil 67
10Translated by AIWe experienced contact with the real estate agent as pleasant. Communication flowed smoothly in both directions. Mr. Wondergem is very experienced, empathetic and has a good judgment. He is usually accessible and goes all out for his clients. We would always recommend this real estate agent. Residents Tormentil 67.
-
Jelmersmeer 9
10Translated by AIVery satisfied with the service of Kees Stinsemaat! A real estate agent who responds quickly, has excellent knowledge of the market and always communicates clearly and honestly. The entire process went smoothly and professionally. Highly recommended for anyone looking for a reliable and skilled real estate agent!
-
Nienke van Hichtumweg 69
10Translated by AIVery pleasant real estate agency. Easily accessible and always positive, friendly and above all honest. Kees has a lot of knowledge of the market and helped and advised us in the right way when determining the strategy. We also greatly appreciated and experienced the helpfulness from the office by Denise as very pleasant. A major plus point of StinseMaat was the communication. We were kept informed about everything and, where necessary, new consultations were held. We would…
-
Yme Kuiperweg 54
10Translated by AINice, knowledgeable realtor. Pleasant communication, kept us well informed and guided us through the entire process.
-
Lepeltjesheide 8
9Translated by AIWe recently sold our house through StinseMaat and are incredibly satisfied with the entire experience. From the first conversation, the communication was clear, friendly, and professional. The real estate agent took the time to understand our wishes and expectations and kept us continuously informed throughout the entire process. What particularly impressed us was how smoothly everything went. Every detail was well coordinated, from the initial viewing to the completion of the sale. We have no mom...
-
Bolster 26
9Translated by AIGood alignment on the timeline and the planning that results from it ensures that things can be done quickly and without duplication.
-
Aengwirderweg 260
9Translated by AIWe definitely recommend StinseMaat Real Estate! The contact went very well due to the short lines and clear and pleasant communication. The strategy, approach, and beautiful photos contributed to our house being sold in no time.
-
Rosario Russo
10