- Available
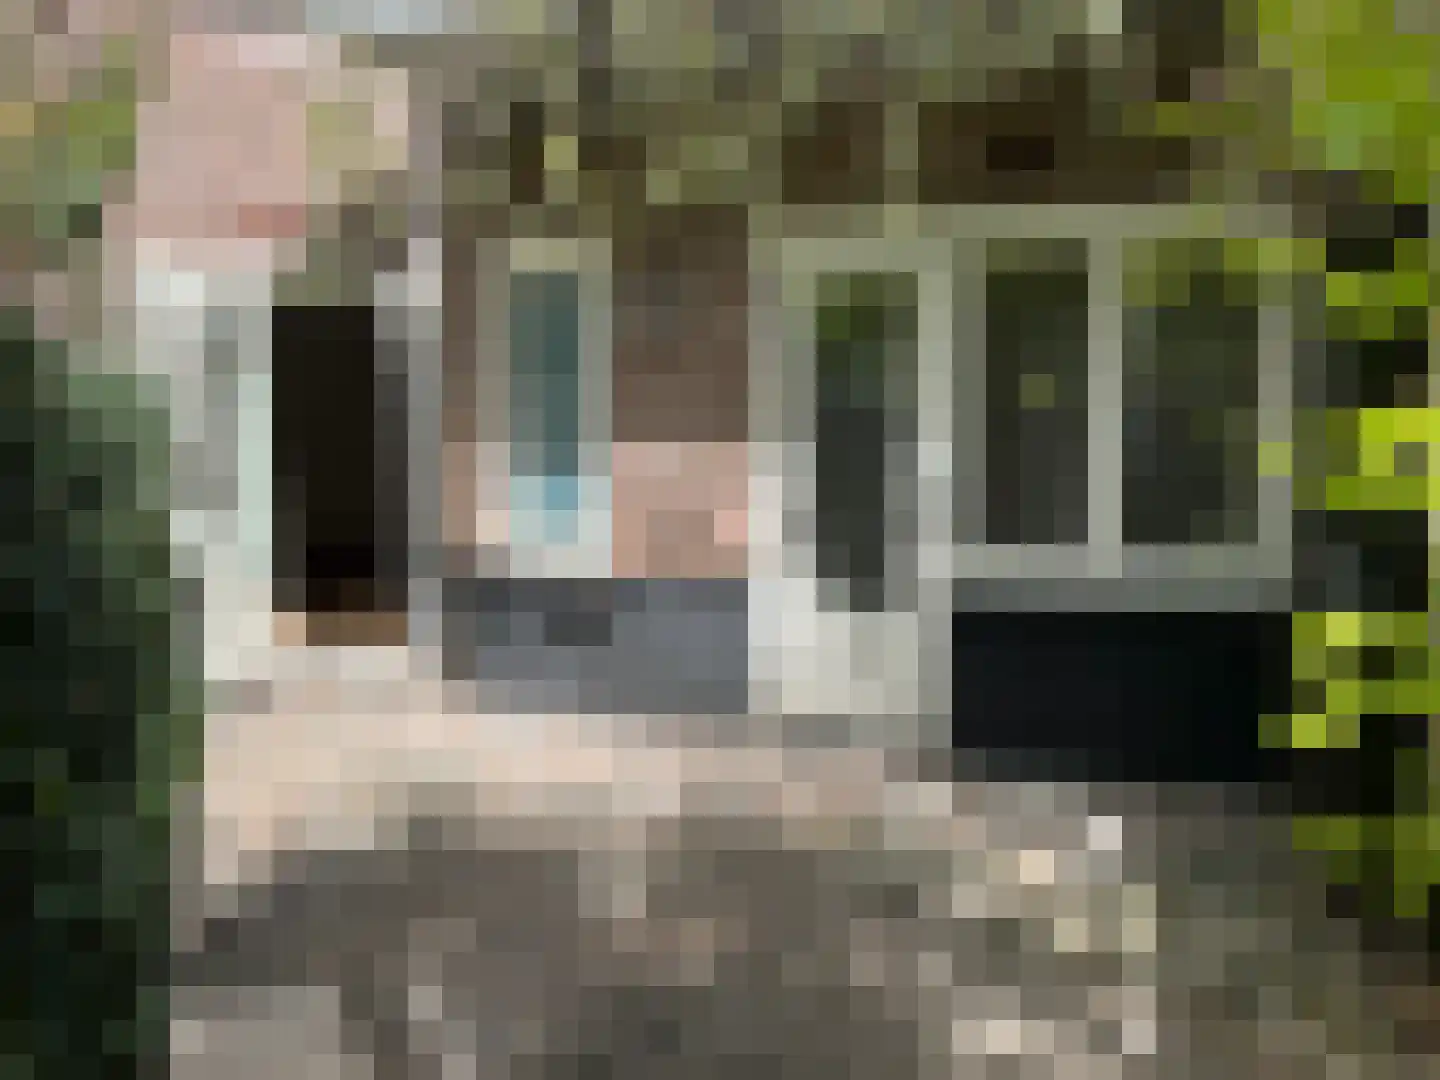
Blasiusstraat 8 1
1091CR Amsterdam
€ 649.000 k.k.
€ 10.141/m²
C
Save as favorite
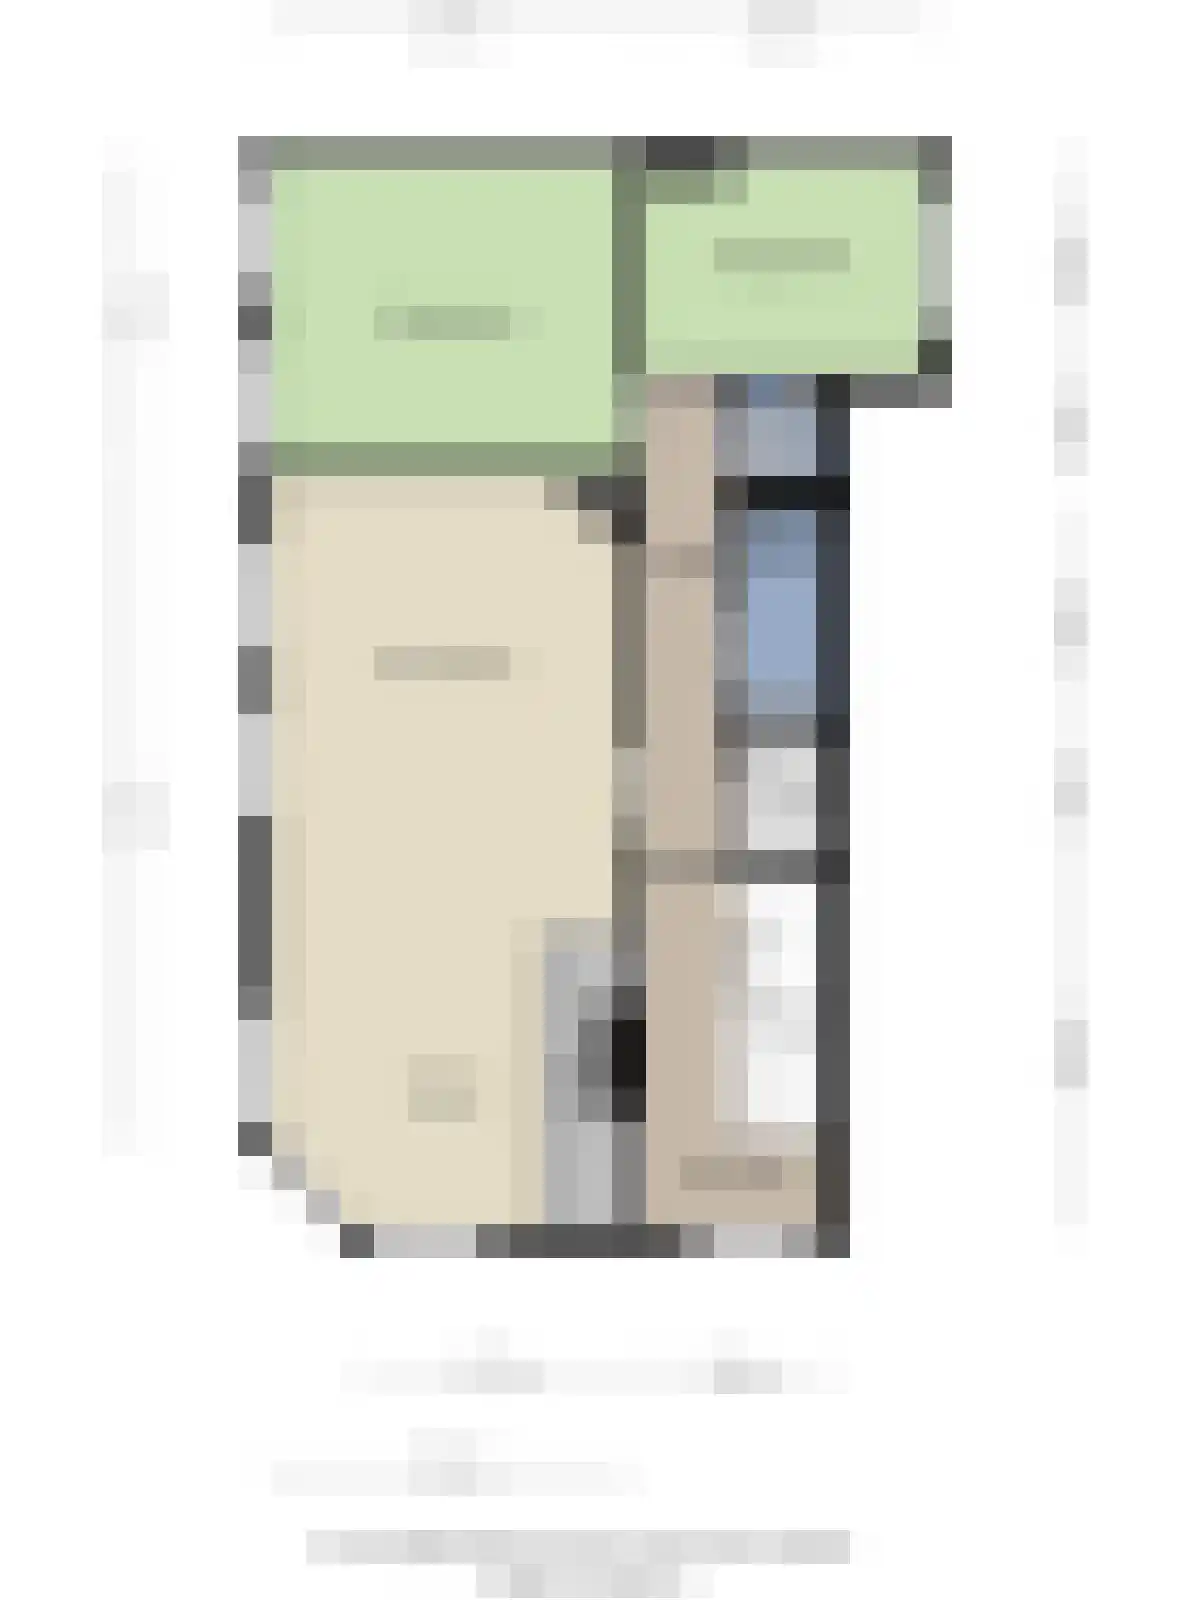
- Living area
- 64 m²
- Land area
- —
- Bedrooms
- 2