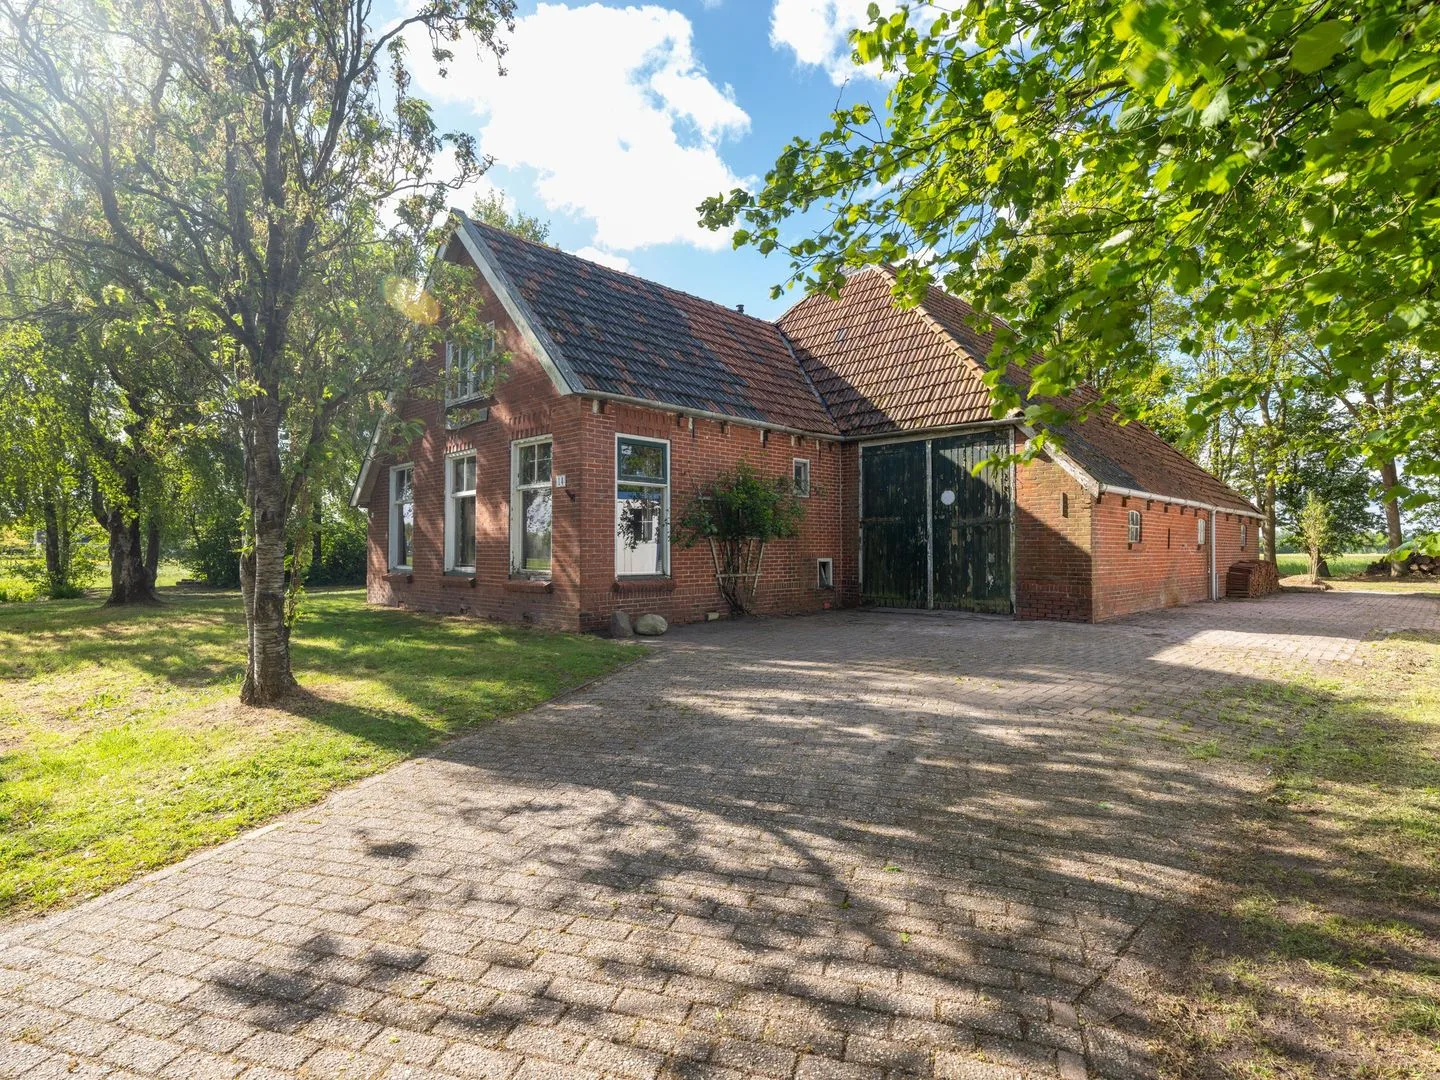
- Available
Slotleane 2
9243SK Bakkeveen
€ 1.495.000 k.k.
€ 6.255/m²
- Living area
- 239 m²
- Land area
- 10290 m²
- Bedrooms
- 4
Searching in 28 houses in Bakkeveen
Type to search. Use arrow down and arrow up to navigate through results and press Enter to open.
Hidden search suggestions.
View current properties in Bakkeveen or search targeted on street, postal code and property characteristics.
View the current housing stock in Bakkeveen and quickly filter by price, living area, rooms and more. There are currently 28 houses in this place within our selection. View also 21 sold houses in Bakkeveen for extra insight into the local housing market.
9243SK Bakkeveen
€ 1.495.000 k.k.
€ 6.255/m²
9243JS Bakkeveen
€ 795.000 k.k.
€ 3.180/m²
9243KJ Bakkeveen
€ 549.500 k.k.
9243SC Bakkeveen
€ 1.777.000 k.k.
€ 4.664/m²
9243JX Bakkeveen
€ 550.000 k.k.
€ 4.044/m²
9243JJ Bakkeveen
€ 425.000 k.k.
€ 4.087/m²
9243JM Bakkeveen
€ 675.000 k.k.
€ 3.902/m²
9243KJ Bakkeveen
€ 615.000 k.k.
€ 3.844/m²
9243KX Bakkeveen
€ 619.000 k.k.
€ 3.641/m²
9243KK Bakkeveen
€ 575.000 k.k.
€ 3.212/m²
9243KH Bakkeveen
€ 365.000 k.k.
€ 2.943/m²
9243KZ Bakkeveen
€ 495.000 k.k.
€ 3.113/m²
9243JB Bakkeveen
€ 295.000 k.k.
€ 3.105/m²
9243JA Bakkeveen
€ 595.000 k.k.
€ 3.198/m²
9243KA Bakkeveen
€ 249.000 k.k.
€ 5.659/m²
9243JC Bakkeveen
€ 389.000 k.k.
€ 3.214/m²
9243JA Bakkeveen
€ 469.000 k.k.
€ 3.448/m²
9243KA Bakkeveen
€ 425.000 k.k.
€ 3.346/m²
9243KJ Bakkeveen
€ 875.000 k.k.
€ 3.216/m²
9243KJ Bakkeveen
€ 725.000 k.k.
€ 3.815/m²
9243JG Bakkeveen
€ 300.000 k.k.
€ 2.678/m²
9243KV Bakkeveen
€ 425.000 k.k.
€ 3.269/m²
9243JX Bakkeveen
€ 699.500 k.k.
€ 4.043/m²
9243KK Bakkeveen
€ 319.000 k.k.
€ 0/m²
9243JE Bakkeveen
€ 225.000 k.k.
€ 1.991/m²
9243KV Bakkeveen
€ 450.000 k.k.
€ 3.061/m²
9243JE Bakkeveen
€ 369.000 k.k.
€ 3.582/m²
9243JN Bakkeveen
€ 474.000 k.k.
€ 3.590/m²
Get free quotes from real estate agents with local market knowledge. Compare more than 17 real estate agents in Bakkeveen.
Selling a home in Bakkeveen? Compare all real estate agents in Bakkeveen or view the top 10 real estate agents in Bakkeveen for extra context for your choice.
Real estate agents make sharper offers when they know you're comparing — ask for quotes for sale or purchase.
Practical answers about housing supply, sales and comparing real estate agents in Bakkeveen.
The costs of a real estate agent in Bakkeveen depend on commission, setup costs, property presentation and the chosen service. Compare the 17 real estate agents in Bakkeveen via the real estate agent page and request multiple quotes to compare rates and approach well.
Within our selection, we are currently showing 28 houses in Bakkeveen. View also the sold houses in Bakkeveen to compare the current offering with recent transactions.
Take into account not only price and living area but also maintenance, energy label, location, outdoor space and sales status. This way you compare houses in Bakkeveen on more than just the asking price.
A local real estate agent knows the neighborhoods, recent transactions and demand in Bakkeveen. By comparing 17 real estate agents in the region you get a better insight into prices, sales strategy and expected yield; the top 10 in Bakkeveen provides a useful starting point.
Yes, when making a sales plan, a valuation in Bakkeveen is wise. You gain insight into a realistic asking price and can then compare offers from real estate agents specifically.
View current location data on residents, WOZ development, housing stock, energy consumption, business activity and safety in Bakkeveen. In 2026 were there 1.888 residents. The average WOZ value in 2018 is EUR 220.000.
These figures help to better assess and compare the housing stock in Bakkeveen with recent sold homes. Orient yourself then on suitable top real estate agents in Bakkeveen for sales advice in this region.
Residents
1.888
Last year: 2026
Average WOZ
EUR 220.000
Last year: 2018
Average income per person.
EUR 30.900
Source: AllNumbers
Crimes (current year)
37
Total registered
| Year | Residents |
|---|---|
| 2021 | 1.905 |
| 2022 | 1.885 |
| 2023 | 1.890 |
| 2024 | 1.915 |
| 2025 | 1.890 |
| 2026 | 1.888 |
| Year | Average WOZ |
|---|---|
| 2014 | EUR 202.000 |
| 2015 | EUR 201.000 |
| 2016 | EUR 198.000 |
| 2017 | EUR 207.000 |
| 2018 | EUR 220.000 |
Hoger
440
Praktisch
370
Middelbaar
620
Europa
50
Nederland
1.745
Buiten Europa
100
Label C
239
Label B
180
Label D
126
Label A
115
Label G
106
Label F
63
Label E
27
Label A+
10
Label A++
5
Label A+++
1
Label A++++
0
Label A+++++
0
| Year | Gas (m3) | Electricity (kWh) |
|---|---|---|
| 2020 | 1.650 | 3.030 |
| 2021 | 1.850 | 3.110 |
| 2022 | 1.460 | 2.960 |
| 2023 | 1.190 | 2.850 |
| 2024 | 1.150 | 2.850 |
Hoekwoning
Gas: 990 • Electricity: 2.330
Huurwoning
Gas: 1.020 • Electricity: 1.980
Koopwoning
Gas: 1.230 • Electricity: 3.090
Appartement
Gas: 740 • Electricity: 1.520
Tussenwoning
Gas: 900 • Electricity: 2.110
Vrijstaande woning
Gas: 1.380 • Electricity: 3.310
Twee-onder-één-kap woning
Gas: 1.030 • Electricity: 2.660
Total number of company establishments: 265
| Period | Crimes |
|---|---|
| jan 2026 | 2 |
| jul 2025 | 1 |
| jun 2025 | 4 |
| mei 2025 | 3 |
| mrt 2025 | 3 |
| mrt 2026 | 4 |
| nov 2024 | 0 |
| nov 2025 | 0 |
| okt 2024 | 2 |
| okt 2025 | 1 |
| sep 2024 | 4 |
| sep 2025 | 3 |
These figures give an indicative picture of safety trends in the living environment of Bakkeveen.
Short answers based on current local statistics, handy for a quick comparison of the living environment.
Bakkeveen telt in 2026 ongeveer 1.888 inwoners.
De gemiddelde WOZ-waarde in Bakkeveen is in 2018 circa € 220.000.
Het gemiddelde inkomen per inwoner in Bakkeveen ligt rond € 30.900 per jaar.
Voor het huidige jaar gaat het om ongeveer 37 geregistreerde misdrijven. Gebruik deze cijfers als indicatie en vergelijk trends per periode.
In Bakkeveen komt vooral "Vrijstaande woningen" veel voor, met ongeveer 462 woningen.