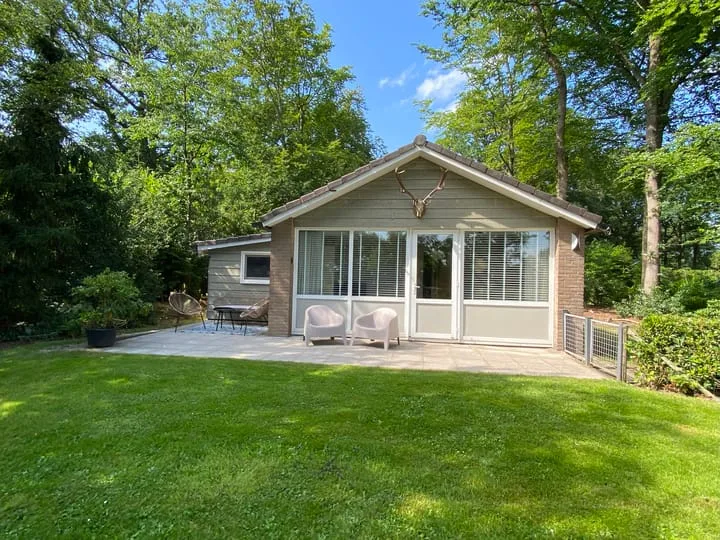
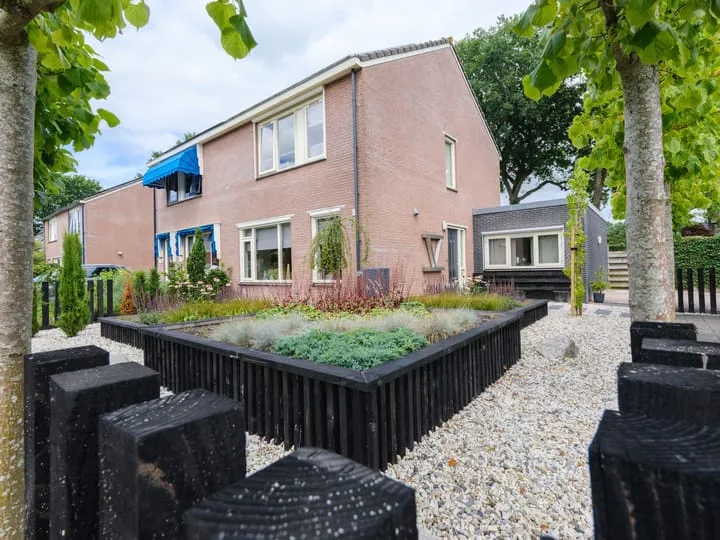
- Sold
Douwelân 20
9243KX Bakkeveen
€ 619.000 k.k.
€ 3.641/m²
- Living area
- 170 m²
- Land area
- 562 m²
- Bedrooms
- 4
View 20 sold houses in Bakkeveen
Type to search. Use arrow down and arrow up to navigate through results and press Enter to open.
Hidden search suggestions.
Compare sold homes in Bakkeveen or view the current offering in this location directly.
On this page you will find recently sold homes in Bakkeveen. Use this overview to better estimate selling prices, popular neighborhoods, and the local housing supply before you choose a real estate agent. Also view the current housing supply with 25 houses in Bakkeveen.
9243KX Bakkeveen
€ 619.000 k.k.
€ 3.641/m²
9243KK Bakkeveen
€ 575.000 k.k.
€ 3.212/m²
9243KH Bakkeveen
€ 365.000 k.k.
€ 2.943/m²
9243KZ Bakkeveen
€ 495.000 k.k.
€ 3.113/m²
9243JB Bakkeveen
€ 295.000 k.k.
€ 3.105/m²
9243JA Bakkeveen
€ 595.000 k.k.
€ 3.198/m²
9243KA Bakkeveen
€ 249.000 k.k.
€ 5.659/m²
9243JC Bakkeveen
€ 389.000 k.k.
€ 3.214/m²
9243JA Bakkeveen
€ 469.000 k.k.
€ 3.448/m²
9243KA Bakkeveen
€ 425.000 k.k.
€ 3.346/m²
9243KJ Bakkeveen
€ 875.000 k.k.
€ 3.216/m²
9243KJ Bakkeveen
€ 725.000 k.k.
€ 3.815/m²
9243JG Bakkeveen
€ 300.000 k.k.
€ 2.678/m²
9243KV Bakkeveen
€ 425.000 k.k.
€ 3.269/m²
9243JX Bakkeveen
€ 699.500 k.k.
€ 4.043/m²
9243KK Bakkeveen
€ 319.000 k.k.
€ 0/m²
9243JE Bakkeveen
€ 225.000 k.k.
€ 1.991/m²
9243KV Bakkeveen
€ 450.000 k.k.
€ 3.061/m²
9243JE Bakkeveen
€ 369.000 k.k.
€ 3.582/m²
9243JN Bakkeveen
€ 474.000 k.k.
€ 3.590/m²
View recent sales and receive free quotes from local real estate agents. Compare more than 18 real estate agents in Bakkeveen.
Selling your own home in Bakkeveen? Compare real estate agents in Bakkeveen or view the best real estate agents in Bakkeveen as a reference for your choice.
Real estate agents make sharper offers when they know you're comparing — ask for quotes for sale or purchase.
Short answers about housing prices, sold homes and comparing real estate agents in Bakkeveen.
The costs of a real estate agent in Bakkeveen vary per office, property type and sales approach. In Bakkeveen you can compare 18 real estate agents; therefore also look at the real estate agents in Bakkeveen to better compare fees, presentation and local experience.
On this page we currently show 20 sold houses in Bakkeveen from our selection. This helps you to better assess recent transactions and the local housing market.
Houses sold in Bakkeveen give insight into asking prices, house types and neighborhoods where recent transactions have taken place. Compare this also with the current housing stock in Bakkeveen to better understand the market.
You can use sold homes as a first market indication, but a local real estate agent can better take into account finishing, location, maintenance and current demand in Bakkeveen.
Compare the 18 real estate agents in Bakkeveen on local sales experience, reviews, expected yield, commission and marketing approach. View real estate agents in Bakkeveen or the top 10 agents in Bakkeveen to quickly discover strong offices.
View current location data on residents, WOZ development, housing stock, energy consumption, business activity and safety in Bakkeveen. In 2025 were there 1.890 residents. The average WOZ value in 2018 is EUR 220.000.
These figures help to better assess and compare the housing stock in Bakkeveen with recent sold homes. Orient yourself then on suitable top real estate agents in Bakkeveen for sales advice in this region.
Residents
1.890
Last year: 2025
Average WOZ
EUR 220.000
Last year: 2018
Average income per person.
EUR 30.900
Source: AllNumbers
Crimes (current year)
37
Total registered
| Year | Residents |
|---|---|
| 2021 | 1.905 |
| 2022 | 1.885 |
| 2023 | 1.890 |
| 2024 | 1.915 |
| 2025 | 1.890 |
| Year | Average WOZ |
|---|---|
| 2014 | EUR 202.000 |
| 2015 | EUR 201.000 |
| 2016 | EUR 198.000 |
| 2017 | EUR 207.000 |
| 2018 | EUR 220.000 |
Hoger
440
Praktisch
370
Middelbaar
620
Europa
50
Nederland
1.745
Buiten Europa
100
Label C
239
Label B
180
Label D
126
Label A
115
Label G
106
Label F
63
Label E
27
Label A+
10
Label A++
5
Label A+++
1
Label A++++
0
Label A+++++
0
| Year | Gas (m3) | Electricity (kWh) |
|---|---|---|
| 2020 | 1.650 | 3.030 |
| 2021 | 1.850 | 3.110 |
| 2022 | 1.460 | 2.960 |
| 2023 | 1.190 | 2.850 |
| 2024 | 1.150 | 2.850 |
Hoekwoning
Gas: 990 • Electricity: 2.330
Huurwoning
Gas: 1.020 • Electricity: 1.980
Koopwoning
Gas: 1.230 • Electricity: 3.090
Appartement
Gas: 740 • Electricity: 1.520
Tussenwoning
Gas: 900 • Electricity: 2.110
Vrijstaande woning
Gas: 1.380 • Electricity: 3.310
Twee-onder-één-kap woning
Gas: 1.030 • Electricity: 2.660
Total number of company establishments: 265
| Period | Crimes |
|---|---|
| jan 2025 | 1 |
| jan 2026 | 2 |
| jul 2025 | 1 |
| jun 2025 | 4 |
| mei 2025 | 3 |
| mrt 2025 | 3 |
| nov 2024 | 0 |
| nov 2025 | 0 |
| okt 2024 | 2 |
| okt 2025 | 1 |
| sep 2024 | 4 |
| sep 2025 | 3 |
These figures give an indicative picture of safety trends in the living environment of Bakkeveen.
Short answers based on current local statistics, handy for a quick comparison of the living environment.
Bakkeveen telt in 2025 ongeveer 1.890 inwoners.
De gemiddelde WOZ-waarde in Bakkeveen is in 2018 circa € 220.000.
Het gemiddelde inkomen per inwoner in Bakkeveen ligt rond € 30.900 per jaar.
Voor het huidige jaar gaat het om ongeveer 37 geregistreerde misdrijven. Gebruik deze cijfers als indicatie en vergelijk trends per periode.
In Bakkeveen komt vooral "Vrijstaande woningen" veel voor, met ongeveer 462 woningen.