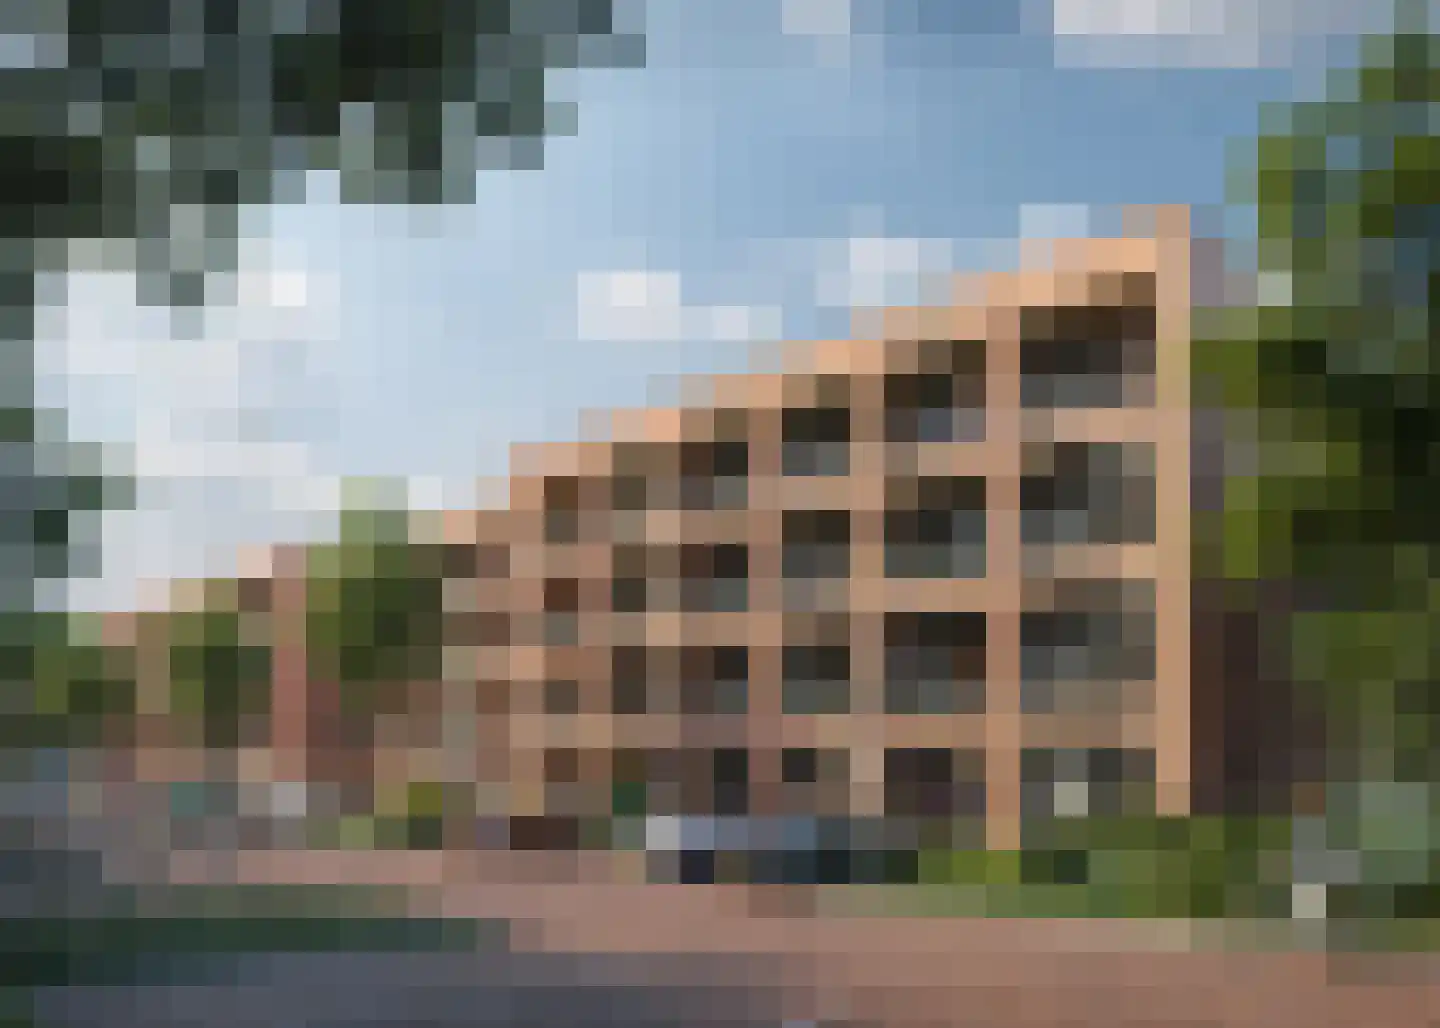
- Sold
Roosbergseweg 5 A
4854PL Bavel
€ 1.449.000 k.k.
€ 7.245/m²
- Living area
- 200 m²
- Land area
- 3572 m²
- Bedrooms
- 5
View 79 sold houses in Bavel
Type to search. Use arrow down and arrow up to navigate through results and press Enter to open.
Hidden search suggestions.
Compare sold homes in Bavel or view the current offering in this location directly.
On this page you will find recently sold homes in Bavel. Use this overview to better estimate selling prices, popular neighborhoods, and the local housing supply before you choose a real estate agent. Also view the current housing supply with 103 houses in Bavel.
4854PL Bavel
€ 1.449.000 k.k.
€ 7.245/m²
4854CH Bavel
€ 510.000 k.k.
€ 4.080/m²
4854BL Bavel
€ 520.000 k.k.
€ 4.297/m²
4854NE Bavel
€ 1.365.000 k.k.
€ 6.066/m²
4854RM Bavel
€ 789.000 k.k.
€ 4.241/m²
4854KK Bavel
€ 579.000 k.k.
€ 4.559/m²
4854RT Bavel
€ 695.000 k.k.
€ 4.186/m²
4854SC Bavel
€ 699.000 k.k.
€ 4.957/m²
4854SJ Bavel
€ 825.000 k.k.
€ 4.661/m²
4854NA Bavel
€ 335.000
€ 5.982/m²
4854NA Bavel
€ 335.000
€ 5.982/m²
4854NA Bavel
€ 335.000
€ 5.982/m²
4854NA Bavel
€ 335.000
€ 5.982/m²
4854NA Bavel
€ 355.000
€ 5.917/m²
4854NA Bavel
€ 935.000
€ 6.825/m²
4854NV Bavel
€ 885.000 k.k.
€ 5.267/m²
4854AJ Bavel
€ 775.000 k.k.
€ 4.036/m²
4854LJ Bavel
€ 575.000 k.k.
€ 4.136/m²
4854GL Bavel
€ 620.000 k.k.
€ 4.492/m²
4854PT Bavel
€ 348.000 k.k.
€ 4.046/m²
4854EH Bavel
€ 695.000 k.k.
€ 4.136/m²
4854CD Bavel
€ 1.295.000 k.k.
€ 4.288/m²
4854GN Bavel
€ 550.000 k.k.
€ 3.985/m²
4854MA Bavel
€ 489.000 k.k.
€ 4.527/m²
4854LC Bavel
€ 485.000 k.k.
€ 4.217/m²
4854KK Bavel
€ 550.000 k.k.
€ 4.782/m²
4854BA Bavel
€ 650.000 k.k.
€ 0/m²
4854PK Bavel
€ 1.550.000 k.k.
€ 0/m²
Bekijk recente verkopen en ontvang gratis offertes van lokale verkoopmakelaars in Bavel.
Zelf je woning verkopen in Bavel? Vergelijk verkoopmakelaars in Bavel of bekijk de beste verkoopmakelaars in Bavel als referentie bij jouw keuze.
Makelaars maken scherpere voorstellen als ze weten dat je vergelijkt — vraag offertes aan voor verkoop of aankoop.
Short answers about housing prices, sold homes and comparing real estate agents in Bavel.
The costs of a real estate agent in Bavel vary per office, property type and sales approach. Therefore, compare multiple quotes and also look at the real estate agents in Bavel to better compare rates, presentation and local experience.
On this page we currently show 79 sold houses in Bavel from our selection. This helps you to better assess recent transactions and the local housing market.
Houses sold in Bavel give insight into asking prices, house types and neighborhoods where recent transactions have taken place. Compare this also with the current housing stock in Bavel to better understand the market.
You can use sold homes as a first market indication, but a local real estate agent can better take into account finishing, location, maintenance and current demand in Bavel.
Vergelijk makelaars in Bavel op lokale verkoopervaring, reviews, verwachte opbrengst, courtage en marketingaanpak. Bekijk verkoopmakelaars in Bavel of de top 10 makelaars in Bavel om snel sterke kantoren te ontdekken.
View current location data on residents, WOZ development, housing stock, energy consumption, business activity and safety in Bavel. In 2025 were there 8.375 residents. The average WOZ value in 2025 is EUR 602.000.
These figures help to better assess and compare the housing stock in Bavel with recent sold homes. Orient yourself then on suitable top real estate agents in Bavel for sales advice in this region.
Residents
8.375
Last year: 2025
Average WOZ
EUR 602.000
Last year: 2025
Average income per person.
EUR 43.300
Source: AllNumbers
Crimes (current year)
213
Total registered
| Year | Residents |
|---|---|
| 2021 | 8.335 |
| 2022 | 8.375 |
| 2023 | 8.485 |
| 2024 | 8.430 |
| 2025 | 8.375 |
| Year | Average WOZ |
|---|---|
| 2021 | EUR 464.000 |
| 2022 | EUR 489.000 |
| 2023 | EUR 553.000 |
| 2024 | EUR 566.000 |
| 2025 | EUR 602.000 |
Hoger
2.810
Praktisch
1.250
Middelbaar
2.170
Europa
560
Nederland
7.195
Buiten Europa
625
Label A
1.048
Label C
990
Label B
549
Label D
296
Label G
132
Label F
121
Label A++
107
Label A+++
105
Label E
86
Label A+
39
Label A++++
5
Label A+++++
0
| Year | Gas (m3) | Electricity (kWh) |
|---|---|---|
| 2020 | 1.340 | 3.790 |
| 2021 | 1.460 | 3.850 |
| 2022 | 1.130 | 3.530 |
| 2023 | 950 | 3.320 |
| 2024 | 930 | 3.390 |
Hoekwoning
Gas: 860 • Electricity: 2.840
Huurwoning
Gas: 670 • Electricity: 2.330
Koopwoning
Gas: 1.040 • Electricity: 3.640
Appartement
Gas: 560 • Electricity: 2.040
Tussenwoning
Gas: 610 • Electricity: 3.070
Vrijstaande woning
Gas: 1.410 • Electricity: 4.350
Twee-onder-één-kap woning
Gas: 1.170 • Electricity: 3.350
Total number of company establishments: 1.190
| Period | Crimes |
|---|---|
| jan 2026 | 13 |
| jul 2025 | 21 |
| jun 2025 | 19 |
| mei 2025 | 31 |
| mrt 2025 | 13 |
| mrt 2026 | 13 |
| nov 2024 | 14 |
| nov 2025 | 13 |
| okt 2024 | 10 |
| okt 2025 | 15 |
| sep 2024 | 19 |
| sep 2025 | 26 |
These figures give an indicative picture of safety trends in the living environment of Bavel.
Short answers based on current local statistics, handy for a quick comparison of the living environment.
Bavel telt in 2025 ongeveer 8.375 inwoners.
De gemiddelde WOZ-waarde in Bavel is in 2025 circa € 602.000.
Het gemiddelde inkomen per inwoner in Bavel ligt rond € 43.300 per jaar.
Voor het huidige jaar gaat het om ongeveer 213 geregistreerde misdrijven. Gebruik deze cijfers als indicatie en vergelijk trends per periode.
In Bavel komt vooral "Tussenwoningen" veel voor, met ongeveer 1.083 woningen.